An excellent article in the Financial Times, published this past Monday, illuminates one major challenge of estimating a vaccine campaign’s success: population data are not always reliable. Health reporter Oliver Barnes and data reporter John Burn-Murdoch explain that, in several countries and smaller regions, inaccurate counts of how many people live in the region have led to vaccination rate estimates that make the area’s vaccine campaign look more successful—or less successful—than it really is.
Why does this happen? It’s actually pretty challenging to get a precise count of how many people live somewhere. Think about the U.S. Census, for example: this program attempts to count every person living in the country, once every ten years. But it may miss people who don’t have a straightforward living situation (like college students, the incarcerated, and people living in shelters); it may have confusing messaging that discourages some people (like undocumented residents) from filling out the necessary form; and some people may simply choose not to give information to the government.
When the Census is inaccurate, the inaccuracies ripple out to different government analyses—including analyses of how many people have been vaccinated. Here’s a quote from the Financial Times article:
“The average person would be surprised that governments don’t know how many people are actually in the country,” said Stian Westlake, chief executive of the UK’s Royal Statistical Society. “But this great unknown can cause a whole host of data glitches, especially when responding to a health emergency.”
The Financial Times provides several examples of these data glitches leading to incorrect vaccination estimates.
In England: Overestimates of the unvaccinated population, based on data from the U.K.’s Health Security Agency, suggest that case rates are lower among unvaccinated Brits than they actually are.
In several EU countries: Underestimates of the senior population lead to vaccination rates inaccurately suggesting that over 100% of certain age groups in Ireland, Portugal, and other countries have received at least one dose of a vaccine.
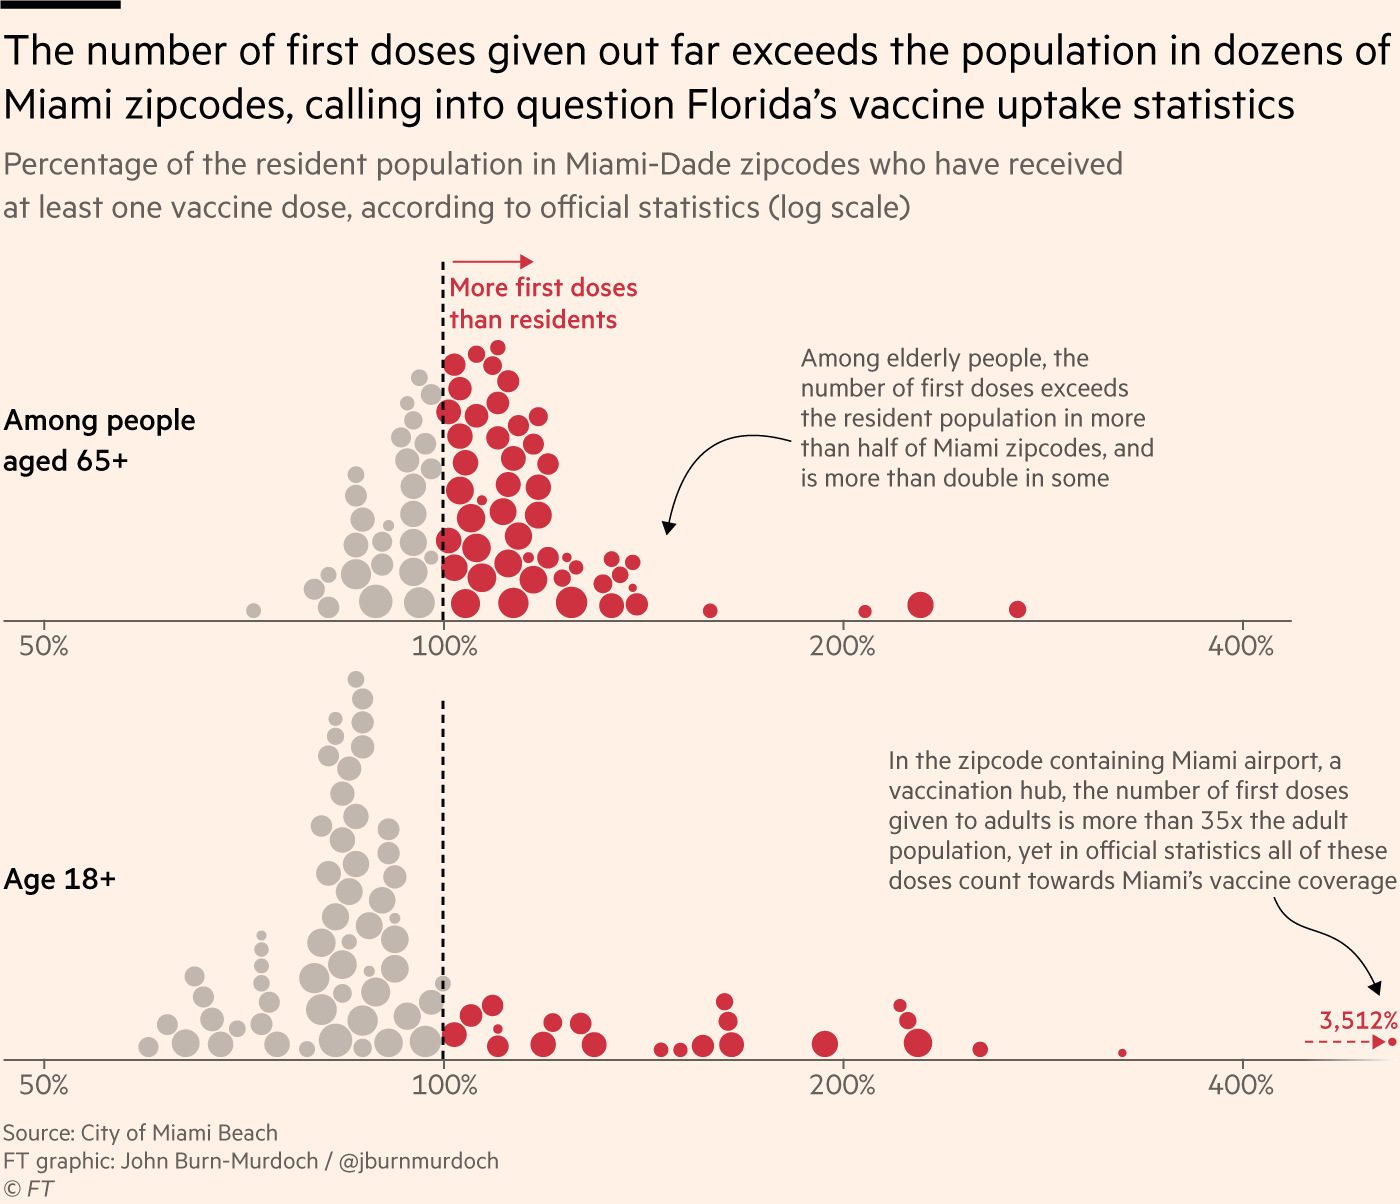
In Miami, Florida: A number of ZIP codes have senior vaccination rates that appear to be over 100% of seniors, due to retirees (who do not have permanent residence in Florida, and therefore aren’t counted in the state’s population) getting vaccinated in Miami during their winter vacations.
Incorrect vaccination rates can cause issues for public health agencies leading vaccine campaigns, the Financial Times reports. If you think you have vaccinated 100% of seniors in your county due to population underestimates, you likely aren’t looking out for the seniors who in fact remain unvaccinated—leaving those seniors still vulnerable to COVID-19.
At the same time, data glitches can provide fodder for anti-vax groups. “Worst of all, anti-vaxxers and Covid deniers feed on the daylight between reality and the incomplete data we currently have as evidence of a grand conspiracy or bureaucratic incompetence,” Jennifer Nuzzo, epidemiologist Jennifer Nuzzo told the Financial Times.
I recommend reading the Financial Times article in full. But you can also check out this Twitter thread from John Burn-Murdoch for more highlights:
NEW: people obsess over vaccine uptake stats, eagerly comparing one country to others to see which has jabbed the highest share of its population, but what if I told you many — perhaps most — of those stats are wrong?
Time for a thread on bad Covid data and how it can cost lives
This week, the FDA’s vaccine advisory committee had a two-day meeting to discuss booster shots for Moderna’s and Johnson & Johnson’s COVID-19 vaccines. From the outside, these meetings may have appeared fairly straightforward: the committee voted unanimously to recommend booster shots for both vaccines.
But in fact, the discussions on both days were wide-reaching and full of questions, touching on the many continued gaps in our knowledge about the need for additional vaccine doses. The FDA committee continues to make decisions based on rather limited data, as do other top U.S. officials. Case in point: on Thursday, the committee was asked to consider data from Israel’s booster shot campaign—which is utilizing Pfizer vaccines—as evidence for Moderna boosters in the U.S.
In the Moderna vote on Thursday afternoon, committee member Dr. Patrick Moore, a virologist at the University of Pittsburgh, said that he voted “on gut feeling rather than really truly serious data.” The comment exemplified how much we still don’t know regarding the need for boosters, thanks in large part to the CDC’s failure to comprehensively track breakthrough cases in the U.S.
Um. Am I the only person who is seriously bothered to hear a VRBPAC committee member say he voted "on gut feeling rather than really truly serious data"?
Still, there are a few major facts that we have learned since the FDA and CDC discussions on Pfizer boosters that took place a couple of weeks ago. Here’s my summary of what we’ve learned—and what we still don’t know.
What we’ve learned since the Pfizer discussion:
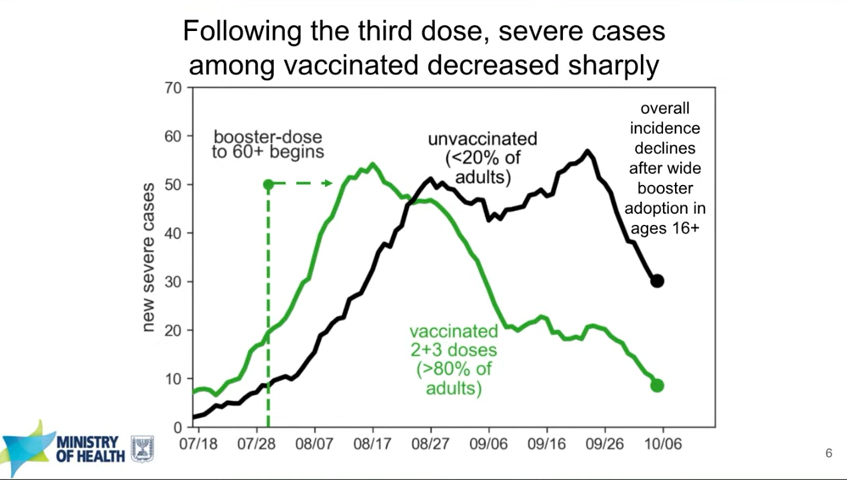
Israel’s booster rollout continues to align with falling case numbers. On Thursday, representatives from the Israeli national health agency presented data on their booster shot rollout—which, again, is using Pfizer vaccines. The vast majority of seniors in Israel have now received a third dose, and over 50% of other age groups have as well. According to the Israeli scientists, this booster rollout both decreased the risk of severe COVID-19 disease for older adults and helped to curb the country’s Delta-induced case wave, causing even unvaccinated adults to have a decreased risk of COVID-19.
In Israel, severe cases among both vaccinated and unvaccinated adults decreased after the country provided third Pfizer doses to its residents. Screenshot taken from Thursday’s VRBPAC meeting.
You can read more about Israel’s booster campaign in this paper, published in the New England Journal of Medicine in early October. It’s worth noting, however, that Delta is known to spur both case increases and decreases in cycles that can be somewhat unpredictable—and may not be exactly linked to vaccination. So, I personally take the Israeli claims that boosters stopped their case wave with a grain of salt.
Spain and Italy have finished this wave and Israel is almost done; the UK and Germany are on the rise, and the US is headed down. Delta isn't correlated with % vaccinated. Israel argues it is boosters, but causality is not assignable. The rise and fall of COVID is complex. pic.twitter.com/UVwcoFJIuP
Decreased vaccine effectiveness against infection may be tied more to Delta and behavioral factors than “waning antibodies.” This week, the New York State Department of Health (DOH) announced results from a large study of vaccine effectiveness which is, from what I’ve seen, the first of its kind in the U.S. The New York DOH used state databases on COVID-19 vaccinations, tests, and hospitalizations to examine vaccine effectiveness against both infection and hospitalization in summer 2021, when Delta spread rapidly through the state.
They found that vaccine effectiveness against infection did decline over the summer. But the declines occurred similarly for all age groups, vaccine types, and vaccine timing (i.e. which month the New Yorkers in the study received their vaccines)—suggesting that the decline in effectiveness was not tied to waning immune system protection. Rather, the effectiveness decline correlated well with Delta’s rise in the state. It also correlated with reduced safety behaviors, like the lifting of New York’s indoor mask mandate and the reopening of various businesses.
Vaccine effectiveness against hospitalization declined for older adults, but remained at very high levels for New Yorkers under age 65, the study found. Here’s what lead author Dr. Eli Rosenberg said in a statement:
The findings of our study support the need for boosters in older people in particular, and we encourage them to seek out a booster shot from their health care provider, pharmacy or mass vaccination site. We saw limited evidence of decline in effectiveness against severe disease for people ages 18 to 64 years old. While we did observe early declines in effectiveness against infections for this age group, this appears to have leveled off when the Delta variant became the predominant strain in New York. Together, this suggests that ongoing waning protection may be less of a current concern for adults younger than 65 years.
I was surprised that this study didn’t come up in the FDA advisory committee meetings this week, and will be curious to see if it’s cited in future booster shot discussions. The study does align, however, with the committee’s decision against recommending booster shots for all adults over age 18 who received Moderna vaccines.
Johnson & Johnson vaccine recipients appear to need boosters more than mRNA vaccine recipients. On Friday, presentations from both J&J representatives and FDA scientists made a clear case for giving J&J vaccine recipients a second dose of this adenovirus vaccine. In one 30,000-patient study, patients who received a second J&J shot two months after their first shot saw their vaccine efficacy (against symptomatic infection) rise from 74% to 94%.
Interestingly, unlike the Pfizer and Moderna vaccines, a J&J shot’s ability to protect against coronavirus infection appears relatively stable over time. However, a booster shot can make this vaccine more effective—especially against variants. Despite arguments from J&J representatives that their vaccine’s second dose should come six months after the first dose, the FDA advisory committee voted to recommend second J&J shots just two months after the first dose, for all adults over age 18.
It’s worth noting that this vaccine regimen might effectively change J&J’s product from a one-shot vaccine to a two-shot vaccine. STAT’s Helen Branswell and Matthew Herper go into the situation more in their liveblog.
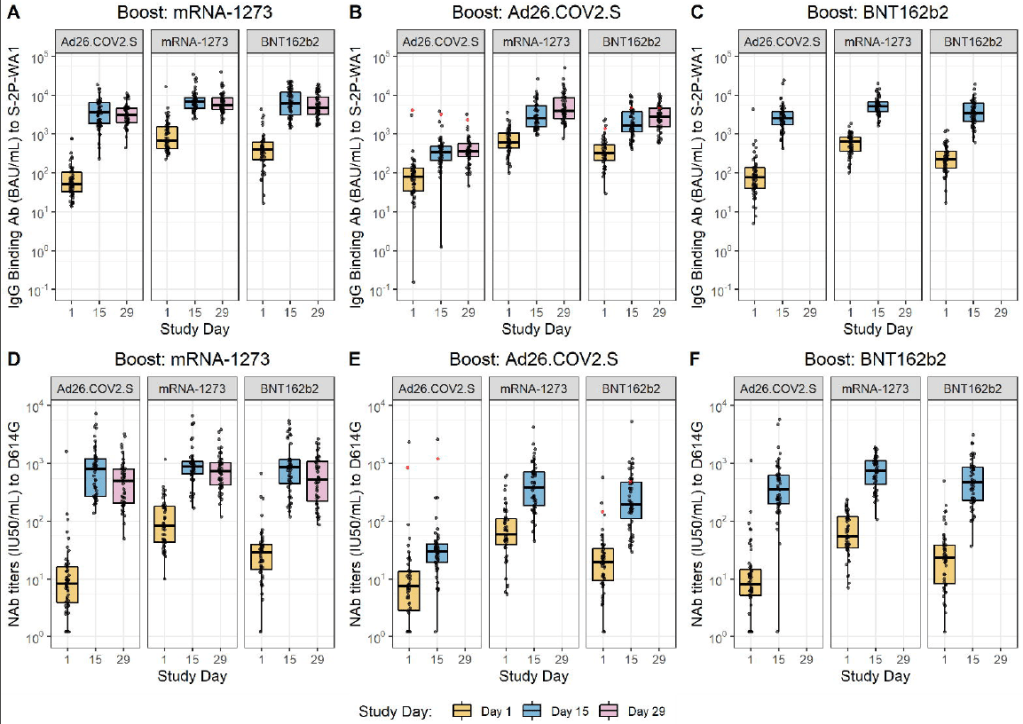
Mixing and matching vaccines is a strong strategy for boosting immunity, especially if one of the vaccines involved uses mRNA technology. This week, the National Institutes of Health (NIH) released a highly anticipated study (posted as a preprint) on mix-and-match vaccine regimens. The NIH researchers essentially tested every possible booster combination among the three vaccines that have been authorized in the U.S. Before and after vaccination, the researchers took blood samples and tested for antibodies that would protect against the coronavirus.
In short, the NIH study found that all three vaccines—Pfizer, Moderna, and J&J—will provide a clear antibody boost to people who have received any other vaccine. But the mRNA vaccines (Pfizer and Moderna) provide bigger benefits, both in the form of higher baseline antibody levels (after two shots) and a higher boost. The best combination was a J&J vaccine initially, followed by a Moderna booster, Dr. Katelyn Jetelina notes in a Your Local Epidemiologist summary of the study.
Every vaccine provided a “boost” of protective antibodies to recipients of every other vaccine. Figure from the NIH preprint. mrna-1273 refers to the Moderna vaccine, Ad26.COV2.S refers to the J&J vaccine, and BNT162b2 refers to the Pfizer vaccine.
The booster regimens also appeared to be safe, with limited side effects. But this was a relatively small study, including about 450 people. In their discussion on Friday afternoon, the FDA advisory committee members said that they would be very likely to authorize mix-and-match vaccine regimens after seeing more safety data.
Moderna and J&J boosters appear to be safe, with similar side effects to second shots. Safety data from Moderna’s and J&J’s clinical trials of their booster shots, along with data from the NIH mix-and-match study, indicate that the additional doses cause similar side effects to first and second doses. After a booster, most recipients had a sore arm, fatigue, and other relatively minor side effects.
And here’s what we still don’t know:
Which medical conditions, occupations, and other settings confer higher breakthrough case risk? I wrote about this issue in detail in September. The U.S. continues to have little-to-no data on breakthrough case risk by specific population group, whether that’s groups of people with a specific medical condition or occupation. This data gap persists, even though U.S. researchers have some avenues for breakthrough risk analysis at their disposal (see: this post from last week).
This lack of data came up in FDA advisory committee discussions on Thursday. An FDA representative was unable to cite any evidence that people in specific occupational settings are at a higher risk for breakthrough cases.
Question from Cody Meisner again about data that shows people in certain occupational settings more vulnerbale to severe covid?
Are there any rare vaccine side effects that may occur after breakthrough doses? When I covered the FDA advisory committee meeting on Pfizer boosters, I noted that Pfizer’s clinical trial of these shots included just 306 participants—providing the committee members with very limited data on rare adverse events, like myocarditis. Well, Moderna’s clinical trial of its booster shots was even smaller: just 171 people. J&J had a larger clinical trial, including over 9,000 people.
These trials and the NIH mix-and-match study indicated that booster shots cause similar side effects to first and second shots, as I noted above. But few clinical trials are large enough to catch very rare (yet more serious) side effects like myocarditis and blood clots. (In J&J’s case, blood clots occur roughly twice for every million doses administered.) Federal officials will carefully watch for any side effects that show up when the U.S.’s booster rollout begins for Moderna and J&J.
How do antibody levels correlate to protection against COVID-19, and what other aspects of the immune system are involved? The NIH mix-and-match study focused on measuring antibody levels in vaccine recipients’ blood, as did other booster shot trials. While it may sound impressive to say, for example, “J&J recipients had a 76-fold increase in neutralizing antibodies after receiving a Moderna booster,” we don’t actually know how this corresponds to protection against COVID-19 infection, severe disease, and death.
Some experts—including a couple of those on the FDA advisory committee—have said that discussions focusing on antibodies distract from other types of immunity, like the memory cells that retain information about a virus long after antibody levels have fallen. More research is needed to tie various immune system measurements to real-world protection against the coronavirus.
What needs to happen at the FDA for mix-and-match vaccination to be authorized? One challenge now facing the FDA is, the federal agency has clear evidence that mix-and-match vaccine regimens are effective—but it does not have a traditional regulatory pathway to follow in authorizing these regimens. Typically, a company applies for FDA authorization of its specific product. And right now, no vaccine company wants to apply for authorization of a regimen that would involve people getting a different product from the one that brings this company profit.
So, how will the FDA move forward? There are a couple of options, like the CDC approving mix-and-match boosters directly. See this article for more info.
Finally: I can’t end this post without acknowledging that, as we discuss booster shots in the U.S., millions of people in low-income countries have yet to even receive their first doses. Many countries in Africa have under 1% of their populations vaccinated, according to the Bloomberg tracker. While the Biden administration has pledged to donate doses abroad, boosters take up airtime in expert discussions and in the media—including in this publication. Boosters distract from discussions of what it will take to vaccinate the world, which is our true way out of the pandemic.
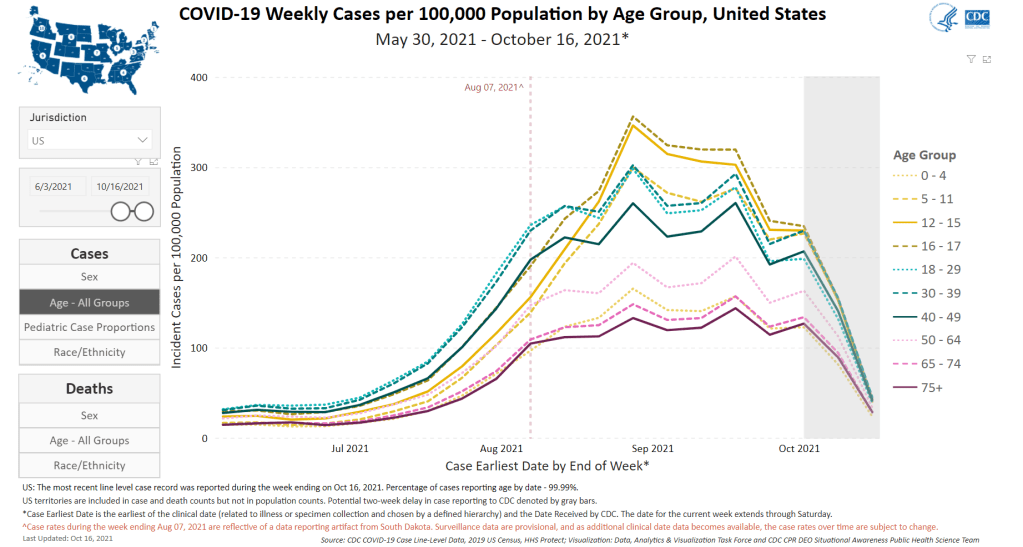
Cases are going down for all age groups, but children continue to have high COVID-19 rates. Chart from the CDC.
In the past week (October 9 through 15), the U.S. reported about 600,000 new cases, according to the CDC. This amounts to:
An average of 85,000 new cases each day
180 total new cases for every 100,000 Americans
13%fewer new cases than last week (October 2-8)
Last week, America also saw:
47,000 new COVID-19 patients admitted to hospitals (14 for every 100,000 people)
9,000 new COVID-19 deaths (2.7 for every 100,000 people)
100% of new cases are Delta-caused (as of October 9)
An average of 700,000 vaccinations per day (including booster shots; per Bloomberg)
COVID-19 cases continue to drop across the U.S., slowly but surely. We’re now reporting about 85,000 new cases a day, down from 97,000 new cases a day last week, down from 108,000 new cases a day the week before last.
Hospitalizations and deaths are falling nationwide as well. About 57,000 Americans are currently hospitalized with COVID-19, down 12% from last week. And about 1,200 people are dying from the disease each day, the vast majority of them unvaccinated.
Still, most states continue to experience “high transmission,” per the CDC’s categories. Hawaii, Florida, and Alabama, three states that saw intense Delta surges in recent months, have now joined California and Connecticut in crossing the threshold to “substantial transmission”—with under 100 new cases for every 100,000 people in the past week, according to the latest Community Profile Report.
Alaska, Montana, and Wyoming remain the most intense hotspots, with over 500 new cases for every 100,000 people in the past week. In Alaska, hospitals are still in crisis mode, with doctors forced to choose which patients they must prioritize for care. All three states are seeing case rates decrease, though, indicating that they may be past the peak of their surges.
While cases among children are trending slightly downward as well, the number remains much higher than at other points in the pandemic. In the week ending October 7, cases among children represented about one in four COVID-19 cases reported in the U.S., according to the American Academy of Pediatrics.
Vaccinations continue to be dominated by booster shots, with boosters making up between one-third and half of the doses administered each day this week. Already, 14% of U.S. seniors have received a booster dose, according to the CDC. 5% of the US population overall has received a booster dose. These numbers will only increase as Moderna and J&J boosters are authorized, following FDA advisory committee recommendations. (More on that later in today’s issue.)
It’s now been almost two months since the CDC approved third vaccine doses for patients with weakened immune systems—and over two weeks since the agency approved third Pfizer doses for patients with increased breakthrough case risk. Since August 13, the CDC’s dashboard says, about 7.3 million Americans have received a third dose.
As I mentioned in today’s National Numbers post, these booster shots are obfuscating the country’s vaccination trends. Over one million people have been vaccinated every day for the past week, but roughly half of those people were getting their booster shots.
One might think I am sourcing that daily booster shot number from the CDC dashboard, but no: it comes, as many key COVID-19 data updates do these days, from the Twitter account of White House COVID-19 Data Director Cyrus Shahpar. The CDC has yet to add any booster shot data to its dashboard beyond a total count of doses administered.
Much as I appreciate Shahpar’s daily updates, I would like to see the agency add those daily booster shot counts to its dashboard. And why stop there? The CDC should also provide information on the demographics of those getting booster shots, such as age and race/ethnicity, as well as geographic trends.
Notably, the New York Times has added a booster shot trendline to its vaccination dashboard; see the chart titled “New reported people vaccinated.” As I noted last week, 15 states have added booster shots to their vaccine dashboards and reports as well, including three states that are reporting demographic breakdowns. The CDC is behind the data reporting curve, as usual.
COVID-19 Vaccine Effectiveness (CDC): The CDC has added a new page to its COVID Data Tracker, focused on visualizing how well the vaccines work. This page includes data from several ongoing studies used by the CDC to monitor vaccine effectiveness: one tracks COVID-19 infection in long-term care facility residents, another tracks hospitalization in veterans, and so on. “This is not a comprehensive representation of all data sets, but the populations being followed are large and well described (if limited),” said science writer Katherine Wu, sharing the new page on Twitter.
COVID-19-Associated Orphanhood in the U.S.: Over 140,000 American children lost a parent or a caregiver during the pandemic, according to a new study from the CDC, Imperial College London, and other collaborators. This study follows another study from Imperial College London that took a global focus (which I featured in the July 25 issue); this new paper includes data broken out by state and by race and ethnicity. Black children were more than twice as likely to lose a parent or caregiver as white children, and Native American children were more than four times as likely.
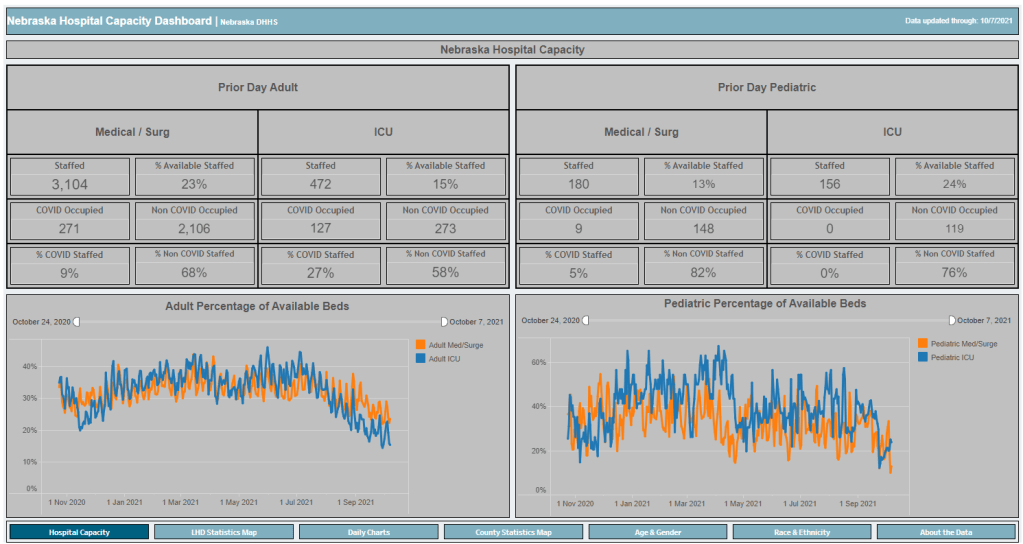
Last week, I called out the state of Nebraska for basically demolishing its COVID-19 vaccination data. I wrote that the state’s “Weekly Data Update” report now includes just two metrics: variants of concern and vaccine breakthroughs. This came after the state discontinued its comprehensive COVID-19 dashboard in late June. (You can see screenshots of the old dashboard here.)
While I was correct in writing that Nebraska’s weekly update is now incredibly sparse, I missed that the state has, in fact, brought back its COVID-19 dashboard—kind-of. A New York Times article by Adeel Hassan and Lisa Waananen Jones alerted me to this update.
Instead of resuming updates of the state’s previous dashboard, Nebraska’s state public health agency has now built a new, less comprehensive one, called the Nebraska Hospital Capacity Dashboard. As you might expect from the title, this new dashboard focuses on hospitalization data, such as the share of hospital beds available state-wide and by local public health region.
But this new dashboard also includes some trends data (new cases, tests, and vaccinations by day, etc.) and demographics data. The demographics data are similar to what Nebraska provided on its old dashboard, reporting total cases, hospitalizations, deaths, and vaccinations by race, ethnicity, age, and gender.
So, allow me to correct last week’s post: Nebraska is currently reporting more vaccination data than what the state is posting on its weekly reports page. However, the new dashboard, is short-lived, according to the NYT:
On Sept. 20, after coronavirus hospitalizations surpassed 10 percent of the state’s capacity of staffed hospital beds, [Nebraska Governor Pete] Ricketts announced that county-level case data would once again be made public on a new “hospital capacity” state dashboard.
But he said the data will disappear again if the number drops below 10 percent on a 7-day rolling average. And the state is still not reporting county-level deaths.
Governor Ricketts ordered the new Hospital Capacity dashboard to be developed after public health experts and state legislators pushed for Nebraska to report more COVID-19 data. With limited state-level data and just a few Nebraska counties providing their own pandemic reports, residents were unable to see how the virus was spreading in their communities for all of July and August—when the Delta surge was at its worst.
The new dashboard is a victory for Nebraska’s public health and medical experts. But state residents have very limited access to testing, leaving some experts to think the data on this dashboard may be “vast underestimates,” the NYT reports.
Nebraska is not alone in cutting down on COVID-19 data reporting in recent months. Florida switched from a detailed dashboard and daily updates to pared-down weekly updates in June, and other states have stopped reporting on weekends or made other cuts. While the CDC and HHS continue to update their datasets daily, a lack of detailed data at the state level may heighten the challenge of another virus surge, if we see one this winter.
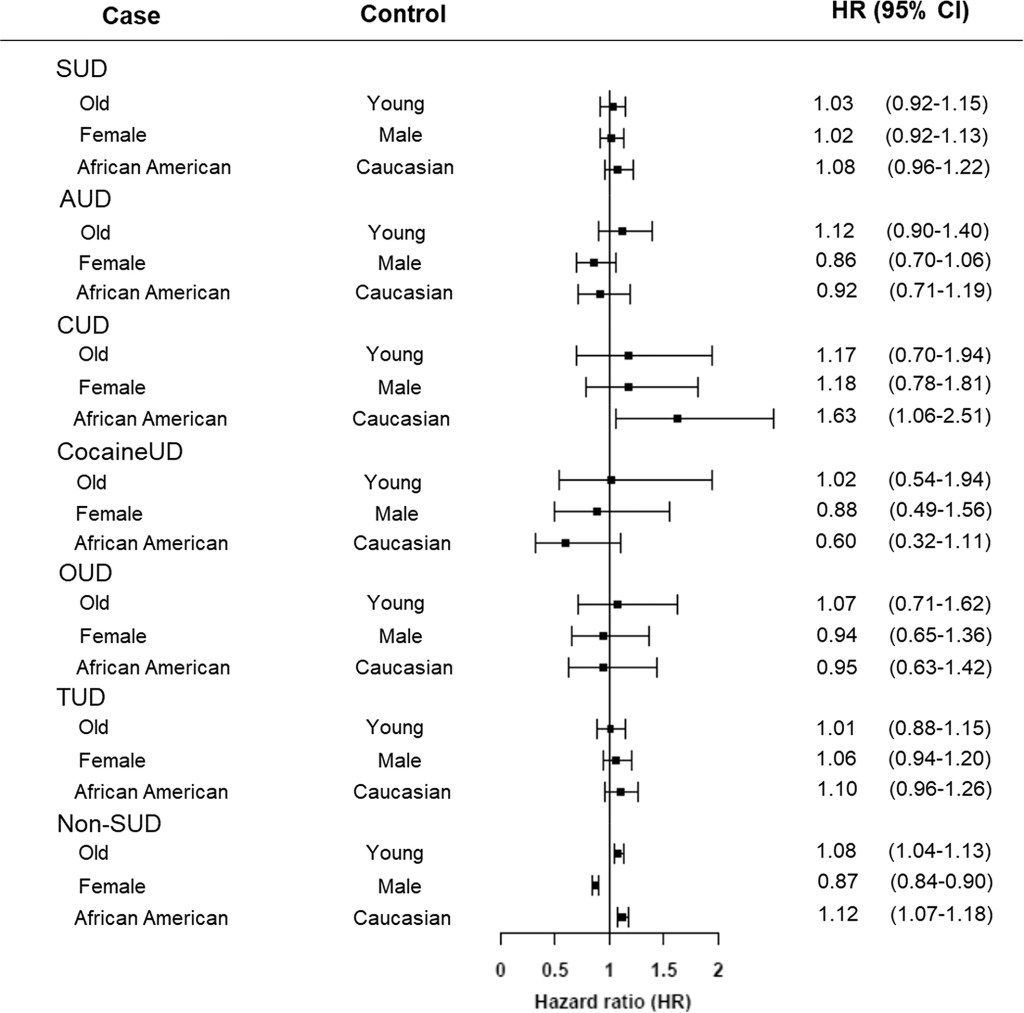
Adults with substance use disorders have an increased risk of breakthrough cases, according to a new study published this week in the journal World Psychiatry. Though the chances of a COVID-19 case after vaccination were very low in this group, these patients’ odds of a breakthrough case were about twice as high as the odds for adults without substance use disorders, researchers from the National Institutes of Health (NIH) found.
This study is the first I’ve seen to delineate breakthrough case risk in a specific, vulnerable population—besides studies demonstrating higher risk for older adults. As I wrote two weeks ago, a lack of specific data on breakthrough cases has contributed to confusion and debate surrounding who should be eligible for a booster shot in the U.S.
So, how did these NIH researchers determine the risk for people with substance abuse? They used anonymous, electronic health records from 63 healthcare organizations across the U.S., compiled in the TriNetX Analytics platform. The study included health records from about 30,000 patients with substance use disorders, compared with 550,000 patients without these disorders. From this large pool of anonymous data, the researchers were able to determine breakthrough case risk among different patient demographics, different substance use disorders, and more.
I got a chance to talk to Dr. Nora Volkow, director of the NIH’s National Institute on Drug Abuse and one of the study’s lead authors, about this methodology, as I covered the paper for DailyMail.com. I asked her if she expected to see similar studies examining breakthrough case risk for other health risks and occupations.
“Absolutely,” Dr. Volkow said. She told me she’s already seen other papers comparing the risk of a breakthrough with Delta compared to other variants, and that more research looking at specific patient groups may be ongoing. Still, using electronic health records has its drawbacks.
“We are basically basing [the analysis] on the electronic health records,” she said. “But it could be useful to complement this with studies that actually are genotyping, getting information about, what was the virus that is responsible?” In other words: health records from hospitals and clinics typically are not matched with genetic sequencing information, making it difficult to link specific variants with breakthrough case risk.
As for why patients struggling with substance abuse have a higher risk of breakthrough COVID-19: Dr. Volkow said this is largely due to socioeconomic factors, such as lack of access to healthcare, low income, and homelessness. Drugs and alcohol are also capable of weakening patients’ immune systems, though; marijuana in particular can hinder immune system regulation.
Last week, one of the reader questions I answered addressed Long COVID, the condition in which people have COVID-related symptoms for weeks or months after their initial coronavirus infection. One reader had asked about monitoring for Long COVID patients (also called long-haulers); I later received another question about the risks of Long COVID after vaccination.
These questions made me realize that I’ve devoted very little space to Long COVID in the COVID-19 Data Dispatch—even though I consider it one of the biggest COVID-19 data gaps in the U.S. Though it’s now been well over a year since the first Long COVID patients were infected, there is still so much we don’t know about the condition.
For example, we don’t know a very rudimentary number: how many people in the U.S. are struggling with Long COVID. We also don’t have a clear, detailed picture of Long COVID symptoms, or how these symptoms arise from a coronavirus infection, or how they impact the daily lives of Long COVID patients.
Why does this massive data gap exist? Long COVID studies are challenged by the lack of standardized patient data in the U.S., making it difficult to identify symptom patterns across large groups of people. We face a similar problem in tracking breakthrough cases, demographic information, and other COVID-19 trends.
Plus, thanks to limited COVID-19 testing in the U.S. throughout the pandemic (and restrictions on who could get tested, back in spring 2020), a lot of Long COVID patients never had a positive test result—making it difficult for them to get a formal diagnosis. And many of the Long COVID studies that have been conducted focus on patients who had a positive COVID-19 test or were hospitalized for the disease, thus narrowing much of our clinical data to a small subset of the actual Long COVID population.
As I noted last week, the National Institutes of Health (NIH) has set up a major research initiative to study Long COVID. This initiative, called RECOVER, is poised to become our best source for Long COVID data in the future. But it’s in early stages right now, beginning to distribute funding to different research groups and recruit Long COVID patients for study. It could be years before we get results.
All of that said, there are still a few things we know about Long COVID based on research thus far. Here’s a roundup of twelve key statistics.
Between 10% and 30% of coronavirus infections lead to Long COVID. This statistic comes from the NIH’s RECOVER Initiative website; it summarizes findings from past studies. Consider: 30% of the 44.2 million Americans with a documented COVID-19 case amounts to 13.3 million people with Long COVID. Even 10% of those 44.2 million would amount to 4.4 million people.
Some studies suggest that as many as one-third of COVID-19 patients may have persistent or returning symptoms. A recent study of electronic health records in the U.S. and U.K., run by scientists at the University of Oxford, suggests that the true share of COVID-19 patients who contract Long COVID is on the higher end of that 10%-30% estimate that the NIH provides. This new study found that 36% of COVID-19 patients (among a sample size of 270,000) had symptoms three and six months after their diagnosis.
Long COVID may manifest with over 100 different potential symptoms. There is a Long COVID paper that I personally come back to, whenever I want to see a clear picture of the many ways that this condition can impact patients. The paper, published in The Lancet in July, reports results from a survey of over 3,000 Long COVID patients conducted by the Patient-Led Research Collaborative. According to this survey, Long COVID patients may suffer from about 100 possible symptoms, including systemic, reproductive, cardiovascular, musculoskeletal, immunologic/autoimmune, head/eyes/ears/nose/throat, pulmonary, gastrointestinal, and dermatologic symptoms.
Long COVID symptoms may change over time. The Patient-Led Research Collaborative survey found that some patients may have changing symptoms, or relapses brought on by different activities. One very common Long COVID symptom is Post-Exertional Malaise, a condition in which patients experience a relapse after physical or mental exertion, even if that exertion is relatively minor.
Some Long COVID patients have been sick for over 18 months. The Patient-Led Research Collaborative survey covers symptoms over a course of seven months, but some Long COVID patients have been suffering for far longer. Some patients who initially contracted the coronavirus in spring 2020, during the first wave in the U.S., have now been sick for 18 months or more.
Many Long COVID patients are unable to work. According to the Patient-Led Research Collaborative survey, almost half of the Long COVID patients who responded (45%) “required a reduced work schedule, compared to pre-illness.” Another 22% were not working at the time of the survey because of Long COVID. Other studies have backed up the findings from this survey. At this point in the pandemic, some Long COVID patients are struggling to receive accommodations from their employers, even though the condition is recognized as a disability at the federal level.
Long COVID can occur at all age ranges, but is documented most in younger and middle-age adults. Among respondents to the Patient-Led Research Collaborative survey, about 24% were in their thirties, 31% in their forties, and 25% in their fifties—though patients ranged in ages from 18 to over 80. This survey and others have also found that Long COVID seems to be more common for women; this pattern aligns with other post-infectious conditions, like chronic fatigue syndrome and chronic Lyme disease.
Long COVID may lead to long-term neurological issues. This past summer at the Alzheimer’s Association International Conference, a few researchers presented findings on Long COVID and Alzheimer’s. Brain scans of COVID-19 patients, along with observations of patients’ prolonged symptoms, suggest that adults who suffer from Long COVID may have an increased risk of Alzheimer’s later in life. Severe COVID-19 patients in their sixties and seventies are already starting to see symptoms matching early-onset Alzheimer’s, one researcher told NPR.
Autoimmune response may be one cause for Long COVID symptoms. While scientists are still working to determine exactly how a coronavirus infection may lead to numerous symptoms, research thus far suggests that overreaction of the immune system could be a major player. Some clinicians who work with Long COVID patients have developed treatments based on dysautonomia, medical conditions caused by immune and autonomic nervous system issues.
About 5,200 children in the U.S. have been diagnosed with MIS-C, and 46 have died. MIS-C stands for Multisystem Inflammatory Syndrome in Children. The condition follows a COVID-19 infection in rare cases, leading to inflammation of different parts of the body. While this condition is not directly comparable to Long COVID, scientists think it may have similar causes. The condition has disproportionately impacted children of color in the U.S.: out of 5,200 cases, 61% are Black or Hispanic/Latino.
The risk of Long COVID is dramatically lower after a breakthrough infection, even if you contract the coronavirus. A recent study published in The Lancet found that vaccinated patients who later had a breakthrough COVID-19 case were about half as likely to report symptoms after four weeks, compared to unvaccinated patients who had a non-breakthrough COVID-19 case. Plus, vaccinated people are already far less likely to contract the coronavirus in the first place, because vaccination reduces risk of infection. Commenting on the study, NIH Director Dr. Francis Collins called it “encouraging news,” though he cautioned that more research is needed on this topic.
Vaccination may help alleviate COVID-19 symptoms for Long COVID patients. In addition to reducing one’s risk of developing Long COVID, vaccination can alleviate symptoms for Long COVID patients. A recent preprint, posted online at the end of September, found that Long COVID patients who got vaccinated were about twice as likely to completely recover, compared to unvaccinated patients. “Overall, this study adds to growing evidence that vaccines can improve symptoms and lessen the disease impact in Long COVID,” wrote Long COVID researcher Dr. Akiko Iwasaki, sharing the study on Twitter.
To me, these Long COVID statistics—along with everything we still don’t know about the condition—provide a strong argument for vaccination. Long COVID can impact people who were young and healthy before they were infected, completely messing up their lives for months or even years. It surprises me that public health and political leaders don’t discuss this condition more when they tell people to get vaccinated.
As for continued research: the NIH’s RECOVER Initiative has received over $1 billion in funding from Congress, and it’s just getting started on setting up studies. If you’re interested in learning more about the research—or signing up to participate in a RECOVER study—you can sign up for email alerts on the NIH website.
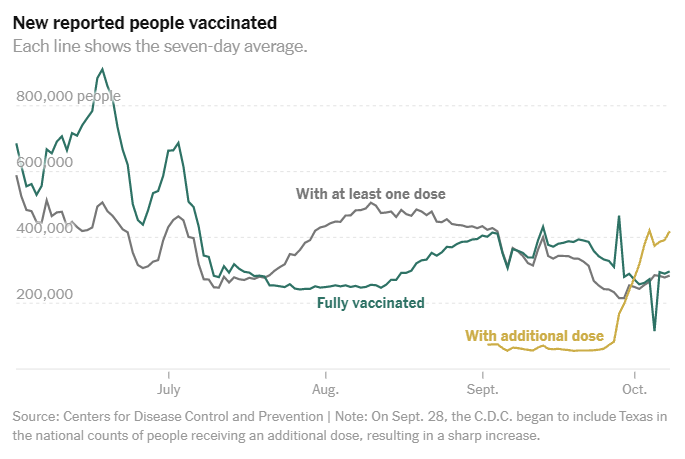
The U.S. is now administering about one million vaccine doses a day, largely thanks to eligible Americans receiving their booster shots. Chart via the New York Times.
In the past week (October 2 through 8), the U.S. reported about 670,000 new cases, according to the CDC. This amounts to:
An average of 95,000 new cases each day
204 total new cases for every 100,000 Americans
12%fewer new cases than last week (September 25-October 1)
Last week, America also saw:
52,000 new COVID-19 patients admitted to hospitals (16 for every 100,000 people)
10,000 new COVID-19 deaths (3.1 for every 100,000 people)
100% of new cases are Delta-caused (as of October 2)
An average of one million vaccinations per day (including booster shots; per Bloomberg)
At the national level, COVID-19 cases continue to go down. The U.S. is now seeing fewer than 100,000 new cases a day, and about 62,000 Americans are currently hospitalized with COVID-19—a 14% drop from last week.
It may feel like the Delta surge is now “over,” but case rates are still incredibly high across the country compared to what we saw earlier this summer. California and Connecticut continue to be the only two states with “substantial” transmission, according to the CDC. Every other state has “high” transmission, meaning over 100 new cases for every 100,000 people in the past week.
Alaska remains the country’s biggest hotspot, with over 800 new cases for every 100,000 people in the past week, per the latest Community Profile Report. Case numbers have dropped a bit since last week—when Alaska hit the highest per-capita COVID-19 case rate of any state during the entire pandemic thus far—but the state’s hospitals are still incredibly overwhelmed. Doctors are rationing care, unable to send most patients on hours-long trips to Washington state.
Other Midwestern states continue to face Delta surges, including Montana, North Dakota, Wyoming, West Virginia, and Idaho. All five states have COVID-19 case rates over 500 new cases per 100,000 people in the past week.
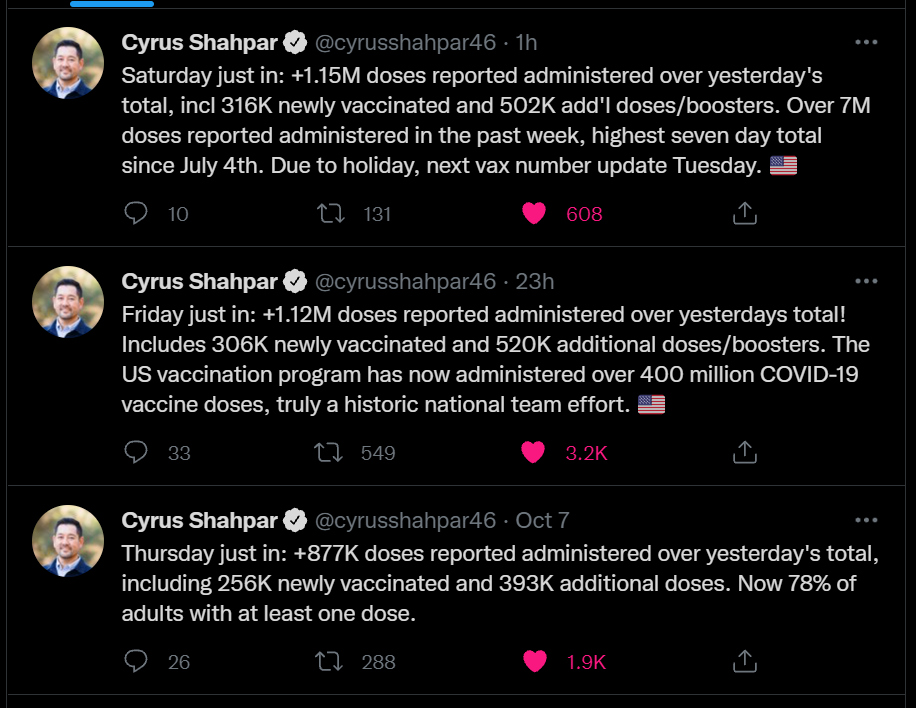
Vaccination numbers are going up nationwide, with over one million doses administered each day in the past week. But there’s a key caveat here: many of these doses are booster shots. On Saturday, for example, the CDC reported 1.15 million new doses—including over 500,000 booster shots. The number of people receiving their first doses is the lowest it’s been in months.
Saturday just in: +1.15M doses reported administered over yesterday's total, incl 316K newly vaccinated and 502K add'l doses/boosters. Over 7M doses reported administered in the past week, highest seven day total since July 4th. Due to holiday, next vax number update Tuesday. 🇺🇸
— Dr. Cyrus Shahpar Archived (@cyrusshahpar46) October 9, 2021
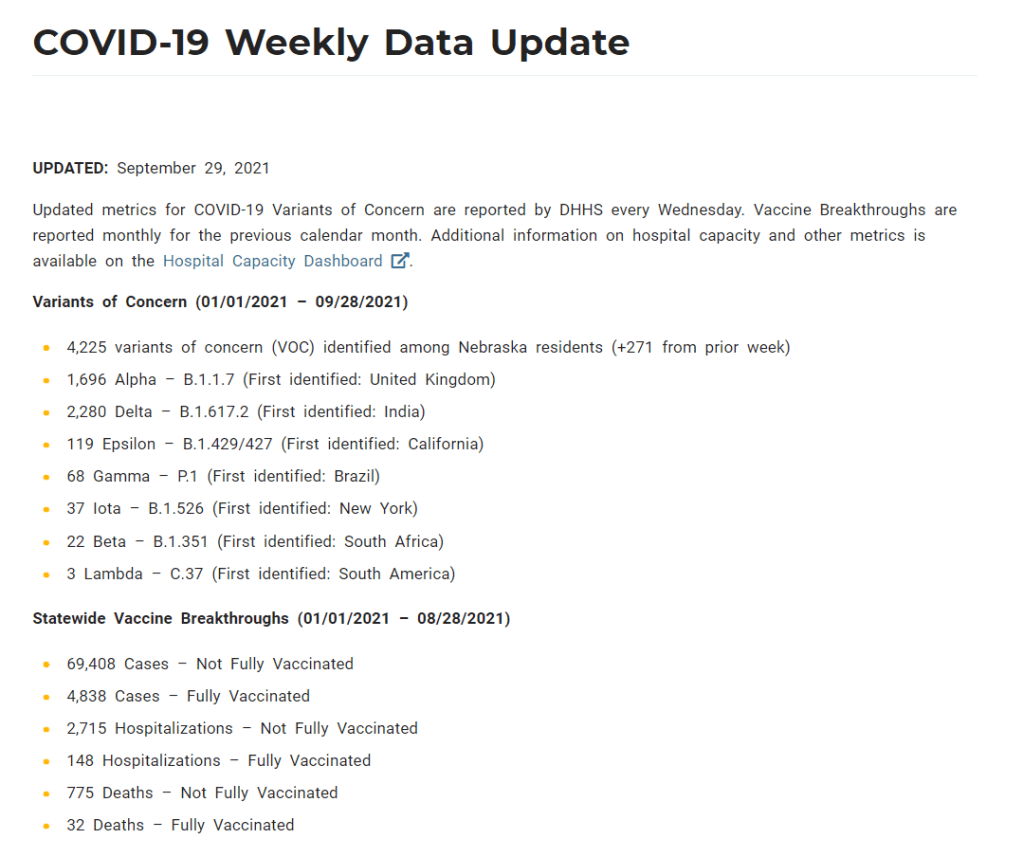
On June 30, Nebraska’s public health department discontinued its COVID-19 dashboard. The dashboard had provided daily updates for cases, deaths, vaccinations, and other metrics. After June 30, it was replaced with a stripped-down “Weekly Data Update,” providing a few major metrics, such as the cases reported and vaccine doses administered in the past week. This update is posted every Wednesday.
When I checked on Nebraska yesterday for an update of my vaccine annotations page, I was shocked to find that the state’s Weekly Update has been pared down even further. It now includes just two metrics: variants of concern and vaccine breakthroughs. Nebraska’s health department is reporting: 1) the total cases identified as variants of concern in the state, and 2) total cases, hospitalizations, and deaths split by “fully vaccinated” and “not fully vaccinated.”
This is literally the entire report. Screenshot taken on October 3.
Compared to the detailed dashboard this state used to produce, this weekly update is incredibly sparse. It reminds me of a state COVID-19 data page from the early days of the pandemic—like, March 2020. If any local journalists from Nebraska are reading: I am so sorry.