
It’s now been almost two months since the CDC approved third vaccine doses for patients with weakened immune systems—and over two weeks since the agency approved third Pfizer doses for patients with increased breakthrough case risk. Since August 13, the CDC’s dashboard says, about 7.3 million Americans have received a third dose.
As I mentioned in today’s National Numbers post, these booster shots are obfuscating the country’s vaccination trends. Over one million people have been vaccinated every day for the past week, but roughly half of those people were getting their booster shots.
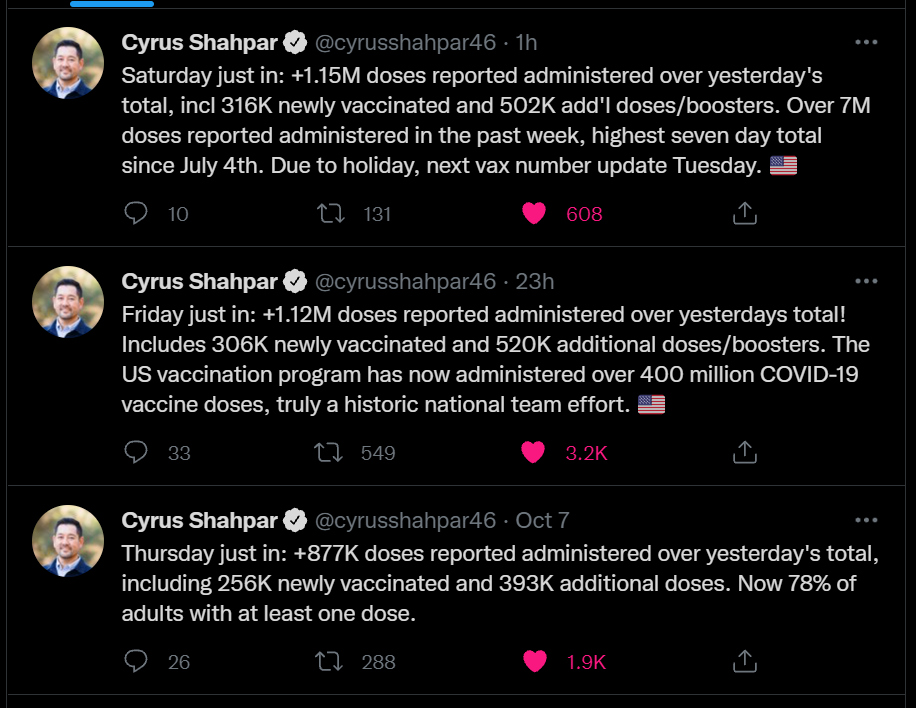
One might think I am sourcing that daily booster shot number from the CDC dashboard, but no: it comes, as many key COVID-19 data updates do these days, from the Twitter account of White House COVID-19 Data Director Cyrus Shahpar. The CDC has yet to add any booster shot data to its dashboard beyond a total count of doses administered.
Much as I appreciate Shahpar’s daily updates, I would like to see the agency add those daily booster shot counts to its dashboard. And why stop there? The CDC should also provide information on the demographics of those getting booster shots, such as age and race/ethnicity, as well as geographic trends.
Notably, the New York Times has added a booster shot trendline to its vaccination dashboard; see the chart titled “New reported people vaccinated.” As I noted last week, 15 states have added booster shots to their vaccine dashboards and reports as well, including three states that are reporting demographic breakdowns. The CDC is behind the data reporting curve, as usual.

Leave a comment