In this post, I hypothesized that the gap was likely a result of a shift for NWSS, as the CDC has switched from a contract with testing company LuminUltra to a contract with Biobot. In both cases, the outside company had been hired to conduct wastewater sampling and analysis for sites that don’t have capacity to do this themselves; as NWSS transitioned between testing providers, some sites were left without recent data.
This week, I’m excited to share an update on the situation, courtesy of Becca Malizia, Biobot’s science communication manager, who reached out after seeing last week’s post. Below, you’ll find more details on the recent data gaps and Biobot’s new relationship with the CDC.
Malizia confirmed that the transition between LuminUltra and Biobot has led to delays in wastewater data availability for some sites in the NWSS network. She pointed me to a footnote on the CDC dashboard, labeled “May 2022 Coverage Limitations”:
Beginning April 15, 2022, approximately 150 wastewater sites in 29 states began transitioning to a new wastewater testing provider. During this transition, these sites will not have recent data displayed and will be colored gray on the map. It will take several weeks for enough data to be collected to calculate the metrics displayed on this page. Results for these sites are expected to be available again between mid-May and June 2022.
Now, if the CDC was going for full transparency and ease of dashboard interpretation here, the agency should have placed this important note somewhere more obvious to the average user—not buried at the bottom of the page. But I’m glad to see this public information, including the estimate of when results for the transitioning sites will be available.
Biobot also acknowledged the data gap in a Tweet on May 19, explaining that the company has experienced issues in distributing testing kits to participating sites:
📣Some locations may be noticing data delays due to a severe distribution issue we're having w/ our kitting vendor. We're setting up an emergency in-house kitting operation to get kits shipped ASAP. For further questions (or interest in helping) please email us: support@biobot.io
— Biobot Analytics (@BiobotAnalytics) May 19, 2022
Further contributing to data delays, the sewershed sites for which Biobot is now in charge of sampling require a “minimum number of samples” before key metrics on the CDC NWSS dashboard can be calculated, Malizia said. The calculations for these metrics change from one lab to another, so Biobot needs to use data from its protocols rather than data from the prior LuminUltra contract.
“Sites in the process of switching over from the previous contract may have some lag until there is enough data to do the calculations for the CDC metrics,” Malizia wrote. She also pointed to several other reasons why a sewershed site might collect wastewater data, but not have its data appear on the CDC dashboard, such as: a sewershed serving under 3,000 people, a sewershed serving a specific institution (like a college campus), and a sewershed where local leaders have elected not to send data to the CDC.
Biobot has already onboarded more than 200 wastewater treatment plants, Malizia said; this includes sites that were previously included in the NWSS contract with LuminUltra, though a full list of those sites is not publicly available. By mid-July, Biobot aims to have 500 sites participating in its CDC program. The company works with state and local health departments to select wastewater sampling sites and coordinate with treatment plants.
Now, it’s important to note that, outside of its CDC NWSS contract, Biobot coordinates wastewater testing and analysis for hundreds of sewershed sites through a program called the Biobot Network. This program is a public service offering from Biobot: the company does testing and analysis at no cost to sewersheds. But Biobot also does not send individual, sewershed-level data back to the participants. “Rather, the data is aggregated at the county level on our public dashboard (biobot.io/data) for the benefit of policymakers and the general public,” Malizia explained.
(The free Biobot Network includes two sampling sites in Hillsborough, Florida which used to be paid Biobot customers in 2021, Malizia said, in comments responding to the Tampa Bay Times article I quoted last week. The final reports those sites received when they were paying customers were in August and October of last year. “Individual wastewater treatment plants can choose whether or not to share these reports with local government agencies,” Malizia said.)
Before it became a CDC contractor, Biobot was not able to submit wastewater data to the agency. Only state government agencies have access to the CDC NWSS platform used for data reporting, Malizia said; the CDC has made an exception for Biobot under the new contract. To me, this helps explain why there’s not a lot of overlap between Biobot Network sites and CDC NWSS sites, as well as why some other wastewater sampling (done by universities, research institutions, etc.) does not appear on the CDC dashboard.
But, now that Biobot is a CDC contractor, will the company provide Biobot Network data to the agency? I asked Malizia this question, to which she responded:
The Biobot Network will remain separate from the NWSS, however sites enrolled for the CDC NWSS Program will also be given the option to opt into the Biobot dashboard.
In summary: Biobot is working hard to restore data from sites already in the CDC NWSS network and expand that network to more sites that don’t have capacity for wastewater sampling on their own. However, thanks to a combination of CDC bureaucracy and complex public and private data systems, it seems unlikely that we will get a singular dashboard including all wastewater testing sites in the country anytime soon.
Also, Biobot’s current contract is only for nine months. Are we going to see another round of data gaps next winter, if the CDC decides to switch wastewater testing companies again?
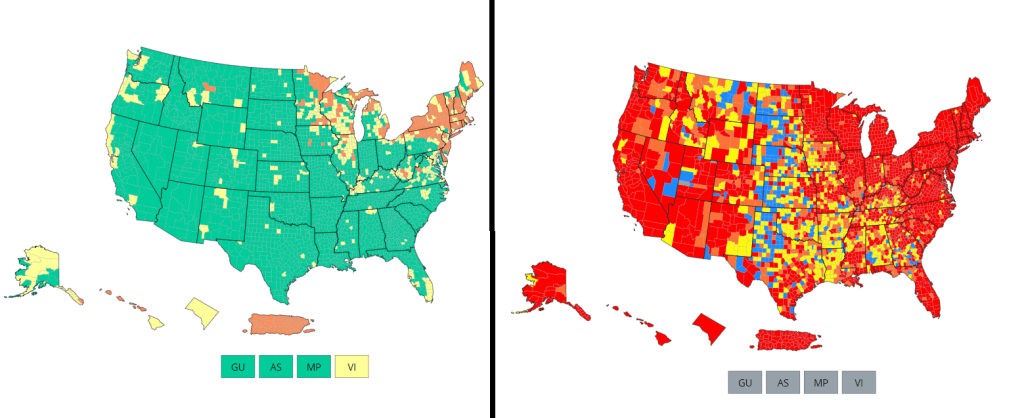
Comparing the CDC’s new Community Levels (left) and old Community Transmission Levels (right), as of May 22. Red indicates higher transmission.
There’s no sugarcoating it: we are in an extremely confusing and frustrating phase of the pandemic. We see the rising (yet undercounted) case numbers, we hear from friends and family members who have recently tested positive. And yet the CDC’s official COVID-19 guidance is still based on a mostly-green map, while local leaders refuse to reinstate mask mandates or other safety measures.
I wrote about this tension for the New York City news site Gothamist last week, in a story about COVID-19 outbreaks in city public schools. As official case counts approach the levels of the winter Omicron surge and the city officially goes into “high COVID-19 alert level,” no action has been taken to slow the spread beyond distributing more rapid at-home tests to students.
Moreover, students, parents, and teachers have limited (and often conflicting) information about COVID-19 cases in their schools. The issues include:
While the NYC Department of Education does allow parents to report positive results from at-home tests, reporting is not required and can take several days, potentially leading to undercounts and delays.
Data sources from the city and the state often do not match due to reporting differences, and both may lag behind anecdotal reports from students and teachers.
Other NYC data sources are also unreliable, since the city health department does not count at-home tests at all and novel sources such as wastewater surveillance aren’t readily available.
In this phase of the pandemic, much of the official guidance from the federal government and aligned experts centers around individual responsibility. There may not be a mask mandate, but you can wear a mask if you feel it’s necessary. Large events may be taking place, but you can take a rapid test before and afterwards if you want. And so on.
Of course, I’m not saying that you shouldn’t wear a mask or use testing. But the problem with this narrative is that, as our data sources become less reliable, it becomes harder and harder to figure out when or how one should take these individual-level actions.
As Sarah Allen, a NYC teacher and parent whom I interviewed for my Gothamist story, put it: “You can’t say, ‘It’s up to you as an individual,’ when the level of risk is being withheld from you.”
Still, even as our official data sources become harder to use, there are still ways to keep track of the COVID-19 risk in your community—you just may need to look at more sources and acknowledge more uncertainty in the numbers. While I was working on the Gothamist story, I received a question from a reader along similar lines; she asked what datasets I would recommend looking at right now, particularly when seeking to protect seniors and other vulnerable populations.
Here’s what I responded (edited lightly for publication):
Case rates are still useful, if we acknowledge that they are undercounts. Jeffrey Shaman, an infectious disease expert at Columbia University whom I talked to for the Gothamist story, put it this way: our current datasets “will tell you the trends of what’s happening, but it won’t necessarily tell you the magnitude.” In other words, if case counts are going up and you’re also hearing about a lot of friends testing positive on rapid tests, that is still a good indication that more transmission is happening in your area. But you need to consider that the actual transmission is several times higher than the official case counts, due to more rapid testing and less PCR testing.
Hospitalization rates are useful, particularly new hospital admissions. As you may have noticed, COVID-19 Data Dispatch National Numbers posts in the last few months have used new hospital admissions at the same level as cases to discuss national COVID-19 trends. Some modelers I talk to really like this metric, because it’s more reliable than cases and has less of a lag than other kinds of hospitalization metrics (such as total patients in the hospital or bed capacity), since it is driven by new people with COVID-19 coming into the hospital for treatment. The big caveat with hospitalization numbers is that they mainly tell you about healthcare system capacity, eg. if you get severely ill, will there be a bed in the hospital for you? It’s harder to extrapolate from hospitalization numbers to other impacts of COVID-19, like Long COVID.
The CDC’s old transmission level guidance is still actually pretty helpful for guiding health policies, especially for vulnerable populations. In this guidance, the “high” level means that a county is reporting over 100 new COVID-19 cases for every 100,000 people, over the course of a week. This high level may also be associated with high test positivity rates, a sign of high transmission and/or undertesting. So, if your county is reporting high transmission under this old guidance, it’s a pretty decent signal that there is a lot of COVID-19 circulating there — and reaching this level is actually even more concerning now than it would’ve been a few months ago, since so many rapid tests are going unreported. (The CDC itself actually recommends that healthcare facilities use this guidance, in a note at the top of its COVID-19 dashboard.)
Wastewater surveillance, if it’s available in your area. That “if” is a pretty big caveat; and even in some places where wastewater surveillance has been available, data have been scarce recently (see: later in this issue). But if you do have access to COVID-19 prevalence data from sewersheds in your community, this information of how coronavirus spread is changing in your area: is transmission increasing; or if you’re in a wave, has it started to decrease again yet? Beyond the CDC NWSS and Biobot dashboards, you can use the COVIDPoops19 dashboard to look for wastewater surveillance near you.
The COVID Cast dashboard, from Carnegie Mellon University’s Delphi Group, is another helpful source recommended to me recently by a modeling expert. The Delphi group does modeling work and provides data based on surveys of the U.S. population, answering questions like, “How many people are wearing masks?” Their dashboard also incorporates other unique data points you won’t find elsewhere, including antigen test positivity from one major test provider (Quidel), trends in COVID-related doctors visits, and analysis of Google search trends for COVID-like symptoms.
As always, if you have further questions, please reach out.
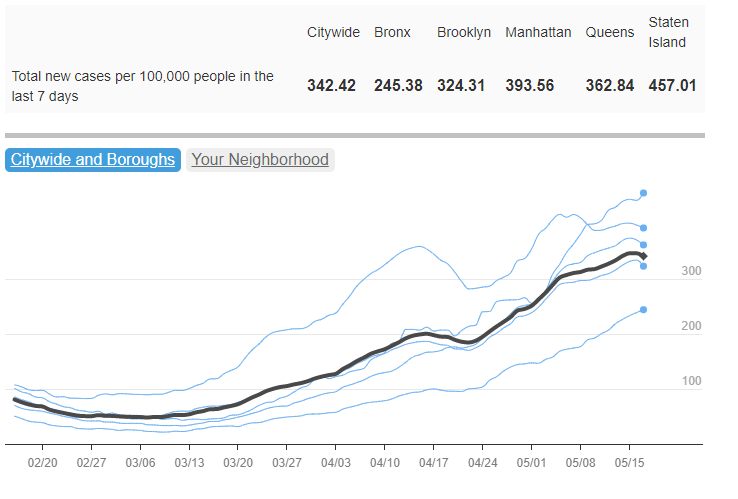
After appearing to peak in mid-April, COVID-19 case rates in New York City began going up again as BA.2.12.1 took over. Chart from NYC Health.
In the past week (May 14 through 20), the U.S. reported about 710,000 new COVID-19 cases, according to the CDC. This amounts to:
An average of 101,000 new cases each day
216 total new cases for every 100,000 Americans
19% more new cases than last week (May 7-13)
In the past week, the U.S. also reported about 23,000 new COVID-19 patients admitted to hospitals. This amounts to:
An average of 3,300 new admissions each day
6.9 total admissions for every 100,000 Americans
24% more new admissions than last week
Additionally, the U.S. reported:
2,000 new COVID-19 deaths (0.6 for every 100,000 people)
98% of new cases are Omicron BA.2-caused; 48% BA.2.12.1-caused (as of May 14)
An average of 140,000 vaccinations per day (per Bloomberg)
The Omicron BA.2 surge continues in the U.S., with a 19% increase in officially-reported COVID-19 cases in the past week to over 100,000 new cases a day. Of course, the official case numbers severely underestimate true infections, as PCR testing sites close and more people use rapid tests; actual case counts may be five or more times higher.
New hospital admissions are also increasing: about 23,000 COVID-19 patients were admitted for care nationwide last week, up from 11,000 one month ago. While millions of Americans have some protection against severe disease from vaccination and/or prior Omicron infections, many are still susceptible. Hospitals are beginning to fill up again in almost every state, and as Ed Yong points out, the numbers don’t capture continued burnout among healthcare workers.
🚨I wrote about how the health-care system is faring. In many places, things are better than the winter's surge. But that's scant comfort. The system is now locked in a chronic, cumulative crisis that exerts a toll regardless of what COVID is doing. 1/ https://t.co/zZItleYRg5
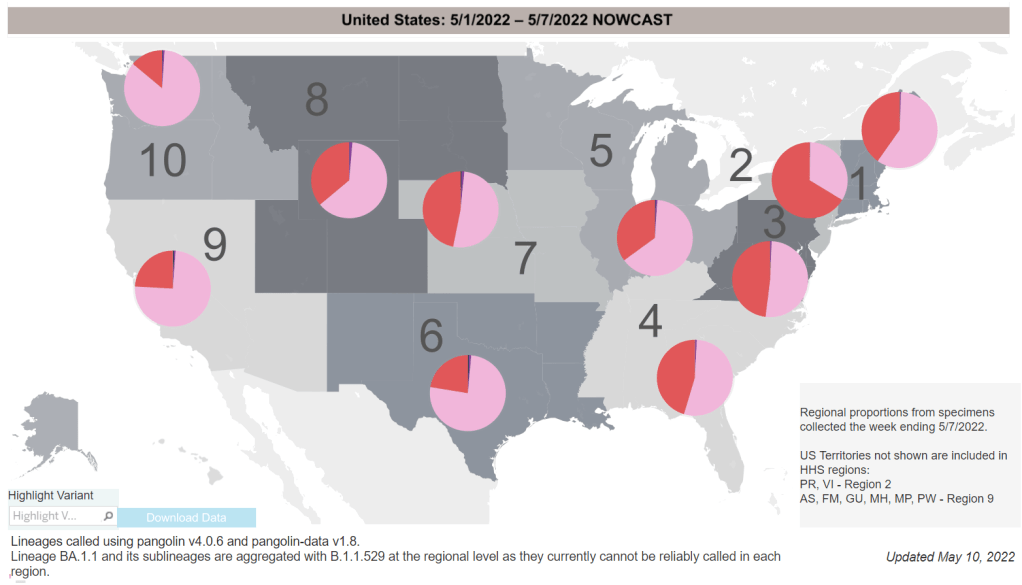
BA.2.12.1, the most transmissible version of Omicron BA.2 now spreading in the U.S., accounted for almost half of new cases in the week ending May 14, according to CDC estimates. Northeast states remain hotspots: BA.2.12.1 caused about three in four new cases in New York and New Jersey last week.
One thing I’ve been wondering, in recent weeks, is when we might see cases peak in the Northeast. In New York City, where I live, case trends seemed to turn downward in mid-April; but then after about a week, the numbers went up again — perhaps a consequence of BA.2.12.1 taking over from BA.2.
COVID-19 trends from wastewater surveillance for the Northeast look similar to the case trends in NYC: a slow increase through March and April, followed by a potential plateau or further increases in May.
And other regions are catching up, according to Biobot’s tracker: states in the Midwest and South continue to see their coronavirus levels increase as the Northeast stagnates. Official case data from the latest Community Profile Report suggest that states such as Nebraska, Montana, Missouri, Kansas, and Kentucky reported the sharpest increases over the last week.
One piece of good news: new COVID-19 vaccinations rose slightly over the last week, going above 100,000 new shots administered daily for the first time in several months. Second booster shots in older adults and those with severe medical conditions are likely driving this increase, though, rather than shots for the previously unvaccinated.
As local leaders like NYC mayor Eric Adams refuse to institute new mask mandates and the country overall seems apathetic to this COVID-19 surge, it’s unclear how long we’ll be dealing with these Omciron subvariants — or how much we’ll invite the virus to keep mutating.
The US’s second Omicron surge is fully here.
At the end of Jan / beginning of Feb, my hypothesis was that if there wasnt a clear national surge by the end of March we would be basically surge-free until the fall.
COVID-19 deaths that could’ve been prevented with vaccines: A new analysis from the Brown University School of Public Health suggests that almost 319,000 U.S. COVID-19 deaths could have been avoided if all adults had gotten vaccinated against the disease. This number differs significantly by state; there were 29,000 preventable COVID-19 deaths in Florida, compared to under 300 in Vermont. For more context on the analysis, see this article in NPR.
CDC dashboard in Spanish: The CDC has translated its COVID-19 Data Tracker into Español. At a glance, the Spanish version appears to include all the major aspects of the tracker: cases, deaths, vaccinations, community transmission, variant prevalence, wastewater, etc. Of course, it would have been great if the agency could’ve devoted resources to this translation effort well below spring 2022, when the number of people looking to the agency for COVID-19 guidance is pretty low.
CDC may lose access to COVID-19 data:According to reporting from POLITICO, the CDC and other national health agencies may no longer have the authority to require COVID-19 data reporting from states and individual health institutions if the Biden administration allows the country’s federal pandemic health emergency to end this summer. Such a change in authority could lead to the CDC (and numerous other researchers across the country) losing standardized datasets for COVID-19 hospitalizations, transmission in nursing homes, PCR testing, and other key metrics. Considering that hospitalizations are considered the most reliable metric right now, this could be a major blow.
COVID-19 testing declines globally: Speaking of losing reliable data: this report from the Associated Press caught my eye. The story, by Laura Ungar, explains that the U.S. is not the only country to see a major decrease in reported COVID-19 tests (a.k.a. Lab-based PCR, not at-home rapid tests) in recent months. “Experts say testing has dropped by 70 to 90% worldwide from the first to the second quarter of this year,” Ungar writes, “the opposite of what they say should be happening with new omicron variants on the rise in places such as the United States and South Africa.”
More promising data on Moderna kids’ vaccine: While Pfizer’s vaccine for children under five remains in development, Moderna continues to release data suggesting that this company is further ahead in providing protection for the youngest age group. This week, Moderna announced a half-dose of its vaccine provides a “strong immune response” in children ages six to 11; the announcement was backed up by a scientific study published in the New England Journal of Medicine (so, more rigorous than your typical press release). The FDA is currently evaluating a version of Moderna’s vaccine for children between ages six months and six years.
Update, May 22, 2022: After this post was published, Becca Malizia, Biobot’s science communication manager, reached out to provide some clarification on the current state of wastewater data in the U.S., as well as on Biobot’s relationship with the CDC. See this follow-up post for more details.
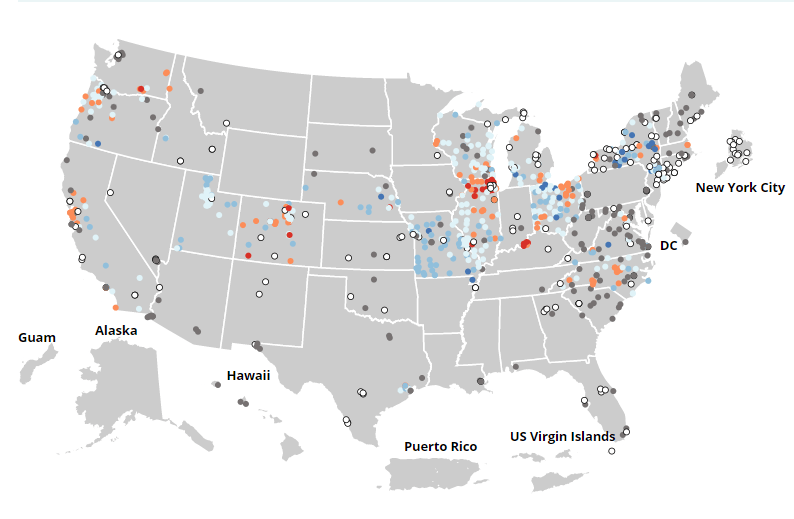
As I mentioned last week: something strange is going on with the CDC’s National Wastewater Surveillance System (NWSS) data.
Hundreds of sites on the CDC NWSS dashboard have been labeled as showing “no recent data” for a couple of weeks. As a New Yorker, I pay special attention to the New York City sites; twelve sites in the city were actually removed from the dashboard, then re-added as “new sites,” even though researchers in the city have been testing wastewater for the coronavirus since 2020.
I have yet to do dedicated reporting on this topic, but I wanted to share a bit of information on why I think this is happening. (Please take this with a grain of salt!)
Last winter, as part of CDC NWSS’ efforts to enable more states and counties across the country to test their wastewater for the coronavirus, the agency contracted with LuminUltra, a biological testing company that has become one of the leading wastewater testers during the pandemic. LuminUltra, in conjunction with NWSS and the Water Environment Federation, was responsible for testing and analyzing wastewater for state and local health departments that wanted to set up this monitoring, but didn’t have internal capacity to do so themselves.
LuminUltra’s contract expired last month. In its place, CDC NWSS has set up a new contract with Biobot, another leading wastewater contractor, the company announced this week. Biobot will be responsible for collecting and analyzing wastewater data at 500 sites across the country; it’s unclear from the press release how many of these sites were also part of the old LuminUltra contract, but I’m guessing there’s a lot of overlap.
Here’s the problem, though: LuminUltra stopped testing wastewater at hundreds of NWSS sites last month, but Biobot hasn’t yet resumed testing, data analysis, reporting to the CDC, etc. at all of these locations. As a result, the CDC NWSS dashboard currently includes a number of sites labeled as “new” or “no recent data,” making it difficult to actually use this federal source for evaluating wastewater trends.
Considering that we’re facing a surge and U.S. case data are less reliable than ever, this is not exactly a great time to have a gap in our wastewater data! (Also, I think that something else may be going on with the New York City sites, but that’s a topic for another post.)
As I said above, I haven’t done much reporting on this myself yet, but I wanted to share a relevant section from a recent Tampa Bay Times investigation about wastewater surveillance in Florida:
One of the largest players in the private testing market is Biobot Analytics, an MIT start-up that wants to market the technology.
Last year the company raised $20 million. It already has contracts with more than 700 municipalities in all 50 states, according to the Boston Globe, including Hillsborough County. But Biobot does not report that data to the CDC. Instead the company shares the data on its website, using its methodology.
Biobot, which collects data from six Florida counties, said it’s up to local governments to share COVID-19 data with the CDC.
The company started collecting Hillsborough’s data in June 2021. A county spokesperson said they haven’t received any reports from Biobot.
The amount of coronavirus detected in Hillsborough’s wastewater has doubled in the past month, according to Biobot’s website. It’s an estimate based on the county’s Northwest Regional Water Reclamation Facility and the city of Tampa’s Howard F. Curren facility.
It’s unclear if Biobot’s data-sharing policy will affect the nation’s wastewater surveillance program. The company took over the federal program on April 15, when it was awarded a $10.2 million contract to oversee the next year of testing.
That contract covers 500 utility providers across the country, according to the CDC. But Biobot and the CDC say the company won’t share COVID-19 data from the 700 utilities not covered by the contract.
I’m elevating this because, first of all, everyone should read the Tampa Bay Times piece—it is excellent local reporting on this issue. And second of all: does this mean that, even as Biobot takes over sampling and analysis for sites in the CDC NWSS network, the Biobot and CDC data systems will not be fully integrated?
This seems like a major challenge for a data network that is already quite fragmented, and I would love to see more transparency from the CDC on the whole situation. If anyone else is reporting on this or has additional information, please reach out!
While the U.S. federal government has, so far, failed to produce meaningful research on Long COVID, other organizations are working to fill this gap. One such organization is Solve M.E., an advocacy and research initiative focused on myalgic encephalomyelitis (ME), Long COVID, and other related post-viral illnesses.
A friend who works on Solve M.E.’s You + ME Registry has asked me to share this research opportunity, on behalf of her organization. This program is providing funding for scientists to organize smaller-scale studies on Long COVID and ME, potentially leading to more substantial grants for larger studies. Solve M.E. hopes to invite new researchers who haven’t previously focused on post-viral illnesses into this space.
Here’s the full info:
Solve M.E. is accepting applications to study ME/CFS and Long COVID through May 23, 2022.
Through the Ramsay Program, Solve M.E. invests in research studies in ME/CFS or Long COVID with a particular emphasis on engaging young investigators and researchers new to the field. This year, we are accepting applications for projects that aim to explore the mechanisms at play in people who go on to develop Long COVID. Collaborative proposals (involving two or more research groups) are encouraged.
Ramsay 2022 marks the sixth cycle of the program, and we are excited to continue offering our rich longitudinal data set in the You + ME Registry.
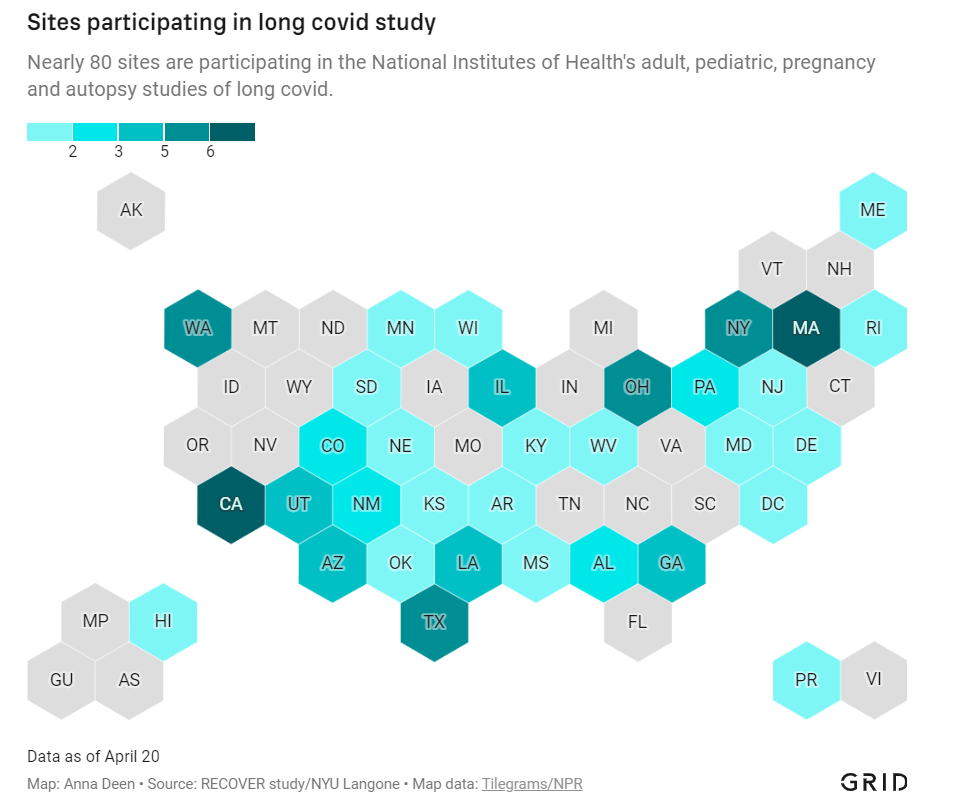
In December 2020, Congress provided the National Institutes of Health (NIH) with over $1 billion to study Long COVID. A couple of months later, the agency announced it would use this funding for an initiative called RECOVER: a large clinical trial aiming to enroll 40,000 patients, designed to answer long-standing questions about Long COVID and, eventually, identify potential treatments.
At the time, Long COVID patients and researchers were thrilled to see this massive investment. Long COVID patients may suffer from hundreds of possible symptoms, many of them debilitating; reports estimate that millions of people are out of work as a result of the condition. To anyone who has experienced Long COVID or talked to patients, as I have in my reporting, it’s clear that we need treatment options, and we need them yesterday.
But that promising NIH study is floundering: it’s moving incredibly slowly (with treatment trials potentially years off); it’s enrolled a tiny fraction of the 40,000 patients originally planned; it’s failing to meet the needs of patients from the communities most vulnerable to COVID-19; and it has been critiqued by patient advocates on concerns of trial setup, transparency, engagement, inclusion of other post-viral illnesses, and more.
I explored the concerns around RECOVER for a story in Grid, published last Monday. My piece highlights critiques from patient advocates and Long COVID researchers outside of RECOVER, while also discussing some of the broader problems that make it difficult for an initiative like this to succeed in the first place.
in December 2020, Congress gave the NIH $1.15 billion to study #LongCovid.
over a year later, the agency's flagship study is moving slowly as patient advocates worry that it will fail to answer key questions.
In the COVID-19 Data Dispatch today, I’d like to dig deeper into those broader problems and share some material from my reporting for the Grid story that didn’t make it into the final piece. Here are five reasons why the U.S. is not set up for success when it comes to Long COVID research, based on my interviews and research for the piece.
The NIH is designed for stepwise research, not “disruptive innovation.”
One of my favorite quotes in the story comes from David Putrino, who directs a lab at Mount Sinai focused on health innovations and was one of the first scientists in the U.S. to begin focusing on Long COVID. Putrino described how the NIH’s usual mode of operation does not work when it comes to novel conditions like Long COVID:
“What the NIH does very well, better than most national research organizations around the world, is supporting research that slowly develops small innovations in scientific knowledge,” Putrino said. The agency normally supports series of stepwise trials, climbing from one tiny aspect of research into a condition or treatment to the next.
This method is good for “long-term innovations that take 20 years,” Putrino said, but not for “disruptive innovation.” Treatments for long covid fall into the latter category: higher-risk, higher-reward science that may be viewed as a waste of government funding if it doesn’t pay off.
The same day as my Grid story was published, last Monday, STAT News published a story by Lev Facher discussing an oversight board at the NIH that was supposed to improve efficiency at the agency… and has not met for seven years. While this story doesn’t discuss Long COVID specifically, it provides some pretty clear context for why a study like RECOVER—which is different from anything the agency has done before—may be hard to get off the ground.
Here’s the final quote in Facher’s story, from Robert Cook-Deegan, founding director of the Duke Center for Genome Ethics, Law and Policy:
“About every 10 years, the National Academies [of Sciences, Engineering, and Medicine] are asked to review NIH, and they make recommendations, most of which are ignored,” he said. The agency’s “large, inertial, and ponderous bureaucracy,” he added, is “not terribly open to criticism as a whole.”
Clinical trials are difficult and time-consuming to set up, especially when they involve new drugs.
My story also discusses the red tape that U.S. researchers face when they attempt to test potential treatments on human subjects. For such a clinical trial, researchers need to get approval from an Institutional Review Board (or IRB), an oversight board that ensures a study’s design protects the rights and welfare of people who participate in the trial.
In the U.S., this approval can take months, and may have extra steps for government-funded research. Researchers in other countries often have much shorter processes, Lauren Stiles, president of the research and advocacy organization Dysautonomia International, told me. She gave the example of a researcher in Sweden studying a potential Long COVID treatment with funding from her organization: for this researcher, the equivalent of IRB approval took a few hours rather than a few months.
Clinical trials in the U.S. also face extra hurdles when they involve studying new drugs, as our research system makes it easier for companies that develop these drugs to do new clinical trials than for outside academics to undertake similar studies. For example, Putrino told me that he would love to study the potential for Paxlovid, the antiviral drug for acute COVID-19, to treat Long COVID patients. But, he said, “I physically don’t have the bandwidth to fill out the hundreds of pages of documents” that would be required for such a trial.
The company is “considering how we would potentially study it,” Kit Longley, a spokesperson for Pfizer, wrote in an email, but declined to clarify why the company has no study under way. That frustrates Putrino, of Mount Sinai, who thinks Pfizer will need to spearhead many of these efforts; it’s Pfizer’s drug, after all, and the company has the best data on it, and the means to move it forward… When asked to elaborate on Paxlovid’s experimental status, the NIH said only that the agency “is very interested in long term viral activity as a potential cause of PASC (long COVID), and antivirals such as Paxlovid are in the class of treatments being considered for the clinical trials.”
The NIH has historically underfunded and undervalued research into other post-viral conditions.
When I shared my Grid story on Twitter this week, a lot of patients with myalgic encephalomyelitis (ME), dysautonomia, and other post-viral illnesses said that the issues outlined in my piece felt very familiar.
After all, the NIH has been failing to fund research into their conditions for decades. Pots, one type of dysautonomia, received less than $2 million a year in NIH funding before the pandemic, Stiles told me. As a result, scientists and clinicians in the U.S. have fairly limited information on these other chronic conditions—in turn, limiting the sources that Long COVID researchers may use as starting points for their own work.
Long COVID patients share a lot of symptoms with ME, dysautonomia, and other chronic post-viral illness patients; in fact, many Long COVID patients have been diagnosed with these other conditions. According to one study by the Patient-Led Research Collaborative, almost 90% of Long COVID patients experience post-exertional malaise, the most common symptom of ME.
Despite the historical underfunding, post-viral illness researchers have still made major strides in studying this condition that could provide springboards for RECOVER. But the NIH trial isn’t using them, say experts I talked to. Here are a few paragraphs from an early draft of the story:
“NIH is approaching Long COVID as a brand-new phenomenon,” said Emily Taylor, an advocate at Solve ME, even though it has extensive overlaps with these other conditions. “We’re starting at square one, instead of starting at square 100.”
Long COVID patients and those ME have already come together organically to share tips and resources, she said. For example, Long COVID patients versed in medical research have educated ME patients on potential biological mechanisms for their chronic illness, while ME patients have shared methods for resting, pacing, and managing their conditions.
Experts in conditions like ME were not included in the trial’s leadership early on, and are now outnumbered in committees by cardiologists, respiratory experts, and others who have limited existing knowledge about post-viral illness. “Right now, there are three people with [dysautonomia] expertise on these committees,” Stiles said.
With the other two experts, Stiles has advocated for autonomic testing—a series of tests measuring the autonomic nervous system, believed to be a key driver of Long COVID symptoms—to be conducted on all RECOVER patients. A few of these tests have been added to the protocol, she said, but not the full list needed to get a comprehensive reading of patients’ nervous systems.
America’s fractured medical system and lack of broad knowledge on Long COVID have contributed to data gaps, access issues.
How does a Long COVID patient know that they have Long COVID? Ideally, more than two years into the pandemic, the U.S. medical system would have developed a consistent way of diagnosing the condition. Instead, patients are still getting diagnoses in a variety of ways, including (but not limited to):
A positive PCR test, followed by prolonged symptoms.
A positive rapid/at-home test, followed by prolonged symptoms.
Prolonged symptoms, perhaps later associated with COVID-19 via a positive antibody test.
Self-diagnosis based on prolonged symptoms.
An official diagnosis of Long COVID from a doctor.
An official diagnosis of ME, pots, mass cell activation syndrome, and/or other conditions from a doctor.
Patients also continue to face numerous barriers to formal Long COVID diagnoses, compounded by the fractured nature of the medical system. A lot of doctors and other medical providers—especially at the primary care level—still don’t know about the condition, and may make it hard for patients to learn that their prolonged fatigue is actually Long COVID. PCR or lab-based COVID-19 testing is also getting harder to access across the country, and many doctors won’t take a positive antigen test as proof of infection.
All of this means that the U.S. does not have a good estimate of how many Americans are actually suffering from Long COVID. There’s no central registry of patients who can be contacted for potential trials; there aren’t even basic demographic estimates of how many Long COVID patients are Black, Hispanic, or otherwise from marginalized communities. These data gaps make it hard for researchers studying Long COVID to set goals for patient recruitment.
And then, beyond receiving a diagnosis, actually getting care for Long COVID may require patients to wait weeks for appointments with specialists, contact many different doctors, and generally advocate for themselves in the medical system—while dealing with chronic, debilitating symptoms. As a result, as I wrote in the story:
The long covid patients who are believed by their doctors, who garner media attention, who serve on RECOVER committees — they’re more likely to be white and financially better-off, said Netia McCray, a Black STEM entrepreneur and long covid patient who has enrolled in the trial.
So far, RECOVER has not been doing much to combat this inherent bias in the patients who know about the trial (and about their own condition) and are able to sign up for participation.
Clinical trials in the U.S. are not typically set up in a way that prioritizes patient engagement, especially chronically ill patient engagement.
One major concern from Long COVID patient advocates involved with RECOVER is that the trial has not prioritized patient engagement—which should be a priority, considering all the medical bias that patients have faced while they’ve become experts in their own condition over the last two years.
Here’s a bit more detail on this issue, taken from an early draft of my Grid story:
Patients serving on the committees are dramatically outnumbered by scientists, creating an “intimidating” environment that makes it hard to speak up about their needs, said Karyn Bishof, founder of the COVID-19 Longhauler Advocacy Project. This feeling is exacerbated when scientists on the committees are misinformed about Long COVID and dismiss patients’ experiences, she said.
Some scientists on the committees are receptive to patient input, representatives told me. Still, the structure is not in their favor: not only are patents outnumbered, it’s also a challenge for them to simply show up to committee meetings. Many Long COVID patients are, by definition, dealing with chronic symptoms that are not conducive to regular meeting attendance. Some are managing a barrage of doctors appointments, jobs, caregiving responsibilities, and more.
For instance, a second patient representative on a committee with Lauren Stiles—who serves as a representative because she has suffered from Long COVID in addition to other forms of dysautonomia—once missed a meeting because she had to go to the hospital. “If I wasn’t there, no patient would have been represented at all,” Stiles said.
Patients are compensated for their time in meetings, but not for hours spent doing other research outside those calls. And there’s no structure for patient representatives to coordinate more broadly; patients are operating in silos, with limited information about what representatives on other committees may be doing.
The NIH has potential models for improving this structure; it could draw from past HIV/AIDS clinical trials that had oversight from that patient community, advocate JD Davids told me. And leaders of RECOVER have acknowledged that they need to improve: as I highlighted in the story, trial leadership met with patient advocates earlier this month to discuss potential changes:
[Lisa McCorkell, advocate and researcher from the Patient-Led Research Collaborative] said that the meeting made it clear that the NIH and RECOVER leadership understand that improving patient engagement is key to the study’s success. “We agreed to work together to strengthen trust, improve representation of patients, and ensure greater accountability and transparency,” she said in an emailed statement.
The pressure is on for the NIH and RECOVER leadership to follow up on their promises. I, for one, intend to continue reporting on the trial (and on Long COVID research more broadly) as much as possible.
Omicron BA.2.12.1 (shown here in red) is taking over from BA.2 (pink) in much of the country, with the Northeast in the lead. Chart via the CDC, data as of May 7.
In the past week (May 7 through 13), the U.S. reported about 590,000 new COVID-19 cases, according to the CDC. This amounts to:
An average of 85,000 new cases each day
181 total new cases for every 100,000 Americans
31% more new cases than last week (April 30-May 6)
In the past week, the U.S. also reported about 18,000 new COVID-19 patients admitted to hospitals. This amounts to:
An average of 2,600 new admissions each day
5.6 total admissions for every 100,000 Americans
18% more new admissions than last week
Additionally, the U.S. reported:
1,900 new COVID-19 deaths (0.6 for every 100,000 people)
99% of new cases are Omicron BA.2-caused; 43% BA.2.12.1-caused (as of May 7)
An average of 80,000 vaccinations per day (per Bloomberg)
New COVID-19 cases continue to rise in the U.S., with an average of 85,000 cases reported nationally each day last week—double the daily average from three weeks ago. This is a significant undercount, of course, as the majority of COVID-19 tests conducted these days are done at home.
The country is also reporting more COVID-19 patients admitted to hospitals: about 18,400 people were admitted last week, an 18% increase from the prior week. While this is far lower than the numbers reported during the peak of the Omicron wave (and includes some incidental hospitalizations), it’s still a concerning signal: even as immunity from prior vaccinations and infections protects many Americans from severe disease, plenty of people remain vulnerable.
This current increase is largely driven by the Omicron subvariant BA.2 and its offshoot BA.2.12.1, which is the most transmissible version of this lineage yet. BA.2.12.1 caused about 43% of new cases nationwide in the week ending May 7, according to CDC estimates; in parts of the Northeast, Midwest, and South, that ratio is over 50%.
The Northeast, which has the most BA.2.12.1, also continues to report the highest coronavirus levels in wastewater regionally, according to Biobot. After a potential plateau in recent weeks, the Northeast is now continuing to show a clear uptick; wastewater data from other parts of the country also indicate a slow increase in coronavirus transmission.
The CDC’s wastewater data somewhat reaffirm these trends, but are currently difficult to interpret as a number of sites have gone offline recently. (More on that later in the issue.)
States with the highest COVID-19 case rates continue to include Northeast states: Rhode Island, Massachusetts, New York, Maine, Vermont, New Jersey, and Washington, D.C. But some Midwest states (Illinois, Michigan, Wisconsin) as well as Hawaii are also reporting over 250 new cases per 100,000 people in the last week, showing how this BA.2 surge is spreading to other regions.
If you look at the CDC’s Community Level guidance, you may think that, even if you live in one of these surging Northeast states, you can go out in public without a mask. But other metrics, such as the agency’s old Community Transmission levels (which are based more on cases than hospitalizations), suggest otherwise.
1. Based on this week's @CDCgov transmission levels, 89% of the US population lives in a county classified as "substantial" or "high".
— Jason L. Salemi, PhD, FACE (@JasonSalemi) May 13, 2022
In short: if you want to protect yourself and others in your community, especially if you live in the Northeast, now is a good time to mask up, test often, and avoid large indoor gatherings.
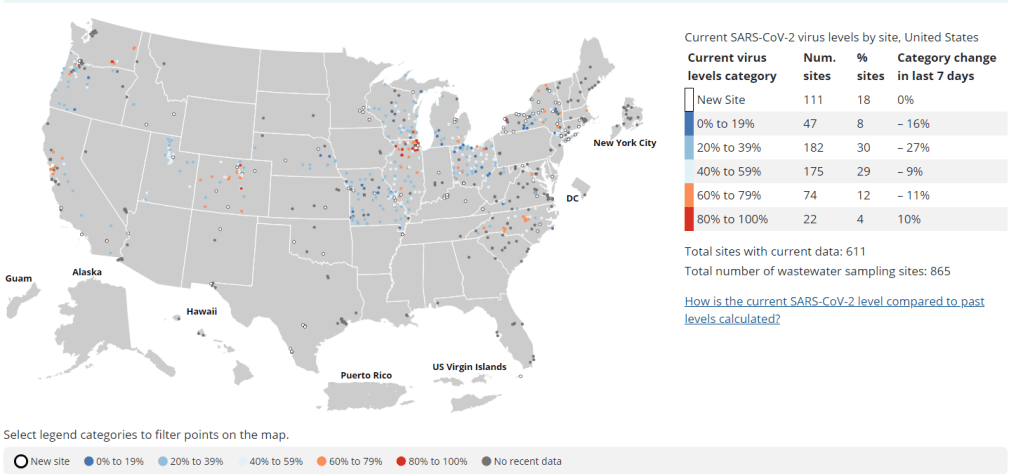
Anyone who’s pulled up the CDC’s National Wastewater Surveillance System (NWSS) dashboard in the last week or two has likely noticed this trend: hundreds of sewershed sites are currently marked as “no recent data.” I keep a particularly close eye on the sites in New York City, which have been reporting “no recent data” for at least two weeks.
According to the CDC, a site marked as “no recent data” has reported findings from fewer than two wastewater samples in the last 15 days. In practice, it could either indicate that a site actually isn’t sampling its wastewater frequently enough for the CDC’s standards, or it could indicate a lack of capacity to process those samples. Probably, both things are happening at a lot of these sites.
From corresponding with press officers at NWSS, I know that the team is working with state and local health agencies, as well as with individual sewershed sites, to ensure accurate data and standardize reporting. This is a massive task, considering that wastewater surveillance started as a grassroots effort in labs with many different sampling and analytical methods, and I appreciate the NWSS team’s efforts.
But I think they could increase transparency about the sites where recent data isn’t available—either on the dashboard itself or in other public communications. I shouldn’t have to hunt through Twitter replies to find the most basic info about wastewater data updates! Especially when this source is becoming increasingly important in the wake of less reliable case data.
Yes. @amylizk said they have been having some staffing issues. They are looking into it.
CDC adds second boosters to its vaccine dashboard: In the latest update to the CDC’s COVID Data Tracker, you can now find a national tally of Americans who have received second booster shots on the “COVID-19 Vaccinations in the United States” page. About 10 million people have received these additional shots as May 6, about one-tenth the number of first booster recipients. The CDC has yet to add state-by-state or demographic data for second boosters.
KFF updates COVID-19 Vaccine Monitor: This week, the Kaiser Family Foundation published the latest update of its Vaccine Monitor, a long-running project tracking Americans’ attitudes towards COVID-19 vaccines and related issues. One notable finding from the April update: just 18% of parents with children under age five are “eager to get their child vaccinated right away,” compared to 27% who say they will “definitely not” get their child vaccinated. This report also includes survey findings on mask-wearing, COVID-19 in the workplace and in schools, and future booster shots.
Biobot on GitHub: I recently learned that Biobot Analytics, the leading COVID-19 wastewater surveillance company, publishes its underlying data on GitHub. This repository includes coronavirus concentrations in wastewater treatment plants monitored by Biobot across the country, along with regional wastewater data, national data, and COVID-19 case numbers for comparison.
TON’s Guide to Tracking Source Diversity: Not directly COVID-related, but a resource that I thought readers may find useful: The Open Notebook (TON) has published a detailed guide for journalists seeking to track the diversity of sources interviewed for their stories. While TON is geared towards science writers, this guide is broadly applicable to any reporter who spends a lot of time seeking out and talking to experts.