- Report on race and ethnicity data collection: Researchers at Boston University’s Center for Antiracist Research, who worked on collecting race and ethnicity data from states during the pandemic, have produced a report about the challenges of this work. I was a long-time volunteer for the COVID Tracking Project’s Racial Data Tracker, which became the first stage of a larger project for the BU center, and I’m glad to see this report highlight the issues with destandardized, incomplete data that I remember well.
- Global impact of vaccines in 2021: In a new paper, published in The Lancet in late June, researchers at Imperial College London evaluate the lives saved by COVID-19 vaccines on a global scale during the first year that this technology was available. Vaccines prevented about 14 million COVID-19 deaths in 185 countries and territories, the researchers found. If global health initiatives like COVAX had met their goals, the lives saved could have been far greater.
- COVID-19 spread from a cat: Scientists in Thailand have identified the first documented case of a human getting the coronavirus from a pet cat. In this case, the cat from a family going through isolation for COVID-19 infected a veterinarian who was caring for it; genetic analysis confirmed that three humans (father, son, and veterinarian) and the cat were infected with the same viral strain. While cases like this are likely rare, the documented transmission demonstrates why we need better tracking of COVID-19 in animals, as I noted last week.
- Potential new approach for tracking variants: A new study in the Journal of Clinical Microbiology, funded by the National Institutes of Health, presents the potential for monitoring coronavirus variants through a PCR testing-based approach. Compared to the techniques labs currently use to track variants—which involve sequencing an entire viral genome—this new approach would be faster, cheaper, and could be performed by more labs. The researchers are eager to share their work “as a public health tool,” they said in an NIH press release.
Blog
-
Sources and updates, July 3
-
We need more data for fall booster decisions

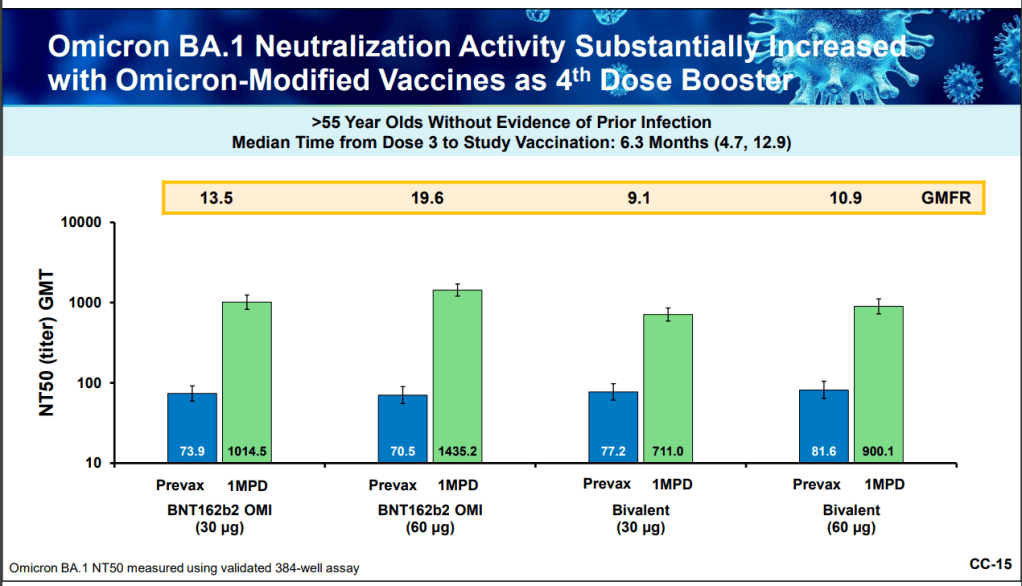
At the FDA advisory committee meeting this week, Pfizer presented data from different options of Omicron-specific booster shots. This week, the FDA’s vaccine advisory committee met to discuss fall booster shots, in anticipation of another COVID-19 surge next winter. The discussion demonstrated the U.S.’s continued failure to provide the data that are really needed to make these decisions.
I have written a lot about this topic in the past, so to avoid being too repetitive, I’ll link to a couple of past articles:
- The data problem underlying booster shot confusion (COVID-19 Data Dispatch, September 2021)
- The U.S. Is Relying On Other Countries’ Data To Make Its Booster Shot Decisions (FiveThirtyEight, November 2021)
- The U.S. still doesn’t have the data we need to make informed decisions on booster shots (COVID-19 Data Dispatch, April 2022)
But here’s the TL;DR: due to the fractured nature of America’s public health system, it’s difficult for researchers to connect data on different health metrics. For example, a state might have one database with vaccination records and another database with case records, and the databases might not easily link to answer questions about breakthrough cases.
Some state health departments have figured out how to make these links, but the process is not uniform. And the breakthrough case data we do have generally aren’t linked to information on variants, or demographic data, or outcomes like Long COVID.
The more specific the vaccine effectiveness question, the more complicated it becomes to answer. This is a bigger problem now as the FDA considers fall boosters, because the agency needs to determine the best vaccine candidate and identify priority populations for shots—while operating in a politcal climate where vaccine funding is less popular than it was a year ago.
Here are a few questions that the FDA is trying to answer, drawing from the STAT News meeting recap:
- Should the fall booster be a monovalent vaccine, meaning it only includes Omicron-specific genetic material? Or should it be bivalent, meaning it includes both Omicron and the original, Wuhan strain? Pfizer and Moderna presented different options; some experts say a bivalent vaccine may provide more long-term protection.
- Should the booster shot be specific to BA.4 and BA.5? The panel agreed that it should, as these strains are now dominant in the U.S., but there’s a timing trade-off as vaccine companies have yet to do clinical trials (or provide substantial data) for a subvariant-specific vaccine.
- Should the booster shot be another type of vaccine entirely? In addition to Pfizer and Moderna, the FDA panel also heard from Novavax. This company has developed a protein-based vaccine that hasn’t yet received FDA authorization, but panelists were impressed by its potential for long-term protection.
- How well do the vaccines provide non-antibody-based protection? As in past advisory committee meetings, the vaccine companies primarily presented data based on antibodies generated from their shots. Experts wanted to see more data about T cells and other aspects of immunity which are harder to measure, but may be more important in the long term.
- Who would most benefit from another booster? If the federal government isn’t able to buy enough shots for everyone, priortization will need to happen. Will Omicron-specific boosters be most useful for seniors, or for people with certain health conditions? These groups will likely get priority again, though we could still be collecting more data on how the vaccines fare for them.
Of course, despite the dearth of data and cautions from some members of the FDA advisory committee, the U.S. government seems to be going full-speed ahead with fall boosters. The Biden administration has placed a $3.2 billion order from Pfizer for 105 million doses of whichever Omicron-specific vaccine the FDA chooses to authorize.
More vaccine reporting
-

Combatting pandemic fatigue with solidarity

The legacies of groups like ACT UP can offer lessons for COVID-19 advocacy. Image via the NIH History Office / Flickr. In the last few weeks, I’ve been thinking a lot about how to remain hopeful.
COVID-19 continues to spread—in fact, the U.S. is likely in the second-largest surge of the entire pandemic right now—but we aren’t counting the majority of cases, much less taking collective health actions to prevent them. Leaders across the political spectrum have largely shrugged off any potential for new safety measures, instead focusing on business interests.
It takes a lot of effort not to simply give up, in this environment. Sometimes, at a gathering or on the New York City subway, I feel a lot of peer pressure to just take off my mask and ignore the risks. But I think about people I’ve talked to in my reporting: Long COVID advocates, people with weakened immune systems, exhausted experts, school officials working to keep their students safe, and so many others. In solidarity with them, I keep the mask on.
I thought about solidarity this week, when I read Ed Yong’s latest COVID-19 feature in The Atlantic. The story is headlined, “America is Sliding into the Long Pandemic Defeat.” But I like the subtitle better: “In the face of government inaction, the country’s best chance at keeping the crisis from spiraling relies on everyone to keep caring.”
In this piece, Yong takes readers through a history of public health’s connections to other social movements, and introduces us to people across the U.S. who are making those connections now. He talks about community health work: “It creates a bedrock of trust and solidarity, without which public health cannot operate.” And he talks about the potential for new policies and health infrastructure that could save lives, even in our current COVID-ambivalent climate.
Obviously, you should read the full story. I personally found it motivating to continue my own COVID-19 work. But, in reflection, I also wanted to share a few ideas for how to find hope and solidarity in this difficult period. This is a little outside my usual data wheelhouse, but it’s informed by my two years of reporting on (and living through) this pandemic.
Here are eight suggestions.
- Talk to people. To friends, family members, people you meet at the grocery store, and so on. Ask them, “Did you know, we’re in a surge right now?” “Have you received your booster shot?” “Do you know where to get free rapid tests in our community, and when to use them?” The simplest questions can spark valuable conversation, in my experience.
- Educate specifically about Long COVID. Show people the recent statistics from the Household Pulse Survey, now the best estimates we have for how many Americans are currently dealing with this condition. Talk about potential symptoms and how the condition may impact someone’s life. There is still not enough awareness in the U.S. about how COVID-19 can cause more than short-term symptoms; individual conversations can help with this.
- Ask for the extra safety measures. If your friend is hosting a party, for example, can you ask them to instruct the guests to rapid test beforehand? If you’re attending a large meeting, can you ask the organizers about recommending masks? Even if not everybody follows the guidance, people might think about safety in a way that they hadn’t before. And vulnerable people in the room will be grateful that they didn’t need to do all the asking themselves.
- Make connections around health. How can you build trust in public health in your community? Who are the leaders who could help advocate for measures like free testing, or would continue to encourage vaccinations when we likely need a new round of booster shots in the fall? Think about who you know, and how they can help.
- Advocate for federal measures. This means funding for more vaccines, tests, and treatments, of course. But it also means federal air quality standards for buildings. Protections for essential workers. Disability rights, which could include (as Yong’s story notes) requiring masks when a disabled person may be present. Call your representatives, and ask them what they’re doing in these areas.
- Learn about public health history. There are actually a lot of precedents that we can draw on for COVID-19 advocacy, Yong explains in his story. These range from the Black Panthers serving breakfast at schools to ACT UP pushing for a new paradigm in clinical trials. Reading history like this can provide ideas for current actions.
- Reframe language around safety measures. Nobody likes a “mandate” or a “requirement.” Americans hate following rules. For this reason, I often see health experts instead using words like “safety measures,” and explaining why they work. Connecting to the language of a particular community can also help; for example, in activist spaces, I remind people that “we keep us safe” also applies to COVID-19 protections.
- Think about the long game. What can you do to maintain energy, avoid burnout, and share your resources with others? This is another lesson from history, I think: even if I feel discouraged about a lack of change in the short-term, I remember that true paradigm shifts take a long time. Hope is a long-term practice.
-
National numbers, July 3

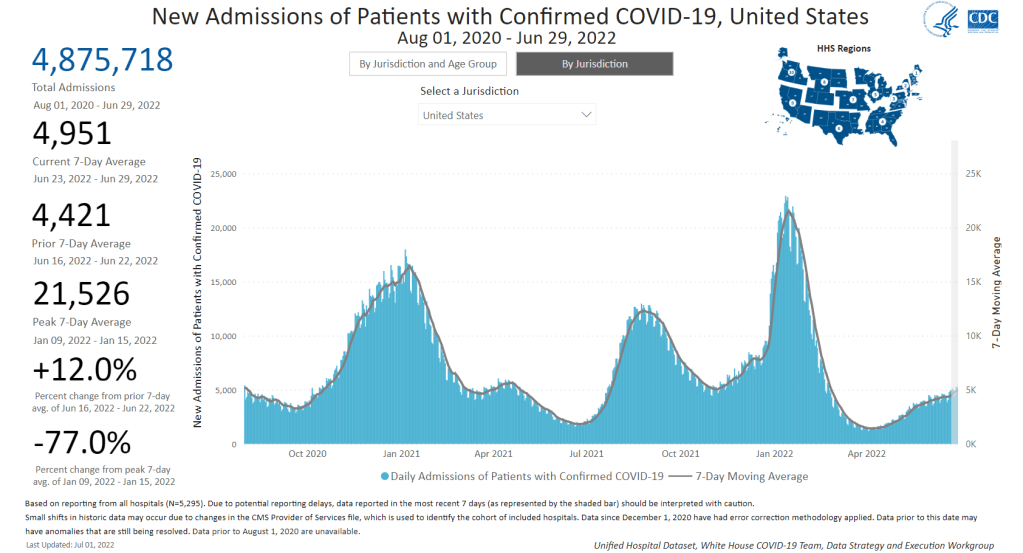
New hospital admissions for COVID-19 increased 12% last week over the week prior, a signal of the continued surge. Chart via the CDC. In the past week (June 25 through July 1), the U.S. reported about 800,000 new COVID-19 cases, according to the CDC. This amounts to:
- An average of 110,000 new cases each day
- 234 total new cases for every 100,000 Americans
- 11% more new cases than last week (June 18-24)
In the past week, the U.S. also reported about 35,000 new COVID-19 patients admitted to hospitals. This amounts to:
- An average of 5,000 new admissions each day
- 10.6 total admissions for every 100,000 Americans
- 12% more new admissions than last week
Additionally, the U.S. reported:
- 2,200 new COVID-19 deaths (0.7 for every 100,000 people)
- 48% of new cases are Omicron BA.2.12.1-caused; 52% BA.4/BA.5-caused (as of June 25)
- An average of 150,000 vaccinations per day (per Bloomberg)
BA.4 and BA.5 are now the dominant coronavirus lineages in the U.S., and they’re reviving our recent surge: from the plateau of recent weeks, national COVID-19 cases are clearly going up again. Reported cases rose 11% last week from the week prior. And, as always, this number is a significant undercount of true infections.
New hospital admissions also went up last week: about 5,000 Americans were admitted to hospitals with COVID-19 each day, up 12% from the week prior. While the vast majority of COVID-19 cases may now be mild—thanks to vaccinations, prior infections, and treatments—this is a reminder that severe symptoms are still very possible.
Wastewater data from Biobot indicate a continued plateau in transmission at the national level. At the regional level, COVID-19 levels are trending down in the West and South, but ticking up again in the Northeast, likely as BA.4 and BA.5 take over from BA.2.12.1 in these areas.
In my FAQ post last month ago, I wrote that scientists weren’t yet sure whether BA.4 and BA.5 would be able to outcompete BA.2.12.1, the offshoot of BA.2 first identified in New York. Now, it seems clear that BA.4 and BA.5 are capable of dominating: these two subvariants caused over half of new cases nationwide in the week ending June 25, as well as in most regions.
Even places like New York City, which saw a major BA.2/BA.2.12.1 wave, is now reporting another uptick in cases, according to data from the local health department. The city’s test positivity rate went over 10% on Thursday for the first time since January, a signal of the underreporting in recent weeks as PCR testing becomes less popular. And yet, city leadership is not interested in implementing any new safety precautions.
Remember, the problem with these subvariants is that they’re built for reinfection. Even if you had Omicron BA.1 in the winter, or even had BA.2 this spring, you could easily get BA.4 or BA.5. These infections are, at best, a week-long inconvenience, and at worst, could turn into Long COVID.
The holiday tomorrow will interrupt COVID-19 reporting, as holidays always do. Stay safe this weekend, and don’t be fooled if you see a brief downturn in case numbers.
-
Sources and updates, June 26

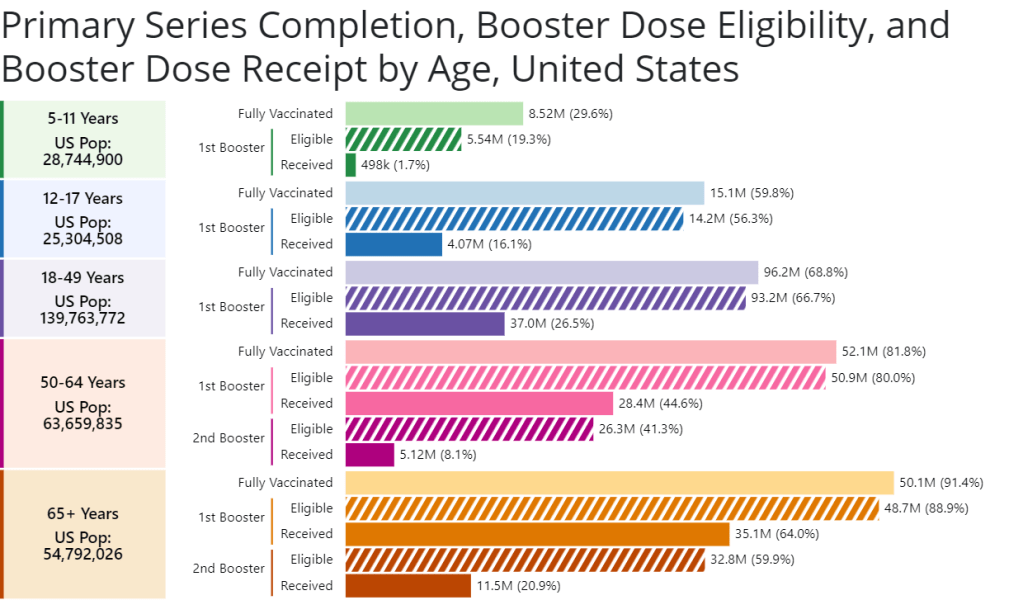
A new chart from the CDC shows booster shot eligibility and uptake by age. Retrieved on June 26. - CDC report on Paxlovid distribution: A major study from the CDC’s Morbidity and Mortality Weekly Report this week: researchers at the CDC and collaborators studied the distributions of antiviral COVID-19 drugs Paxlovid and Lagevrio (also called Molnupiravir) by ZIP code, comparing ZIP codes with the CDC’s Social Vulnerability Index. More than one million prescriptions were dispensed between late December 2021 and late May 2022, the study found. But, by the end of that period, prescription rates were twice as high in low- and medium-vulnerability ZIP codes as in high-vulnerabilty ZIP codes—indicating that these antivirals are not reaching the people who most need them.
- CDC booster shot data update: The CDC has added a new chart to its “COVID-19 Vaccinations in the United States” page, showing booster shot eligibility and uptake by age. The chart includes two rounds of boosters for seniors; according to the data, 64% of eligible seniors have received their first booster, but only 21% have received their second booster. The data are also available for download.
- COVID-19 vaccinations among children: I also recently learned about this CDC page focused on kids’ vaccinations, including vaccination coverage by demographic factors such as poverty status, parents’ education level, and insurance. The data come from a national survey previously used to monitor flu vaccinations among children. Data are updated monthly, and don’t yet include figures for children under 5; but existing data for children ages 5-17 affirm that vaccine uptake for kids has been low so far.
- Guide to finding government COVID-19 documents: The Digital Public Library of America has released a free ebook with an archive of over 3,000 government documents related to the pandemic response. These documents were collected by the COVID Tracking Project during its year of work, and have been meticulously categorized and indexed in true CTP fashion. CTP alum Jennifer Clyde was the project’s editor.
- Commonwealth Fund report on improving our public health system: A new report from healthcare-focused foundation The Commonwealth Fund provides recommendations for improving the country’s public health system. It focuses on organizing local agencies, providing more funding, improving trust, and other key topics.
- History of exposure notification apps: Jenny Wanger, whom I interviewed about COVID-19 exposure notification apps back in spring 2021, sent me this paper she wrote about the technology, which was published earlier in June. The paper provides a report of how exposure notification protocols were developed, how states used the technology, and how limited data made it difficult to assess the technology’s success.
-
Staggering new Long COVID research, and a correction

The Census and NCHS are releasing new, comprehensive data on Long COVID prevalence based on a nationally representative survey. I’m doing another post dedicated to Long COVID research this week, unpacking a noteworthy new data source. Also, I have an update about a Long COVID study that I shared in last week’s issue.
First: new data from the Household Pulse Survey suggests that almost 20% of Americans who got COVID-19 are currently experiencing Long COVID symptoms. The Household Pulse Survey is a long-running Census project that provides data on how the pandemic has impacted Americans, with questions ranging from job loss to healthcare access.
In the most recent iteration of this survey, which started on June 1, the Census is asking respondents about Long COVID: specifically, respondents can share whether they had COVID-related symptoms that lasted three months or longer. The first round of data from this updated survey were released last week (representing respondents surveyed between June 1 and June 13), in a collaboration between the Census and the CDC’s National Center for Health Statistics (NCHS).
The numbers are staggering. Here are a few notable findings, sourced from the NCHS press release:
- An estimated 14% of all U.S. adults have experienced Long COVID symptoms at some point during the pandemic.
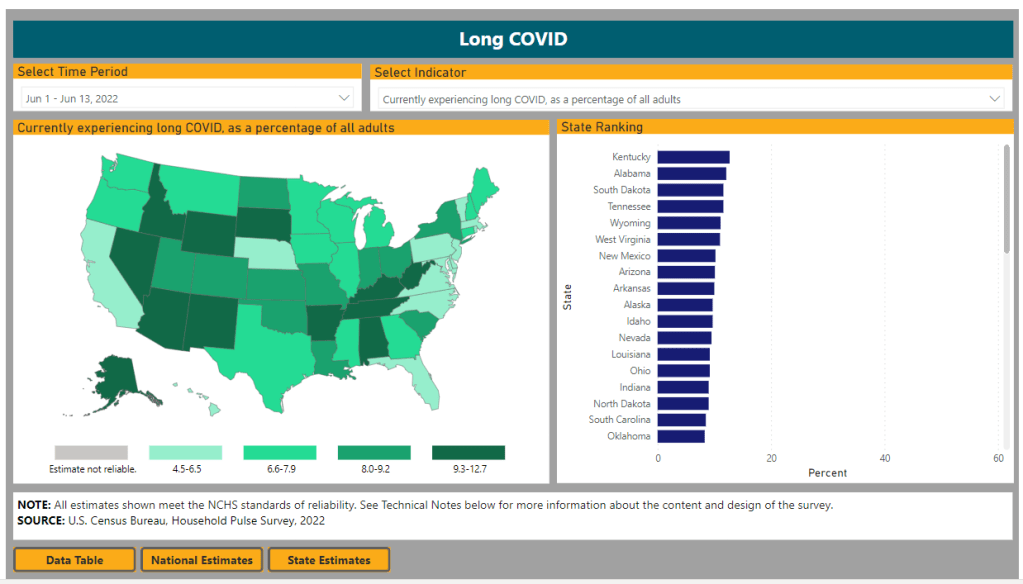
- About 7.5% of all U.S. adults are currently experiencing Long COVID symptoms, representing about one in 13 Americans.
- Out of U.S. adults who have ever had COVID-19, about 19% are currently experiencing Long COVID symptoms.
- Older adults are more likely to report Long COVID than younger adults, while women are more likely to report it than men.
- About 8.8% of Hispanic or Latino adults are currently experiencing Long COVID, compared to 6.8% of Black adults and 7.5% of White adults.
- Bisexual and transgender adults were more likely to report current Long COVID symptoms (12.1% and 14.9%, respectively) than those of other sexualities and genders.
- States with higher Long COVID prevalence included Southern states like Kentucky, Alabama, and Tennessee.
This study is a big deal. The Household Pulse Survey is basically the closest comparison that the U.S. has to the U.K.’s highly-lauded Office for National Statistics survey, in that the survey can collect comprehensive data from a representative subset of Americans and use it to provide national estimates.
In other words: two years into the pandemic, we finally have a viable estimate of how many people have Long COVID, and it is as large an estimate as Long COVID advocates warned us to expect. Plus, demographic data! State-by-state-data! This is incredibly valuable, moreso because the Household Pulse Survey will continue incorporating Long COVID into its questions.
Also, it’s important to note that Long COVID patients were involved in advocating for and shaping the new survey questions. Big thanks to the Patient-Led Research Collaborative and Body Politic for their contributions!
Next, two more Long COVID updates from the past week:
- Outcomes of coronavirus reinfection: A new paper from Ziyad Al-Aly and his team at the Veterans Affairs Saint Louis healthcare system, currently under review at Nature, explores the risks associated with a second coronavirus infection. They found that a second infection led to higher risk of mortality (from any cause), hospitalization, and specific health outcomes such as cardiovascular disorders and diabetes. “The risks were evident in those who were unvaccinated, had 1 shot, or 2 or more shots prior to the second infection,” the researchers wrote in their abstract.
- NIH data now available for Long COVID research: The National Institutes of Health’s “All of Us” research program is releasing a dataset from almost 20,000 people who have had COVID-19 for scientists to study. The data come from clinical records, genomic sequencing, and patient-reported metrics; researchers can use them to examine Long COVID trends, similarly to the way in which Al-Aly’s team uses VA records to study COVID-19 outcomes.
And finally, a correction: Last week, I shared a paper published in The Lancet which indicated Long COVID may be less likely after an Omicron infection compared to a Delta infection. A reader alerted me to some criticism of this study in the Long COVID community.
Specifically, the estimates in the paper are much lower than those found by the U.K.’s ONS survey, which is considered more reliable. This Lancet paper was based not on surveys but on a health app which relies on self-reported, volunteer data. In addition, the researchers failed to break out Long COVID risk by how many vaccine doses patients had received, which may be a key aspect of protection.
Finally, as I noted last week, even if the risk of Long COVID is lower after an Omicron infection, the risk is still there. And when millions of people are getting Omicron, a small share of Omicron infections leading to Long COVID still leads to millions of Long COVID cases.
More Long COVID reporting
-
Nine areas of data we need to manage the pandemic

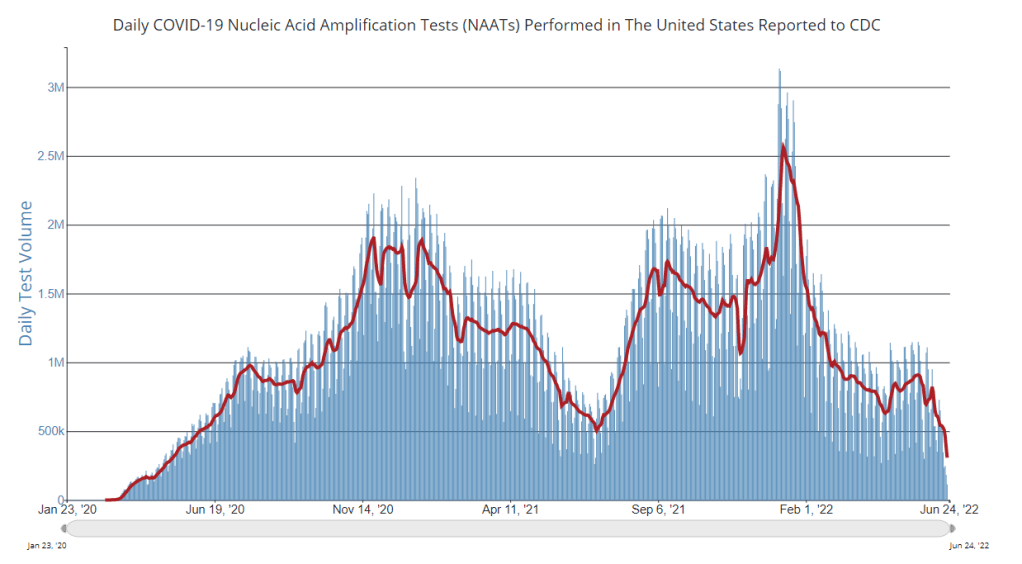
PCR testing has greatly declined in recent months; we need new data sources to help replace the information we got from it. Chart via the CDC. Last week, I received a question from my grandmother. She had just read my TIME story about BA.4 and BA.5, and was feeling pessimistic about the future. “Do you think we’ll ever get control of this pandemic?” she asked.
This is a complicated question. And it’s one that I’ve been reflecting on as well, as I approach the two-year anniversary of the COVID-19 Data Dispatch and consider how this publication might shift to meet the current phase of the pandemic. I am not an infectious disease or public health expert, but I wanted to share a few thoughts on this; to stay in my data lane, I’m focusing on data that could help the U.S. better manage COVID-19.
The coronavirus is going to continue mutating, evolving past immune system defenses built by prior infection and vaccination. Scientists will need to continue updating vaccines and treatments to match the virus, or we’ll need a next-generation vaccine that can protect against all coronavirus variants.
Candidates for such a vaccine, called a “pan-coronavirus vaccine,” are under development by the U.S. Army and at several other academic labs and pharmaceutical companies. But until a pan-coronavirus vaccine becomes available, we’ll need to continue tracking new variants and the surges they produce. We also need to better track Long COVID, a condition that our current vaccines do not protect well against.
Eventually, COVID-19 will likely be just another respiratory virus that we watch out for during colder months and large indoor gatherings, broadly considered “endemic” by scientists. But it’s important to note—as Dr. Ellie Murray did in her excellent Twitter thread about how pandemics end—that endemicity does not mean we stop tracking COVID-19. In fact, thousands of people work to monitor and respond to another endemic virus, the flu.
With that in mind, here are nine categories of data that could help manage the pandemic:
- More comprehensive wastewater surveillance: As I’ve written here and at FiveThirtyEight, sewers can offer a lot of COVID-19 information through a pipeline that’s unbiased and does not depend on testing access. But wastewater monitoring continues to be spotty across the country, as the surveillance can be challenging to set up—and more challenging for public health officials to act on. Also, current monitoring methods exclude those 21 million households that are not connected to public sewers. As wastewater surveillance expands, we will better be able to pinpoint new surges right as they’re starting.
- Variant surveillance from wastewater: Most of the U.S.’s data on circulating variants currently comes from a selection of PCR test samples that are run through genomic sequencing tests. But this process is expensive, and the pool of samples is dwindling as more people use at-home rapid tests rather than PCR. It could be cheaper and more comprehensive to sequence samples from wastewater instead, Marc Johnson explained to me recently. This is another important aspect of expanding our wastewater monitoring.
- Testing random samples: Another way to make up for the data lost by less popular PCR testing is conducting surveillance tests on random samples of people, either in the U.S. overall or in specific cities and states. This type of testing would provide us with more information on who is getting sick, allowing public health departments to respond accordingly. The U.K.’s Office for National Statistics conducts regular surveys like this, which could serve as a model for the U.S.
- More demographic data: Related to random sample testing: the U.S. COVID-19 response still needs more information on who is most impacted by the pandemic, as well as who needs better access to vaccines and treatments. Random sampling and surveys, as well as demographic data connected to distributions of treatments like Paxlovid, could help address this need.
- Vaccine effectiveness data: I have written a lot about how the U.S. does not have good data on how well our COVID-19 vaccines work, thanks to our fractured public health system. This lack of data makes it difficult for us to identify when vaccines need to be updated, or who needs another round of booster shots. Connecting more vaccination databases to data recording cases, hospitalizations, and Long COVID would better inform decision-making about boosters.
- Air quality monitoring: Another type of data collection to better inform decision-making is tracking carbon dioxide and other pollutants in the air. These metrics can show how well-ventilated (or poorly-ventilated) a space is, providing information about whether further upgrades or layers of safety measures are needed. For example, I’ve seen experts bring air monitors on planes, citing poor-quality air as a reason to continue wearing a mask. Similarly, the Boston public school district has installed air monitors throughout its buildings and publishes the data on a public dashboard.
- Tracking animal reservoirs: One potential source for new coronavirus variants is that the virus can jump from humans into animals, mutate in an animal population, and then jump back into humans. This has happened in the U.S. at least once: a strain from minks infected people in Michigan last year. But the U.S. is not requiring testing or any mandatory tracking of COVID-19 cases in animals that we know are susceptible to COVID-19. Better surveillance in this area could help us catch variants.
- Better Long COVID surveillance: For me personally, knowledge of Long COVID is a big reason why I remain as cautious about COVID-19 as I am. Long COVID patients and advocates often say that if more people understood the ramifications of this long-term condition, they might be more motivated to take precautions; I think better prevalence data would help a lot with this. (The Census and CDC just made great strides in this area; more on that later in the issue.) Similarly, better data on how the condition impacts people would help in developing treatments—which will be crucial for getting the pandemic under control.
- More accurate death certificates: The true toll of the pandemic goes beyond official COVID-19 deaths, as the Documenting COVID-19 project has discussed at length in our Uncounted investigation. If we had a better accounting of everyone whose deaths were tied to COVID-19, directly or indirectly, that could be another motivator for people to continue taking safety precautions and protecting their communities.
If you are working to improve data collection in any of these areas—or if you know a project that is—please reach out! These are all topics that I would love to report on further in the coming months.
More federal data
-
National numbers, June 26

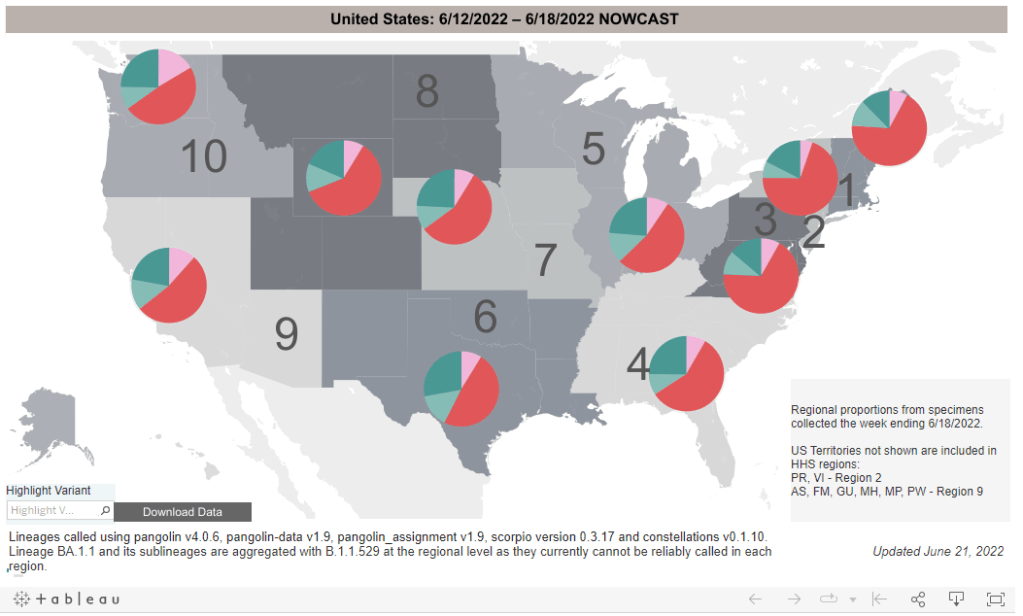
BA.4 and BA.5 (teal) are competing with BA.2.12.1 (red), with different lineages dominating in different parts of the country. CDC estimates reflect the week from June 12 to June 18. In the past week (June 18 through 24), the U.S. reported about 680,000 new COVID-19 cases, according to the CDC. This amounts to:
- An average of 100,000 new cases each day
- 208 total new cases for every 100,000 Americans
- 6% fewer new cases than last week (June 11-17)
In the past week, the U.S. also reported about 31,000 new COVID-19 patients admitted to hospitals. This amounts to:
- An average of 4,400 new admissions each day
- 9.3 total admissions for every 100,000 Americans
- 1% more new admissions than last week
Additionally, the U.S. reported:
- 1,800 new COVID-19 deaths (0.5 for every 100,000 people)
- 56% of new cases are Omicron BA.2.12.1-caused; 35% BA.4/BA.5-caused (as of June 18)
- An average of 50,000 vaccinations per day (per Bloomberg)
America’s Omicron subvariant surge continues to be in a plateau this week, with national COVID-19 case rates, hospitalization rates, and wastewater trends remaining fairly level or showing slight declines.
The U.S. has reported a weekly average between 100,000 and 110,000 new cases a day since mid-May, according to the CDC. These numbers are massive undercounts, as about five times more rapid antigen tests are being conducted in the U.S. than PCR tests, so the true trend is difficult to discern—but we can safely say that there is a lot of coronavirus circulating throughout the country.
New hospital admissions, the number of COVID-19 patients who sought treatment, rose slightly in the last week: about 4,400 patients were admitted each day nationwide, compared to 4,300 last week. Wastewater data from Biobot shows a national plateau, as coronavirus levels drop in the Northeast and West while rising in the South and remaining stagnant in the Midwest.
Why this prolonged plateau? Most likely, the rise of immune-evading Omicron subvariants BA.4 and BA.5 is preventing a BA.2-initiated wave from truly dipping back down. Estimates from the CDC suggest that BA.4 and BA.5 may even be outcompeting BA.2.12.1: the share of U.S. cases caused by BA.2.12.1 dropped for the first time in the CDC’s latest variant prevalence update, from 63% in the week ending June 11 to 56% in the week ending June 18.
Regions with a higher share of BA.4 and BA.5—namely, Gulf Coast states, the Midwest, and the West Coast—are also reporting case increases. A few state hotspots that stick out in the (admittedly, poor) official case counts: Hawaii, Florida, New Mexico, Alaska, and California all reported more than 250 new cases per 100,000 people in the week ending June 22.
In the Northeast, BA.2.12.1 is still causing a majority of cases, but BA.4 and BA.5 are gaining some ground. This may explain why places like New York City are seeing case trends that simply refuse to go down as quickly as we’ve observed in past waves, though a lack of new safety measures is likely also playing a role.
Meanwhile, vaccination rates remain the lowest they’ve been since late 2020. Fewer than 25,000 people received a first vaccine dose in the week ending June 21, according to the CDC. I was expecting to see a bump from children under five finally becoming eligible for vaccination, but it has not shown up in the data yet—likely another signal of current apathy towards COVID-19 safety.
-
COVID source callout: Dr. Fauci, please take a week off
This past Wednesday, the NIH announced that Dr. Anthony Fauci has tested positive for COVID-19. Dr. Fauci has been leading the U.S. COVID-19 response since early days of the pandemic, and this appears to be his first time getting personal experience with the virus.
According to the NIH, Dr. Fauci is “fully vaccinated and has been boosted twice,” and was experiencing mild symptoms as of his positive antigen test. This is great news, and I hope that his symptoms remain mild (truly mild, not just non-hospitalized mild), and he has a swift recovery.
But then we get to a more concerning line in the press release: “Dr. Fauci will isolate and continue to work from his home.” Why is he continuing to work? By all accounts, rest is important for recovering from COVID-19 and avoiding long-term symptoms. This is especially crucial for Dr. Fauci, as someone who’s older (and therefore at higher risk).
When top-tier government health officials work through COVID-19, they set a dangerous precedent for all the people looking to them for guidance. Anne Helen Peterson wrote about this in Culture Study recently; it’s a good read, especially for those who hold positions of power in their workplaces.
I hope Dr. Fauci gets some rest—he would deserve a break even if he didn’t have COVID-19.
-
Sources and updates, June 19

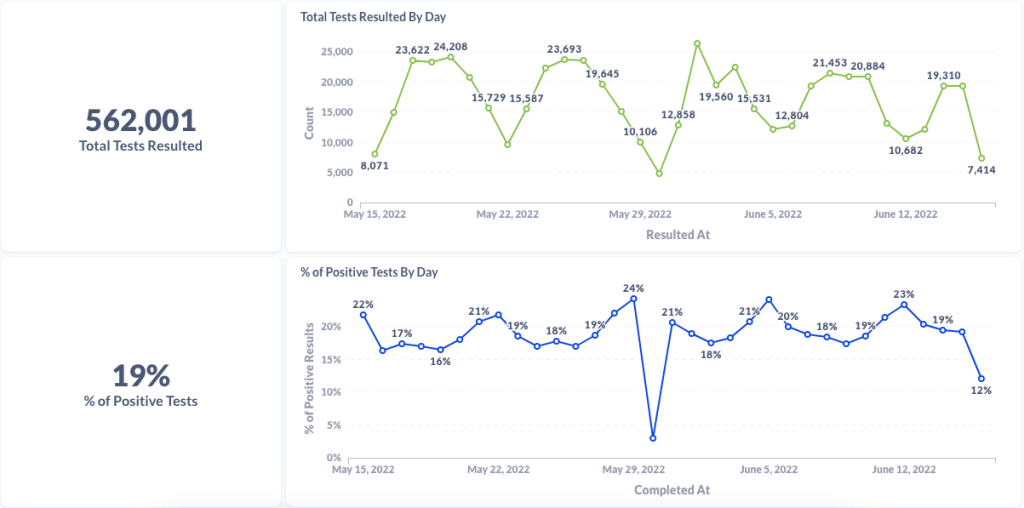
Chart from Curative showing test numbers and test positivity from their sites 
Chart from Curative showing testing data for Alexandria, Virginia (a current hotspot) 
Chart from Curative showing testing data for Houston, Texas (another current hotspot) - Curative provides testing trends and commentary to reporters: Last week, I talked to Isaac Turner, chief technology officer at Curative, a COVID-19 testing company with more than 15,000 locations across the country. Curative staff keep a close eye on trends in test positivity and cycle threshold values (a measure of how infectious someone with COVID-19 may be), and share this information with health agencies. While the company doesn’t have a public dashboard, they’re eager to share data with reporters on request and discuss testing trends. For example, Turner told me that in recent weeks, there has been “almost no surge in testing” even though COVID-19 cases have clearly risen across the country. To reach out, you can contact PIO Alana at alana.prisco@ketchum.com.
- Walgreens COVID-19 testing dashboard: Another source for testing trends, as government sources become less reliable, is the Walgreens dashboard—incorporating data from COVID-19 PCR testing at more than 5,000 Walgreens locations across the country. In partnership with Aegis Services, many of these test samples are sequenced or identified as specific variants via S-gene target failure. The Walgreens dashboard has a shorter lag time than the CDC’s variant prevalence estimates, so it may be a useful way to see trends in advance.
- Kids under 5 can finally get vaccinated: As of yesterday, the CDC has formally recommended versions of both Pfizer’s and Moderna’s COVID-19 vaccines for children under age 5 after they received emergency use authorization from the FDA. This youngest age group can finally get vaccinated! I usually like to watch the FDA advisory committee meetings where new vaccines are discussed, but didn’t have the bandwidth to watch or report on the meetings this week; if you’d like to read up on them, I recommend the Your Local Epidemiologist and STAT News recaps.
- Estimating lives saved by universal healthcare: A major new paper this week, by researchers at the Yale School of Public Health, estimates that if the U.S. had a single-payer universal healthcare system, the country may have saved 212,000 lives during the first year of the pandemic. They arrived at this estimate by analyzing data on Americans who lost their health insurance in 2020 or were already uninsured, combined with the impact of being uninsured on COVID-19 mortality. A universal healthcare system would have also saved over $100 billion in healthcare costs in 2020, the researchers found. Read more at Scientific American.
- Long COVID may be less likely after an Omicron case: Another new study that caught my attention this week: researchers at King’s College London used the U.K.’s excellent statistics on Long COVID prevalence to compare the risks of long-term symptoms after a Delta infection to the risks after an Omicron infection. They found that the risk of Long COVID after an Omicron infection was about half the risk after a Delta infection, which is potentially pretty good news! Still, it’s still concerning that so many people are at risk for Long COVID after an Omicron infection considering the high case numbers driven by this variant, some outside researchers told NPR.
- CDC study on COVID-19 risk for people with disabilities: And one more notable study: CDC researchers examined COVID-19 hospitalization rates among Medicare beneficiaries, comparing those who were on this healthcare plan due to disability to those on the plan due to age. They found that disability beneficiaries had 50% higher hospitalization rates, with the risk for hospitalization increasing with age in both groups. Also: Native American Medicare beneficiaries had the highest hospitalization rate of any racial or ethnic group.
