
In the past week (June 18 through 24), the U.S. reported about 680,000 new COVID-19 cases, according to the CDC. This amounts to:
- An average of 100,000 new cases each day
- 208 total new cases for every 100,000 Americans
- 6% fewer new cases than last week (June 11-17)
In the past week, the U.S. also reported about 31,000 new COVID-19 patients admitted to hospitals. This amounts to:
- An average of 4,400 new admissions each day
- 9.3 total admissions for every 100,000 Americans
- 1% more new admissions than last week
Additionally, the U.S. reported:
- 1,800 new COVID-19 deaths (0.5 for every 100,000 people)
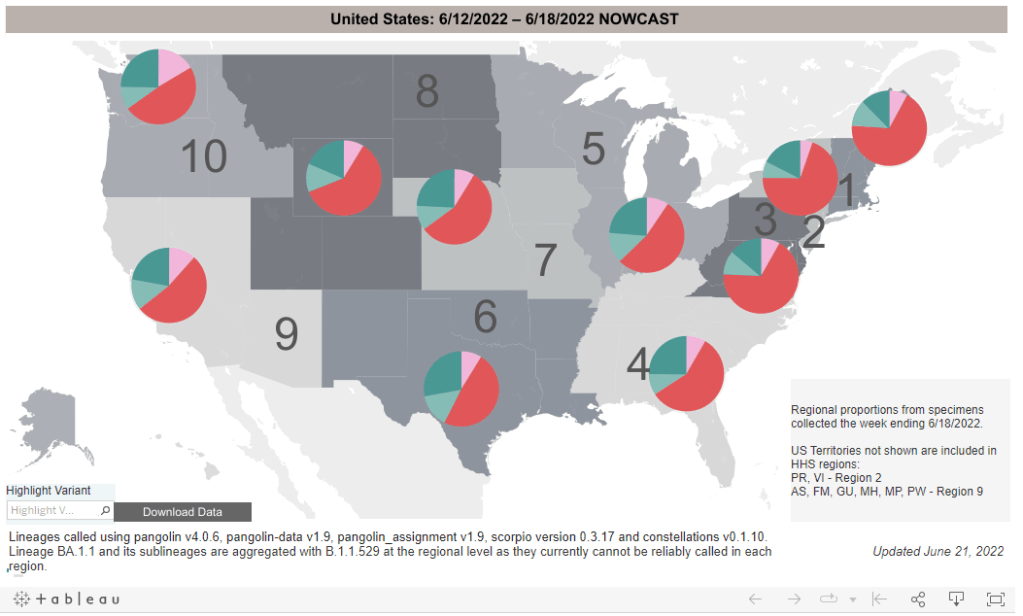
- 56% of new cases are Omicron BA.2.12.1-caused; 35% BA.4/BA.5-caused (as of June 18)
- An average of 50,000 vaccinations per day (per Bloomberg)
America’s Omicron subvariant surge continues to be in a plateau this week, with national COVID-19 case rates, hospitalization rates, and wastewater trends remaining fairly level or showing slight declines.
The U.S. has reported a weekly average between 100,000 and 110,000 new cases a day since mid-May, according to the CDC. These numbers are massive undercounts, as about five times more rapid antigen tests are being conducted in the U.S. than PCR tests, so the true trend is difficult to discern—but we can safely say that there is a lot of coronavirus circulating throughout the country.
New hospital admissions, the number of COVID-19 patients who sought treatment, rose slightly in the last week: about 4,400 patients were admitted each day nationwide, compared to 4,300 last week. Wastewater data from Biobot shows a national plateau, as coronavirus levels drop in the Northeast and West while rising in the South and remaining stagnant in the Midwest.
Why this prolonged plateau? Most likely, the rise of immune-evading Omicron subvariants BA.4 and BA.5 is preventing a BA.2-initiated wave from truly dipping back down. Estimates from the CDC suggest that BA.4 and BA.5 may even be outcompeting BA.2.12.1: the share of U.S. cases caused by BA.2.12.1 dropped for the first time in the CDC’s latest variant prevalence update, from 63% in the week ending June 11 to 56% in the week ending June 18.
Regions with a higher share of BA.4 and BA.5—namely, Gulf Coast states, the Midwest, and the West Coast—are also reporting case increases. A few state hotspots that stick out in the (admittedly, poor) official case counts: Hawaii, Florida, New Mexico, Alaska, and California all reported more than 250 new cases per 100,000 people in the week ending June 22.
In the Northeast, BA.2.12.1 is still causing a majority of cases, but BA.4 and BA.5 are gaining some ground. This may explain why places like New York City are seeing case trends that simply refuse to go down as quickly as we’ve observed in past waves, though a lack of new safety measures is likely also playing a role.
Meanwhile, vaccination rates remain the lowest they’ve been since late 2020. Fewer than 25,000 people received a first vaccine dose in the week ending June 21, according to the CDC. I was expecting to see a bump from children under five finally becoming eligible for vaccination, but it has not shown up in the data yet—likely another signal of current apathy towards COVID-19 safety.

Leave a comment