Blog

  • National numbers, August 15

    National numbers, August 15

    County-level community transmission map from the August 12 Community Profile Report. The vast majority of the country is in the red zone.

    In the past week (August 7 through 13), the U.S. reported about 800,000 new cases, according to the CDC. This amounts to:

    • An average of 114,000 new cases each day
    • 244 total new cases for every 100,000 Americans
    • 18% more new cases than last week (July 31-August 6)

    Last week, America also saw:

    • 71,000 new COVID-19 patients admitted to hospitals (21.5 for every 100,000 people)
    • 3,400 new COVID-19 deaths (1.1 for every 100,000 people)
    • 97% of new cases now Delta-caused (as of August 7)
    • An average of 740,000 vaccinations per day (per Bloomberg)

    COVID-19 cases in the U.S. are now solidly over 100,000 new cases a day, a benchmark not hit since early February. And, per the latest CDC estimates, 97% of those cases are Delta.

    It cannot be overstated how dire the COVID-19 situation has become in southern hotspots. If one is to calculate the cases per capita in all U.S. states and countries of the world, three states make the top five: Louisiana, Florida, and Mississippi.

    In these states, hospitals are filling to a degree not seen since New York City at the beginning of the pandemic. For example, in Brevard County, Florida, local officials are asking residents to avoid calling 911 unless the situation is truly dire. “Leave emergency room and ambulance trips for those with life-threatening or serious emergencies,” the county’s fire chief told CBS News.

    Florida as a whole now has about 14,000 patients in state hospitals, per HHS data. During the winter surge, the state peaked at under 8,000. And more than half of patients in state ICUs are sick with COVID-19. Florida and Texas combined account for over 40% of COVID-19 hospitalizations in the country.

    As this Delta surge progresses, one major challenge may be that not enough Americans are getting tested—especially those who are vaccinated. While the vaccines are very good at protecting against severe disease and death, including from Delta, breakthrough infections have become more common; if these cases are not caught, they can fuel coronavirus spread among the unvaccinated. Overall test positivity in the U.S. has been about 10% for the past two weeks, per HHS data, indicating that we’re missing a lot of those infections. In some southern counties, it’s well above 20%.

    This surge’s silver lining continues: vaccinations are still going up. Almost one million new doses were reported in a single day on Saturday. But vaccination alone is not enough to completely stop COVID-19’s spread, especially when a variant as contagious as Delta has taken the reins.

  • COVID source shout-out: Hawaii schools reporting

    COVID source shout-out: Hawaii schools reporting

    A snippet of Hawaii’s new-and-improved school COVID-19 case reporting. Screenshot taken on August 8.

    As noted in our “Opening” project intro, many states have paused their school COVID-19 case reporting for the summer—and a few have stopped reporting school cases entirely. Hawaii appears to be an exception: this state actually improved its reporting for the new school year.

    Where the state previously just reported total cases for each island (or county) of Hawaii, it’s now reporting cases by individual school. Hawaii also reports the date a case was reported and the last date that the COVID-positive individual was on campus.

    It’s still not perfect; ideally, Hawaii would also give us in-person enrollment or other numbers to contextualize these cases. But it’s a big improvement, useful for both Hawaii public school families and researchers like yours truly. Thanks Hawaii!

  • Featured sources, August 8

    • School enrollment data from Big Local News: Stanford’s Big Local News program released a major dataset this week, allowing reporters to investigate the pandemic’s impact on school enrollment in their communities. The dataset includes enrollment data at the state, district, and school level for 33 states; it was compiled through a collaboration with OpenNews, the New York Times, and EdSource. To access the data, make an account on the Big Local News platform and search for “Stanford School Enrollment Project.” See this tutorial for more information on using the dataset.
    • State-by-state hospitalization trends from the CDC: Last week, the CDC updated its COVID Data Tracker to include vaccination trends for every state. This week, the agency added hospitalization trends for every state, reflecting new COVID-19 admissions both overall and by age group. See the “Select a Jurisdiction” and “Select an Age Group” dropdown menus to explore the data.
    • American Time Use Survey: This is a new survey from the U.S. Bureau of Labor Statistics (BLS). The BLS asked Americans how they spent their time during the COVID-19 pandemic; the resulting data demonstrate trends in remote work, commuting, childcare, and more. See the links at the bottom of this press release for comprehensive stats.
    • Mirror, Mirror 2021 from the Commonwealth Fund: The Commonwealth Fund, a philanthropy foundation supporting healthcare research, published this new report comparing the U.S. healthcare system to those of ten other high-income nations. The report found, unsurprisingly, that the U.S. “ranks last overall, despite spending far more of its gross domestic product on health care.”

  • The case for a moratorium on booster shots

    The case for a moratorium on booster shots

    This week, the World Health Organization (WHO) called for wealthy nations to stop giving out booster shots in a push towards global vaccine equity. 

    These nations should stall any booster shots until at least September, said WHO Director-General Tedros Adhanom Ghebreyesus at a press conference on Wednesday. Instead, excess vaccines should be donated to COVAX, the international vaccine distributor that aims to mitigate COVID-19 in low-income countries. When 10% of the population in every country has been vaccinated, then wealthy countries could resume administering boosters, Tedros said.

    Here’s what he said at the conference (h/t Helen Branswell, STAT News):

    I understand the concern of all governments to protect their people from the Delta variant. But we cannot and we should not accept countries that have already used most of the global supply of vaccine using even more of it while the world’s most vulnerable people remain unprotected.

    It may seem counterintuitive for a country to not provide its citizens with extra protection when it has the means to do so. But the global numbers are staggering. About 50% of the U.S. population has now been fully vaccinated, and we have doses to spare (some of which are going to waste). Meanwhile, in most African countries, 1% or less of the population is vaccinated. This is even though vaccine demand is actually far higher in low-income nations than in the U.S.

    Nature’s Amy Maxmen has a great piece unpacking this inequity. She cites a rather damning WHO analysis:

    An internal analysis from the World Health Organization (WHO) estimates that if the 11 rich countries that are either rolling out boosters or considering it this year were to give the shots to everyone over 50 years old, they would use up roughly 440 million doses of the global supply. If all high-income and upper-middle-income nations were to do the same, the estimate doubles.

    About 3.5 billion people in low- and lower-middle-income countries have yet to be vaccinated, Maxmen estimates. Give one dose to 10% of that number, and you use 350 million doses—less than the 440 million that rich nations would use up with boosters.

    The longer that these low-income countries go without widespread vaccination, the more likely it is that new variants will emerge from their outbreaks. This is because, with every new COVID-19 case, the virus has a new opportunity to mutate. We’re already seeing Delta adapt to become even more transmissible and monitoring other potentially-concerning variants, like Lambda.

    It’s unclear how much power the WHO has to enforce a booster shot moratorium, especially now that some countries (like Israel) have already gotten started on administering these extra shots. And it’s also worth noting that public health officials in the U.S. are shifting away from using “booster” to describe third shots for immunocompromised people or second shots who for those who received the one-and-done Johnson & Johnson vaccine; they say that these shots rather bring patients up to the same immunity levels as those who received two mRNA doses.

    More vaccine reporting

    • Sources and updates, November 12
      Sources and updates for the week of November 12 include new vaccination data, a rapid test receiving FDA approval, treatment guidelines, and more.
    • How is the CDC tracking the latest round of COVID-19 vaccines?
      Following the end of the federal public health emergency in May, the CDC has lost its authority to collect vaccination data from all state and local health agencies that keep immunization records. As a result, the CDC is no longer providing comprehensive vaccination numbers on its COVID-19 dashboards. But we still have some information about this year’s vaccination campaign, thanks to continued CDC efforts as well as reporting by other health agencies and research organizations.
    • Sources and updates, October 8
      Sources and updates for the week of October 8 include new papers about booster shot uptake, at-home tests, and Long COVID symptoms.
    • COVID source shout-out: Novavax’s booster is now available
      This week, the FDA authorized Novavax’s updated COVID-19 vaccine. Here’s why some people are excited to get Novavax’s vaccine this fall, as opposed to Pfizer’s or Moderna’s.
    • COVID-19 vaccine issues: Stories from COVID-19 Data Dispatch readers across the U.S.
      Last week, I asked you, COVID-19 Data Dispatch readers, to send me your stories of challenges you experienced when trying to get this fall’s COVID-19 vaccines. I received 35 responses from readers across the country, demonstrating issues with insurance coverage, pharmacy logistics, and more.
  • A dispatch from Provincetown, Mass.

    A dispatch from Provincetown, Mass.

    Provincetown in June 2006. Source: ingawh via Wikimedia Commons

    Last week, a COVID-19 outbreak in Cape Code, Massachusetts was revealed to be the subject of a major CDC study providing evidence of the Delta variant’s ability to spread through vaccinated individuals. The outbreak quickly became the subject of national headlines, many of them sensationalizing Delta’s breakthrough potential—while failing to provide much context on the people who actually got sick.

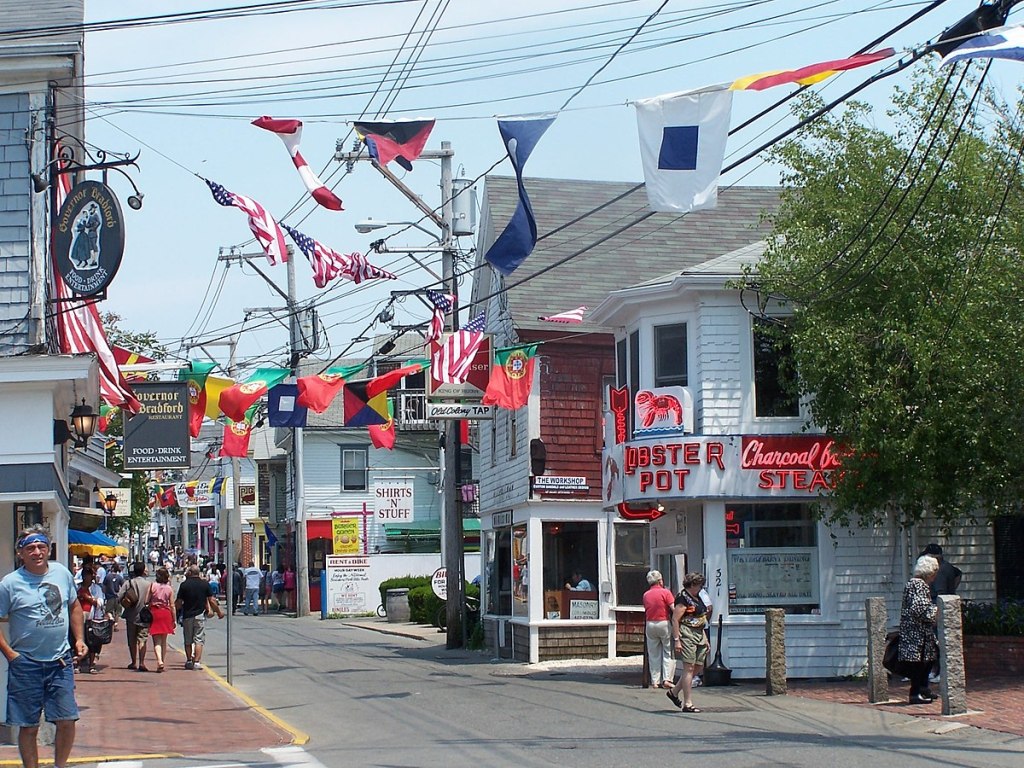
    Here’s one big piece of context. Provincetown, the center of this outbreak, is one of America’s best-known gay communities, and the outbreak took place during Bear Week. Bear Week, for the uninitiated, is a week of parties for gay, bisexual, and otherwise men-loving men who identify as bears—a slang term implying a more masculine appearance, often facial and body hair.

    This week, I had the opportunity to talk to Mike, a Bear Week attendee from Pittsburgh who caught COVID-19 in Provincetown. (Mike asked me to use only his first name to protect his privacy.) He told me about his experience attending parties, getting sick, and learning about the scale of the outbreak.

    We also discussed how Provincetown and the Bear Week community were uniquely poised to identify this outbreak, thanks to a better-than-average local public health department and a group of men who were willing to share their health information with officials.

    The interview below has been lightly edited and condensed for clarity.


    Betsy Ladyzhets: My first question is just like, how are you doing? How have you been after being involved in this outbreak?

    Mike: I’m good… I live in Pittsburgh, I drove back on that Saturday [after the week of Provincetown events] and on Sunday, I started coughing really bad as I was driving home. This just came out of nowhere. I had to pull over, I’m like, yeah, I’m not good. This cough was a lot worse than I had anticipated. So, that was my first symptom. I went into the office Monday after getting home…  My first test was negative, on like Monday or Tuesday. But like, I’m still coughing. I didn’t fully trust it. So I got another one Friday, a PCR test.

    BL: So, you got tested twice? Did you experience contact tracing, or how did you get identified as part of the outbreak?

    M: I mean, I just knew I’d been there. Um, no one reached out but… There was a Facebook group, probably ten or fifteen thousand people in it. Lots of people posted about their test results. Like, people after they were leaving [Provincetown], started quarantining.

    The thing about Provincetown is, there were events that happened in the first week [of July, for July 4] that no one really had time to process… Then Bear Week, the week I went, I went at the busiest week of the year for the town. And it had to be, from a planning perspective, I don’t know that was necessarily the best time to have two huge events back to back.

    All the official events for the week that I went were canceled, though there were some of the regular bars and stuff doing events. There was, at the time, I think one venue that has a mostly outdoor party every day from like three to seven, that was very heavily attended with one or two thousand people every day, mostly outside and it’s possible to distance at. I only ended up going once or twice just because it wasn’t really where I wanted to be regardless of COVID risks, it wasn’t particularly a scene that I was craving at the time.

    I only went to, maybe, three or four indoor things the whole time, and it was without a mask for two or three of them. There’s a bunch of nightclubs in Provincetown that were still having events. And I don’t think that any of the bars themselves that were having events were requiring vaccination cards or anything. One venue that I saw a show at, they announced the next day that they were making either masks or proof of vaccination required. One of the venues that has outdoor events, they just moved all their shows outside instead of inside.

    BL: I see. And you mentioned the Facebook group, was that how you found out that a lot of people were getting tested and things like that?

    M: Yeah, there were somewhere between ten and fifteen thousand people in the group, planning this whole week. People usually come to Provincetown from all over, sometimes from abroad, though I don’t think there were many people coming from abroad this year because of the restrictions.

    BL: How did you learn about the big CDC study getting written about this?

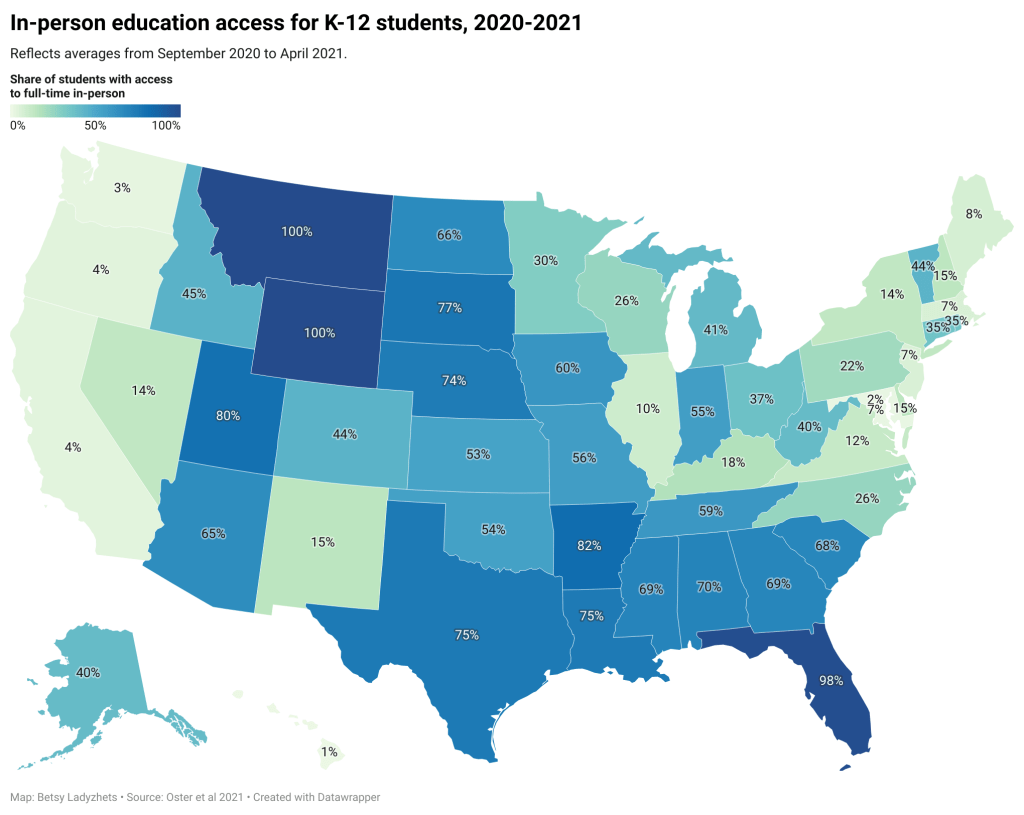
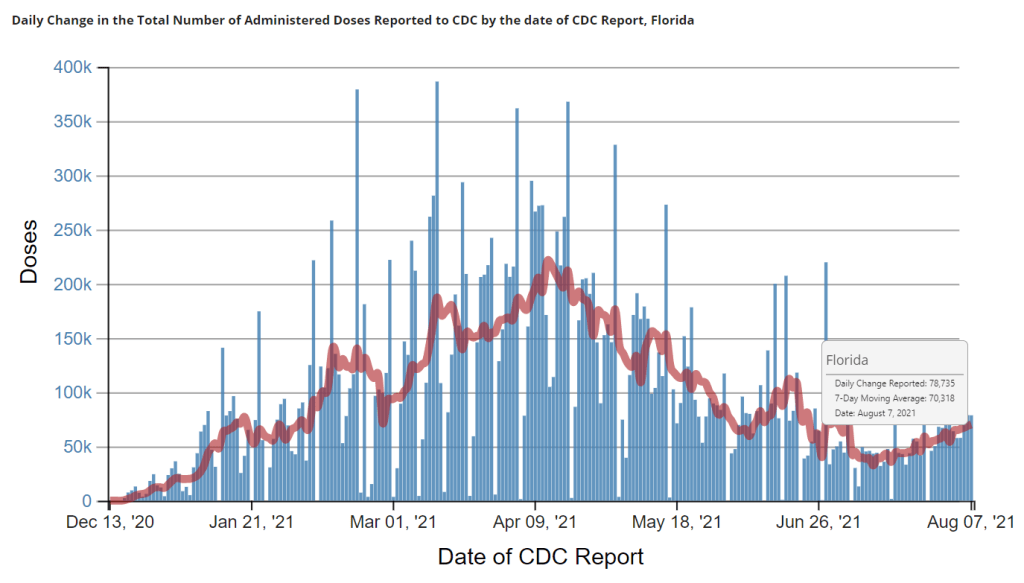
    ML: I didn’t really have any idea until afterwards. There were lots of people in the group saying that Barnstable County, or the Massachusetts Department of Health, wanted to know—they wanted people to call if they’d gotten a positive test so they could keep better track of it. I mean, I think part of why the report was able to happen was that it was in a place with better respect for public health than, like, the state of Florida would have, if this kind of outbreak would’ve happened there.

    B: Yeah, I mean, it definitely seems like they responded quickly. Because I know they had, like, a 15% positivity rate one week, and then within a pretty short time it was back down.

    M: The town itself is a mostly gay, retirement-somewhat community. They can spend lots of money on other things [like public health]. They’re not necessarily spending money on schools because of how many people don’t have any kids around that they need to spend money on. And I mean, there are a lot of residents who live there year-round who tend to be older and are at more risk.

    So the week [Bear Week] itself is unique, and then there was a huge community presence about it, everyone wanted to be—for the most part, we’re comfortable about reporting afterwards. I don’t think anyone knew, walking into this, what it would lead to, but… there’s a feeling of community, and that ten thousand-ish Facebook group, I don’t think we otherwise would have necessary talked to each other or told each other about Massachusetts [public health department] asking people to call if they were positive.

    BL: And did you do that? Did you call them?

    M: Um, I personally didn’t, since I didn’t even find out I was positive until a few days later.

    BL: Now, as you know, this outbreak has gotten a lot of national coverage, it’s been kind of sensationalized, with a lot of people focusing on the vaccine breakthrough cases and stuff like that. I know you were not personally one of the people whose test measurements are included there. But what is that experience like of being part of this thing that has gotten so much national attention?

    M: I posted about it on social media and there were lots of people who were surprised or whatnot. I think, at least in my head, I went in with a calculated risk, of like 10, 20, 30, or more in the ten thousand-ish people coming, a lot of them are traveling on planes. I drove, thinking I’ll come into this place and I think I’ll make okay decisions…

    And there were people in this one place for a whole week, that I guess you were able to test from the CDC’s perspective. I don’t think there are many other places that are as remote as Provincetown where people are staying for the entire week, and everyone generally leaves on the same day, and everyone was in conversation with one another, talking about what happened.


    Related links

  • Opening: Five school districts that kept their communities safe

    Opening: Five school districts that kept their communities safe

    It’s impossible to overstate how controversial school reopening has become in the U.S. this past year. After a spring of universal Zoom school, the country diverged: some administrators, parents, and scientists were determined to get kids back in classrooms, while others prioritized COVID-19 safety above all else.

    Reopening debates have dominated headlines. In August 2020, images of maskless crowds in Georgia’s Cherokee County School District went viral on social media — and the school quarantined hundreds of students just one week after the semester started. That same month In New York City, teachers brought handmade coffins and a guillotine to a protest against Mayor Bill de Blasio’s reopening plan. Chicago’s schools remained closed through the fall, and the teachers union narrowly avoided a strike during reopening negotiations in early 2021. And districts like Brookline, a liberal Massachusetts suburb, saw parents who are health experts feud with teachers over social distancing, vaccinations, and more.

    The divided communities made the news — but not all U.S. schools were fighting grounds. In fact, many districts managed to bring the majority of their students back into classrooms without breeding a dreaded COVID-19 outbreak.

    Here, at the COVID-19 Data Dispatch, we’re sharing stories from five such communities. The series will be published in installments: one profile a week for the next five weeks, followed by a conclusion with overall insights and lessons for fall 2021.

    This project fits into a school of reporting called “solutions journalism.” Rather than focusing on uncovering society’s problems, this type of journalism seeks to identify and uplift responses to these problems. In other words, instead of asking, “Why was it so hard to reopen schools in the U.S?”, the CDD is asking, “Which schools did reopen, and what made them successful?” The Solutions Journalism Network — which, as you may guess from the name, is a nonprofit that supports solutions journalism — provided the CDD with a grant to pursue this project, as well as trainings and other guidance.

    Identifying districts that reopened

    Before introducing you to the five districts that we profiled, let’s talk methodology, also known as how these districts were selected for the project. As we’ve discussed at length here at the CDD, there’s a lack of good data on COVID-19 cases in schools. The country is approaching a fourth pandemic semester, but the federal government still does not provide comprehensive information on how many students are attending public school in person or how many of them have contracted the virus. And while the majority of states provide some data on this topic, these data are scattered and unstandardized — and some states have even gotten worse at their reporting since the 2020-2021 school year ended. 

    So, to identify success stories for this project, we relied on two main sources. First, we used a database which tracks in-person attendance change at school districts across the country, covering approximately 94% of districts across 98% of U.S. counties. These data come from SafeGraph, a company that aggregates location data from cell phones; this database was also used in a March 2021 Nature paper on disparities in school closures. Using the SafeGraph data, we could see which districts had high in-person traffic numbers in spring 2021 compared to shutdowns during spring 2020, indicating that the majority of students returned.

    It’s important to establish here that the aim of this data analysis was not to identify the districts that had the biggest in-person comebacks or to do any kind of comprehensive ranking. Instead, we looked for outliers: districts that had a larger attendance change than the schools around them.

    This geography-based method was important because the 2020-2021 school year looked very different from one state to the next. For example, in New York City, just over one-third of public school families attended school in-person before June 2021, per the New York Times. Meanwhile, in Texas, the majority of schools had at least 70% of students back in-person by spring 2021, according to data from the state department of health.

    !function(){“use strict”;window.addEventListener(“message”,(function(e){if(void 0!==e.data[“datawrapper-height”]){var t=document.querySelectorAll(“iframe”);for(var a in e.data[“datawrapper-height”])for(var r=0;r<t.length;r++){if(t[r].contentWindow===e.source)t[r].style.height=e.data["datawrapper-height"][a]+"px"}}}))}();

    You can see the variation in the map above, based on a study published in the Centers for Disease Control and Prevention’s Morbidity and Mortality Weekly Report earlier this summer. According to this analysis, every single student in Montana and Wyoming had access to in-person learning five days a week, between September 2020 and April 2021, while in Maryland, just 2.3% of students had that access during the same period.

    Comparing COVID-19 case numbers

    After using the SafeGraph dataset to identify outliers in a given state, we used data from state public health departments to identify districts’ COVID-19 case numbers. This step restricted the analysis to states that provided a.) COVID-19 case data by individual district and b.) data for the entire school year. Few states meet both of these criteria. It’s no coincidence that New York and Texas — also the only two states providing in-person enrollment numbers — are both represented among the five focus districts of this project.

    You can find more information on state K-12 data reporting at the CDD’s annotations page here.

    !function(){“use strict”;window.addEventListener(“message”,(function(e){if(void 0!==e.data[“datawrapper-height”]){var t=document.querySelectorAll(“iframe”);for(var a in e.data[“datawrapper-height”])for(var r=0;r<t.length;r++){if(t[r].contentWindow===e.source)t[r].style.height=e.data["datawrapper-height"][a]+"px"}}}))}(); !function(){“use strict”;window.addEventListener(“message”,(function(e){if(void 0!==e.data[“datawrapper-height”]){var t=document.querySelectorAll(“iframe”);for(var a in e.data[“datawrapper-height”])for(var r=0;r<t.length;r++){if(t[r].contentWindow===e.source)t[r].style.height=e.data["datawrapper-height"][a]+"px"}}}))}();

    Over the next few weeks, you’ll learn about how schools from rural Indiana to New York City faced the challenge of bringing kids back to classrooms while keeping their communities safe. Some took advantage of novel COVID-19 technologies, such as tests and ventilation updates. But others utilized less technical strategies such as personalized communication with parents and close collaboration with local public health officials.

    As the Delta variant intensifies reopening challenges for this coming fall, the stories of these five communities tell us that virus cases can be kept down during in-person learning if administrators, teachers, and families all work together.

    These schools are:

    • Scott County School District 1 in Austin, Indiana
    • Garrett County Public Schools in Garrett County, Maryland
    • Andrews Independent School District in Andrews, Texas
    • Brooklyn Arts and Science Elementary School in Brooklyn, New York
    • Port Orford-Langlois School District 2CJ in Curry County, Oregon

    The COVID-19 Data Dispatch’s “Opening” series is available for other publications to republish, free of charge. If you or your outlet is interested in publishing any part of this series, please contact betsy@coviddatadispatch.com.

    Past K-12 schools reporting

    • COVID-19 school data remain sporadic
      On November 18, New York City mayor Bill de Blasio announced that the city’s schools would close until further notice. The NYC schools discrepancy is indicative of an American education system that is still not collecting adequate data on how COVID-19 is impacting classrooms—much less using these data in a consistent manner.
  • National numbers, August 8

    National numbers, August 8

    Daily vaccinations in Florida are rising as the state’s hospitals become overwhelmed with COVID-19 patients. Source: CDC Vaccination Trends.

    In the past week (July 31 through August 6), the U.S. reported about 630,000 new cases, according to the CDC. This amounts to:

    • An average of 90,000 new cases each day
    • 192 total new cases for every 100,000 Americans
    • 34% more new cases than last week (July 24-30)

    Last week, America also saw:

    • 54,000 new COVID-19 patients admitted to hospitals (16.4 for every 100,000 people)
    • 2,600 new COVID-19 deaths (0.8 for every 100,000 people)
    • 93% of new cases now Delta-caused (as of July 31)
    • An average of 700,000 vaccinations per day (per Bloomberg)

    Delta continues to dominate COVID-19 cases in the U.S. The CDC updated its variant estimates this week, reporting that Delta made up 93% of U.S. cases at the end of July.

    This variant has now solidly beat out pretty much every other COVID-19 strain—even the Gamma (or P.1) variant is now down to just 1.3%—reflecting its highly contagious properties. If you missed it, I highly recommend checking out last week’s CDD rundown of key Delta facts and figures.

    COVID-19 hospitalizations and deaths are taking a serious toll on under-vaccinated hotspots in the south. Seven states—Florida, Texas, Missouri, Arkansas, Louisiana, Alabama, and Mississippi—make up about half of recent U.S. cases and hospitalizations, even though they reflect less than a quarter of the country’s total population, White House COVID-19 coordinator Jeff Zients said at a briefing on Thursday. Many hospitals in these states are turning away patients and canceling elective surgeries, as though we’re back in spring 2020.

    Still, there’s some good news in this crisis. As we noted last week, vaccination numbers are rising again, with the states hardest hit by Delta leading the pack. In Florida, for example, average daily vaccinations are up from 40,000 on July 7 to 70,000 on August 7. CVS and Walgreens are reporting vaccination upticks as well. And, as of Friday, over half of the U.S. population is now fully vaccinated.

    According to new polling data from KFF’s COVID-19 Vaccine Monitor, Delta is indeed a vaccination motivator. About one in five unvaccinated adults surveyed in KFF’s July poll said that COVID-19 variant news “has made them more likely to get vaccinated for COVID-19.” Still, many more people need convincing: the poll found that over half of vaccinated adults erroneously believe a COVID-19 vaccine poses a higher health risk than the virus itself.

    It’s tragic that thousands more would need to die for many Americans to finally get their shots. But every vaccination may potentially be a life saved.

  • COVID source callout: States go dark on prison case numbers

    COVID source callout: States go dark on prison case numbers

    State agencies have scaled down reporting on COVID-19 cases in prisons. Figure from UCLA COVID Behind Bars.

    We’ve noted in recent months that several states have scaled down their COVID-19 reporting: states are providing fewer metrics, updating their dashboards less frequently, or both. For example, Florida switched from a dashboard and daily PDF reports to weekly reports with much less information.

    According to the UCLA COVID Behind Bars data project, these changes are also hitting state carceral agencies—responsible for reporting COVID-19 cases in prisons and jails—right as Delta causes new outbreaks in these facilities. 

    Four agencies have stopped reporting these data altogether: state agencies in Florida, Georgia, and Massachusetts along with the Texas Commission on Jail Standards. Several other states haven’t updated their public data in over a month, including Rhode Island, New Jersey, Montana, and Alaska.

    “Carceral agencies are responsible for the care of those in their custody, and, at a bare minimum, these agencies must track and report on COVID-19 cases and deaths in their facilities, regardless of the number of cases,” researchers from the UCLA project wrote in a recent blog post. “The fact that many are no longer doing so, or are doing so less frequently, is especially concerning given that the Delta variant is circulating rapidly around the country.”

    The UCLA researchers say that these data reductions come as new outbreaks hit prisons in Delta hotspots: “Prisons in Texas and Missouri, for example, have seen a 500% increase in the number of active cases over the month of July.” Many prison residents and staffers are not vaccinated, leaving them vulnerable to the variant.

    Right now, we need more information on COVID-19 in these facilities, not less.

  • Featured sources, August 1

    • State-by-state vaccination trends from the CDC: The CDC’s COVID Data Tracker has a new feature, added on July 29: you can now see vaccination trends for every state. On the Vaccination Trends page, use the “Select a Location” dropdown menu to pick a specific state or territory, then check out day-by-day numbers and rolling averages for doses administered and people newly vaccinated in that region. You can also download the state’s time series data from a table underneath the chart.
    • COVID-19 Vaccine Breakthrough Cases: Data from the States (KFF): Looking to see how your state reports vaccine breakthrough cases? The Kaiser Family Foundation has you covered with this dashboard, including data and annotations from every state that reports breakthroughs. This resource was published on July 30; it’s unclear whether KFF intends to update it in the coming weeks.
    • Poverty and Access to Internet, by County: Internet access has been a major issue during the pandemic as workplaces and schools have gone remote. This newly-updated dataset from the HHS Agency for Healthcare Research and Quality provides information on internet and cellular access in every U.S. county from 2014 to 2018.

  • Vaccine requirements are the next big strategy

    After vaccine incentives largely failed to drive up vaccination numbers, government agencies and corporations alike are now opting for requirements. Hundreds of thousands of Americans learned this week that, in order to keep their jobs, they need to get their shots—or go through a more arduous process like weekly COVID-19 testing.

    Here are the major mandates I saw announced this week, and how many people are impacted by each one. 

    • All city workers in NYC: 340,000 municipal workers in the city will need to get vaccinated or tested weekly. This includes teachers, police, and firefighters; a previous NYC guidance (announced last week) focused on public health workers. Staffers in nursing homes and other congregate care settings need to be vaccinated by August 16, while other workers need to do it by September 13—the first day of school in NYC this fall.
    • All state workers in California: A few hours after the NYC requirement was announced, California governor Gavin Newsom said that all CA state employees will similarly need to get vaccinated or opt into weekly testing. This applies to about 246,000 state employees and an undetermined number of healthcare workers, according to the New York Times.
    • All frontline workers in the Department of Veterans Affairs (VA): Also on Monday, the VA announced that all healthcare workers in VA facilities need to get vaccinated, along with facilities staff and others on the frontlines of patient care. Employees have eight weeks to get fully vaccinated, or may face consequences including potential firing. This applies to about 115,000 workers.
    • All Disney employees: Disney is requiring vaccinations for all salaried and non-union employees. Those who haven’t gotten their shots yet have 60 days to do so, and new hires need to be fully vaccinated before starting work. It’s unclear from the company’s announcement if Disney workers will get a testing option or what the consequences for remaining unvaccinated may be. Disney employs over 200,000 people.
    • All Walmart employees: Walmart, the largest retailer in the U.S., is requiring all U.S.-based corporate employees to be vaccinated by October 4. This doesn’t include workers in Walmart stores, but those workers are strongly encouraged to get their shots as well—and will get a $150 bonus upon vaccination. Walmart employs about 1.5 million people in the U.S., in total.
    • All Google employees: Alphabet CEO Sundar Pichai announced Google’s new policy on Wednesday: anyone coming back to work at a Google campus must be vaccinated. The policy is starting in the U.S., but will be expanded to the rest of the world as well; Google employs over 100,000 people globally.
    • Netflix actors and crew: Netflix is requiring all actors and crew in close contact with those actors to get vaccinated in order to come on set. Some have called for the requirement to be expanded to everyone at the company. The company employed about 9,400 full-time workers in 2020; it’s unclear how many will be impacted by the requirement.
    • Shake Shack workers and customers: The franchise’s founder and CEO announced Shake Shack’s requirement on Thursday, saying it would apply to full-service restaurants in NYC and Washington, D.C. While this requirement impacts far fewer workers than others in this list, it’s unique in that workers aren’t the only ones who need to be vaccinated: any customer hoping to dine in a Shake Shack needs proof of vaccination, too.

    It’s unclear how much of a dent these mandates will make in overall vaccination numbers over the next few weeks. But surveys from KFF and others have suggested that, for many Americans, a vaccination requirement may be the last push they need to get their shots.