It’s impossible to overstate how controversial school reopening has become in the U.S. this past year. After a spring of universal Zoom school, the country diverged: some administrators, parents, and scientists were determined to get kids back in classrooms, while others prioritized COVID-19 safety above all else.
Reopening debates have dominated headlines. In August 2020, images of maskless crowds in Georgia’s Cherokee County School District went viral on social media — and the school quarantined hundreds of students just one week after the semester started. That same month In New York City, teachers brought handmade coffins and a guillotine to a protest against Mayor Bill de Blasio’s reopening plan. Chicago’s schools remained closed through the fall, and the teachers union narrowly avoided a strike during reopening negotiations in early 2021. And districts like Brookline, a liberal Massachusetts suburb, saw parents who are health experts feud with teachers over social distancing, vaccinations, and more.
The divided communities made the news — but not all U.S. schools were fighting grounds. In fact, many districts managed to bring the majority of their students back into classrooms without breeding a dreaded COVID-19 outbreak.
Here, at the COVID-19 Data Dispatch, we’re sharing stories from five such communities. The series will be published in installments: one profile a week for the next five weeks, followed by a conclusion with overall insights and lessons for fall 2021.
This project fits into a school of reporting called “solutions journalism.” Rather than focusing on uncovering society’s problems, this type of journalism seeks to identify and uplift responses to these problems. In other words, instead of asking, “Why was it so hard to reopen schools in the U.S?”, the CDD is asking, “Which schools did reopen, and what made them successful?” The Solutions Journalism Network — which, as you may guess from the name, is a nonprofit that supports solutions journalism — provided the CDD with a grant to pursue this project, as well as trainings and other guidance.
Identifying districts that reopened
Before introducing you to the five districts that we profiled, let’s talk methodology, also known as how these districts were selected for the project. As we’ve discussed at length here at the CDD, there’s a lack of good data on COVID-19 cases in schools. The country is approaching a fourth pandemic semester, but the federal government still does not provide comprehensive information on how many students are attending public school in person or how many of them have contracted the virus. And while the majority of states provide some data on this topic, these data are scattered and unstandardized — and some states have even gotten worse at their reporting since the 2020-2021 school year ended.
So, to identify success stories for this project, we relied on two main sources. First, we used a database which tracks in-person attendance change at school districts across the country, covering approximately 94% of districts across 98% of U.S. counties. These data come from SafeGraph, a company that aggregates location data from cell phones; this database was also used in a March 2021 Nature paper on disparities in school closures. Using the SafeGraph data, we could see which districts had high in-person traffic numbers in spring 2021 compared to shutdowns during spring 2020, indicating that the majority of students returned.
It’s important to establish here that the aim of this data analysis was not to identify the districts that had the biggest in-person comebacks or to do any kind of comprehensive ranking. Instead, we looked for outliers: districts that had a larger attendance change than the schools around them.
This geography-based method was important because the 2020-2021 school year looked very different from one state to the next. For example, in New York City, just over one-third of public school families attended school in-person before June 2021, per the New York Times. Meanwhile, in Texas, the majority of schools had at least 70% of students back in-person by spring 2021, according to data from the state department of health.
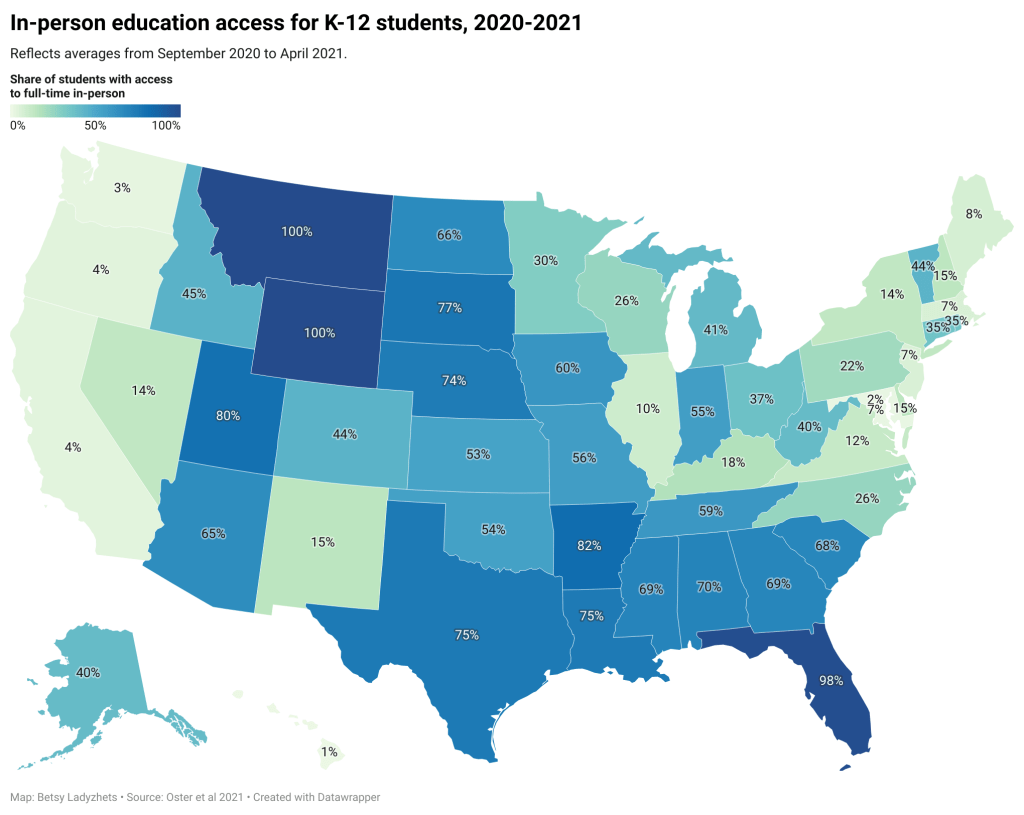
!function(){“use strict”;window.addEventListener(“message”,(function(e){if(void 0!==e.data[“datawrapper-height”]){var t=document.querySelectorAll(“iframe”);for(var a in e.data[“datawrapper-height”])for(var r=0;r<t.length;r++){if(t[r].contentWindow===e.source)t[r].style.height=e.data["datawrapper-height"][a]+"px"}}}))}();You can see the variation in the map above, based on a study published in the Centers for Disease Control and Prevention’s Morbidity and Mortality Weekly Report earlier this summer. According to this analysis, every single student in Montana and Wyoming had access to in-person learning five days a week, between September 2020 and April 2021, while in Maryland, just 2.3% of students had that access during the same period.
Comparing COVID-19 case numbers
After using the SafeGraph dataset to identify outliers in a given state, we used data from state public health departments to identify districts’ COVID-19 case numbers. This step restricted the analysis to states that provided a.) COVID-19 case data by individual district and b.) data for the entire school year. Few states meet both of these criteria. It’s no coincidence that New York and Texas — also the only two states providing in-person enrollment numbers — are both represented among the five focus districts of this project.
You can find more information on state K-12 data reporting at the CDD’s annotations page here.
!function(){“use strict”;window.addEventListener(“message”,(function(e){if(void 0!==e.data[“datawrapper-height”]){var t=document.querySelectorAll(“iframe”);for(var a in e.data[“datawrapper-height”])for(var r=0;r<t.length;r++){if(t[r].contentWindow===e.source)t[r].style.height=e.data["datawrapper-height"][a]+"px"}}}))}(); !function(){“use strict”;window.addEventListener(“message”,(function(e){if(void 0!==e.data[“datawrapper-height”]){var t=document.querySelectorAll(“iframe”);for(var a in e.data[“datawrapper-height”])for(var r=0;r<t.length;r++){if(t[r].contentWindow===e.source)t[r].style.height=e.data["datawrapper-height"][a]+"px"}}}))}();Over the next few weeks, you’ll learn about how schools from rural Indiana to New York City faced the challenge of bringing kids back to classrooms while keeping their communities safe. Some took advantage of novel COVID-19 technologies, such as tests and ventilation updates. But others utilized less technical strategies such as personalized communication with parents and close collaboration with local public health officials.
As the Delta variant intensifies reopening challenges for this coming fall, the stories of these five communities tell us that virus cases can be kept down during in-person learning if administrators, teachers, and families all work together.
These schools are:
- Scott County School District 1 in Austin, Indiana
- Garrett County Public Schools in Garrett County, Maryland
- Andrews Independent School District in Andrews, Texas
- Brooklyn Arts and Science Elementary School in Brooklyn, New York
- Port Orford-Langlois School District 2CJ in Curry County, Oregon
The COVID-19 Data Dispatch’s “Opening” series is available for other publications to republish, free of charge. If you or your outlet is interested in publishing any part of this series, please contact betsy@coviddatadispatch.com.
Past K-12 schools reporting
- COVID-19 school data remain sporadicOn November 18, New York City mayor Bill de Blasio announced that the city’s schools would close until further notice. The NYC schools discrepancy is indicative of an American education system that is still not collecting adequate data on how COVID-19 is impacting classrooms—much less using these data in a consistent manner.

Leave a comment