Blog

  • National numbers, August 29

    National numbers, August 29

    Delta is causing 99% or a higher share of new cases in every region of the U.S., according to CDC estimates.

    In the past week (August 21 through 27), the U.S. reported about one million new cases, according to the CDC. This amounts to:

    • An average of 142,000 new cases each day
    • 303 total new cases for every 100,000 Americans
    • 3% more new cases than last week (August 14-20)

    Last week, America also saw:

    • 86,000 new COVID-19 patients admitted to hospitals (26 for every 100,000 people)
    • 6,000 new COVID-19 deaths (1.8 for every 100,000 people)
    • 99% of new cases now Delta-caused (as of August 21)
    • An average of 900,000 vaccinations per day (per Bloomberg)

    COVID-19 cases in the U.S. just keep rising, approaching 150,000 new cases a day. Case numbers have not been this high since January, during the winter surge. The case rise does seem to be decelerating, however: cases are only up 3% this week compared to last week, after much higher jumps in late July and early August.

    It’s worth emphasizing here that, per the CDC’s latest estimates, a full 99% of new COVID-19 cases in the U.S. are driven by Delta. Alpha, the variant we were all so worried about back in the spring, is down to just 0.2% of cases. On a practical level, that means anywhere you may encounter the coronavirus—at a restaurant, on the train, at an elementary school—this virus is highly transmissible, capable of spreading between unvaccinated people in just a few seconds.

    Florida and Louisiana continue to be major COVID-19 hotspots, but Mississippi is now seeing the country’s highest case numbers—753 cases per 100,000 residents in the past week, per Friday’s Community Profile Report. Kentucky, South Carolina, Georgia, Alabama, and Arkansas all recorded over 500 cases per 100,000 last week as well. Hurricane Ida, now on track to hit New Orleans, is sure to complicate COVID-19 prevention efforts in Louisiana and other coastal states.

    While the South lights up with record cases and hospitalizations, every single state is currently seeing high coronavirus transmission, according to the CDC’s categories (over 100 new cases per 100,000 in the past week and/or test positivity over 10%). Almost every county is in the red as well.

    Almost 90,000 Americans are in the hospital with COVID-19 right now, about three-quarters of the way to last winter’s peak. While vaccinations continue to increase, we’ll need more mitigation than just shots in arms to control this current surge.

  • Featured sources, August 22

    • State Guidance on School Reopenings, CRPE: The Center on Reinventing Public Education (CRPE) is an education research organization focused on improving student outcomes. The organization has compiled and analyzed state guidance for school reopening in fall 2020, focusing on mask mandates and vaccination requirements. Read about their findings here.
    • Will Students Come Back?: July 2021 Parent Survey: The RAND Corporation, a survey company, has a new report out this week displaying parent attitudes towards fall reopening. According to the survey, as of July 2021, 89% of U.S. parents are planning to send their kids back to school in person. This number is higher for white (94%) and Asian (88%) parents than Black (82%) and Hispanic (83%) parents.
    • COVID Stimulus Watch: The policy resource center Good Jobs First has put together this extensive database of CARES Act funding recipients. You can search the database by federal agency, CARES Act program, business sector, company type, location, amount received, and whether the money has been refunded.
    • Body Politic’s Comprehensive Guide to Covering Long COVID: Writer and long COVID advocate Fiona Lowenstein has written this guide to covering the prolonged condition. The guide includes long COVID’s history, key terms, finding experts, telling patient stories, and more. Lowenstein shares key insights from the guide in this Center for Health Journalism article.
    • Update on Bloomberg’s Vaccine Tracker: After nine months of manual data updates, the team behind Bloomberg’s COVID-19 vaccine tracker is switching to automated data capture from the World Health Organization, Johns Hopkins, and other sources. Or, as health editor Drew Armstrong put it on Twitter: “We’re finally ready to let the robots take over.” Thank you, Bloomberg team, for your months of hard work!

  • U.S. moves to approve booster shots despite minimal evidence

    U.S. moves to approve booster shots despite minimal evidence

    Timeline of the scientific results and policy moves leading up to Wednesday’s announcement. Chart via Your Local Epidemiologist.

    This week, the federal government announced that the U.S. intends to provide third vaccine doses to all Americans who received the Pfizer or Moderna vaccines. This booster shot distribution will start in September, with adults becoming eligible once they hit eight months after their second shot.

    While the booster shot regimen still must be approved by the FDA and CDC, federal officials are making it sound like a pretty sure thing—President Biden himself announced the decision at a press conference on Wednesday. However, many epidemiologists, vaccine experts, global health experts, and other scientists have criticized the decision.

    Here are three main criticisms I’ve seen in the past few days.

    First: Scientific evidence is lacking. As the booster shot decision was announced on Wednesday, the CDC published three new studies that appear to show a decline in the Pfizer and Moderna vaccines’ ability to stave off symptomatic COVID-19 infection after several months. One of these reports, from a network of U.S. nursing homes, suggests that efficacy among nursing home residents fell to just 53% by June and July 2021, many months after this vulnerable population was vaccinated. The other two reports show similar declines, though the CDC found that vaccination remains effective against severe disease, hospitalization, and death.

    The federal government—and others arguing in favor of booster shots—have also pointed to data from Israel, which appear to similarly demonstrate that the vaccines lose their effectiveness after several months. In Israel, where almost 80% of residents over age 12 are vaccinated, the majority of those hospitalized with COVID-19 are now fully vaccinated individuals.

    But the act of interpreting these data is more complicated than it first appears. In a blog post at COVID-19 Data Science, biostatistics professor Jeffrey Morris explains that, when the majority of a population is vaccinated, vaccination numbers will go up in this population simply because they are the majority. But the risk remains far higher for the unvaccinated. Plus, Morris explains, stratifying hospitalization numbers by age reveals that older adults are more likely to have a severe COVID-19 case regardless of vaccination status, while younger adults are less likely to be vaccinated (and thus have a non-breakthrough case).

    Simply put, the vaccines do still work well against severe COVID-19—you just need to be precise in calculating effectiveness. And yet, the U.S. government is saying that vaccine efficacy wanes so much, everyone’s going to need a third shot in the fall or early next year. This suggests that the federal government has more data that it is not sharing publicly, which leads us to the second criticism.

    Second: Transparency is also lacking. Typically, when the government makes a decision about approving a new medical product, this decision follows a series of prescribed steps: data submission from the company behind the product, review by FDA scientists, FDA approval, followed by more review by other agencies (such as the CDC or the Centers for Medicare & Medicaid Services) as needed. Review meetings are typically open to the public, with data shared in advance of a decision. In the case of these booster shots, however, the president has announced a specific rollout plan before full scientific review has taken place.

    As STAT’s Helen Branswell explains:

    To many experts, including Baylor, the sequencing of the decisions being made is also out of whack. While U.S. health officials said booster shots could start being offered the week of Sept. 20, the Food and Drug Administration has not even ruled yet on Pfizer’s application for approval of a third shot; it was filed only Monday. Moderna hasn’t yet asked the agency to authorize a third shot at all.

    Plus, remember that the CDC has not publicly shared any comprehensive data on breakthrough cases since the spring, before Delta became dominant.

    The FDA and CDC will certainly still be reviewing the need for booster shots, but the experts cited in Branswell’s piece are skeptical that any decision other than, “Yes, go ahead” will be considered. I, for one, will be very curious to see how the discussions proceed—and what data get cited—at the FDA and CDC committee meetings.  

    Third: We need to vaccinate the world. As I’ve explained in the CDD before, getting vaccines to the low-income nations that have yet to start their rollouts is not just a humanitarian priority. It also protects us, here in the U.S., because the longer the coronavirus circulates, the more opportunities it has to mutate into increasingly-dangerous variants.

    By moving to provide booster shots to everyone—not just the immunocompromised, the elderly, or the otherwise extra-vulnerable—the U.S. is likely delaying shots to other countries, prolonging the pandemic overall.

    As Dr. Michael Ryan, emergencies chief at the World Health Organization, told reporters last week: “We’re planning to hand out extra life jackets to people who already have life jackets, while we’re leaving other people to drown without a single life jacket.”

    More vaccine news

    • Sources and updates, November 12
      Sources and updates for the week of November 12 include new vaccination data, a rapid test receiving FDA approval, treatment guidelines, and more.
    • How is the CDC tracking the latest round of COVID-19 vaccines?
      Following the end of the federal public health emergency in May, the CDC has lost its authority to collect vaccination data from all state and local health agencies that keep immunization records. As a result, the CDC is no longer providing comprehensive vaccination numbers on its COVID-19 dashboards. But we still have some information about this year’s vaccination campaign, thanks to continued CDC efforts as well as reporting by other health agencies and research organizations.
    • Sources and updates, October 8
      Sources and updates for the week of October 8 include new papers about booster shot uptake, at-home tests, and Long COVID symptoms.
    • COVID source shout-out: Novavax’s booster is now available
      This week, the FDA authorized Novavax’s updated COVID-19 vaccine. Here’s why some people are excited to get Novavax’s vaccine this fall, as opposed to Pfizer’s or Moderna’s.
    • COVID-19 vaccine issues: Stories from COVID-19 Data Dispatch readers across the U.S.
      Last week, I asked you, COVID-19 Data Dispatch readers, to send me your stories of challenges you experienced when trying to get this fall’s COVID-19 vaccines. I received 35 responses from readers across the country, demonstrating issues with insurance coverage, pharmacy logistics, and more.
  • Opening profile: Community over wifi in Garrett County, Maryland

    Opening profile: Community over wifi in Garrett County, Maryland

    By Betsy Ladyzhets

    Staff at Broad Ford Elementary School in Garrett County, Maryland. Photo via the district’s website.

    It’s difficult to get good internet access in Garrett County, Maryland. The county lies in the Appalachian Mountains, full of peaks and ridges, trees and rivers. This geography blocks signals and slows internet speeds, even for Garrett County residents who do have a router at home. And the county’s southern edge meets the National Radio Quiet Zone, where cell and internet service is restricted in order to preserve data collection for West Virginia’s Green Bank Telescope.

    Even Barbara Baker, superintendent of Garrett County Public Schools, has a hard time getting service: During her interview with the COVID-19 Data Dispatch, poor Zoom quality forced the conversation onto a phone call.

    “Working from home, teaching from home, and learning from home was a huge hurdle for us to overcome,” Baker said.

    Of course, such a wifi-challenged district is not cut out for virtual classes, making in-person school a priority. Unlike other districts in Maryland, Garrett County Public Schools was able to bring the majority of its students back to classrooms during the spring 2021 semester. The district built trust with its community by utilizing local partnerships, providing families with crucial supplies, setting up task forces to plan reopening, and communicating extensively with parents.

    Garrett County’s school district is the subject of the second profile in the COVID-19 Data Dispatch’s “Opening” series. Alongside four other school communities, we selected it because the majority of the district’s students returned to in-person learning during the 2020-2021 school year — and officials identified COVID-19 cases in under 5% of the student population. (According to the CDC, about 5% of school-aged children in the U.S. have contracted COVID-19 since the start of the pandemic.)

    Demographics for Garrett County, Maryland
    Census population estimates, July 2019

    • Population: 29,000
    • Race: 96.2% white, 1.2% Hispanic/Latino, 1.1% Black, 1.0% two or more races, 0.4% Asian
    • Education: 89.8% have high school degree, 20.9% have bachelor’s degree
    • Income: $52,600 is median household income, 12.8% in poverty
    • Computer: 84.6% have a computer, 76.9% have broadband internet
    • Free lunch: 47.8% of students eligible for free or reduced-price lunch1

    COVID-19 stats for Garrett County Public Schools

    • Total enrollment: 3,600 students2
    • In-person enrollment: 86% after reopening for a four-day week in March2
    • Total cases, 2020-2021 school year:
      • 5 cases in the fall (identified by the state in two elementary school outbreaks)3
      • 17 cases in the spring (15 rapid test positives, 2 PCR test positives); none identified by the state as outbreaks4

    1Source: National Center for Education Statistics
    2Source: Interview with Superintendent Barbara Baker
    3Source: Maryland COVID-19 School Outbreaks dataset
    4Source: Data from School Health Services Manager Rebecca Aiken


    Spring 2020: Combatting remote challenges, in-person preparation

    Due to wifi issues and a learning curve with the district’s online platform, in spring 2020, Garrett County families and educators struggled to access remote classes. But the district used this time to prepare for its eventual return by providing computers, tablets, and wifi hotspots resources to students and building trust for the next year.

    The district used a federal grant to purchase about 1,000 wifi hotspots, which were both distributed to students and set up in central locations to which families could easily drive. At a total of 650 square miles, Garrett County is relatively large, and with under 50 people per square mile, its residents are fairly spaced out. Administrators aimed to set up hotspots in enough locations that nobody would need to drive more than ten miles to access wifi.

    At the same time, district staff delivered meals to families. About half of Garrett County students are eligible for free lunch, according to the National Center for Education Statistics. Scott Germain, the district’s food services supervisor, quickly pivoted from cafeteria meals to meals on the road. His team brought food from the district’s twelve schools to churches, community centers, and other central locations so that families could avoid traveling more than a few miles.

    Like many other districts, Garrett County took advantage of federal grant money to improve ventilation and cleaning at school buildings. But unlike others, this district stands out for a unique, collaborative strategy used to plan its return to classrooms in fall 2020. 

    The district brought stakeholders together through “TIGER teams”, or “Targeted Immediate Group Execution and Response” teams. Each team was composed of people from varied backgrounds, all unified around a singular reopening-related goal, such as COVID-19 testing and learning connectivity. Teams typically included at least one parent, one community member, and one doctor, health department officer, or other relevant expert.

    Similarly to Austin, Indiana, partnerships between the school district and the local public health department proved crucial in reopening. While school buildings were closed in spring 2020, the district’s nursing staff worked with the Garrett County public health department to run testing sites.

    “We just became one agency, almost, for a while,” said School Health Services Manager Rebecca Aiken of the school’s nursing staff and the local health department. School nurses were able to expertly swab students who came to class with COVID-19 symptoms when classrooms opened up in the fall.

    Fall 2020: Hybrid, then back to virtual

    The fall 2020 semester started with a hybrid model, due to concerns about maintaining six-foot spacing between students in every classroom. Most students were coming in for two days in person, while Wednesday was reserved as a day where children worked remotely on their own, giving teachers extra prep time. A small number of students opted to stay all-remote and another small number, identified by the district as most likely to fall behind during remote learning, came in all four days. (Precise numbers are not available, but administrators estimate that 10% to 15% were in all four days during this time.)

    During the hybrid period, the state of Maryland identified two small outbreaks at Garrett County schools. The state defines a classroom outbreak as at least two confirmed COVID-19 cases among teachers, students, and staff within a two-week period; cases must be epidemiologically linked but not within the same household. Maryland data reveal two cases at Route 40 Elementary School and three at Yough Glades Elementary School, from October to December.

    Despite these relatively low case numbers, the hybrid model was short-lived: Rising cases in Maryland forced the district to return to virtual-only learning in November. Still, the district was better prepared this time. More students had computers and wifi, and teachers and families were familiar with the district’s online platform.

    That return to remote made administrators even more determined to bring students back in the spring. In January, Maryland governor Larry Hogan ordered all school systems to bring kids back to at least hybrid instruction by March 1; this order “gave a little bit of teeth” to Garrett County school leadership, Superintendent Baker said.

    Spring 2021: Communication and trust

    By March 1, Garrett County students were back in classrooms four days a week. Wednesday remained an asynchronous preparation day for teachers, most of whom still had a small number of remote-only students in their classes.

    Feedback from teachers informed that schedule, but the district also actively solicited — and responded to — feedback from parents. Administrators collected feedback through surveys, and principals made personal phone calls to check in on parents. Questions from parents were funneled into a detailed FAQ document on the district’s website; the document currently stands at 22 pages long and was, at times, updated multiple times a day.

    “[Parents knew] we were listening, that we knew that they had questions and that we were trying to answer them to the best of our ability,” Baker said.

    Garrett County Public Schools FAQ document. Screenshot retrieved on August 22.

    This detailed attention to parent feedback — combined with the trust built up by providing technology, food, and other services — may be one reason why Garrett County bucks Maryland’s overall trend in bringing students back to classrooms. According to a study published in the Centers for Disease Control and Prevention’s Morbidity and Mortality Weekly Report, over three-quarters of Maryland K-12 students only had access to fully remote learning during the 2020-2021 school year. In Garrett County, though one day remained remote, 86% of students returned to almost-full-time in-person learning by the end of the spring semester.

    “I think it was a real testament to the fact that the families trusted that we would keep their children safe, that we would put the safety protocols into place,” Baker said.

    Indeed, between late March and early May this year, only 17 students and staffers tested positive for COVID-19 in the schools, well under one percent of the district population. These numbers do not reflect all cases in the district, according to Aiken, head of school health services, because some students were not tested through the school. She said that all of these students were infected outside the school setting — at part-time jobs, social gatherings, and other community functions — and quick contact tracing through the local health department helped prevent spread at schools themselves.

    On Sept. 7 this year, all Garrett County students will be back in the classroom, all five days a week. As the fall safety plan currently stands, masks are strongly recommended (though not required), but enhanced ventilation, three feet distancing, testing, and other protocols will continue. Additional precautions may be added before the school year starts, Chief Academic Officer Nicole Miller said in an email on August 18.

    Principals prepared for the transition by once again calling parents to have one-on-one conversations about their concerns, with a focus on the families who chose remote learning last spring. The health services team prepared with vaccination clinics for students and staff; the vast majority of school staff (92% as of late July) are vaccinated already, thanks in part to similar clinics in the spring. Administrators also continue to update their FAQ document, solicit feedback, and build trust with their community — building connections where wireless internet networks have failed.

    “We had the collaboration, and we had the connections, and we had the framework built before this happened,” Aiken said. “I think that’s what made [reopening] so successful.”


    The COVID-19 Data Dispatch’s “Opening” series is available for other publications to republish, free of charge. If you or your outlet is interested in publishing any part of this series, please contact betsy@coviddatadispatch.com.

    More from the Opening series

  • National numbers, August 22

    National numbers, August 22

    Every state in the country has high community transmission except for Maine and Vermont, which have substantial transmission. Chart from the CDC.

    In the past week (August 14 through 20), the U.S. reported about 930,000 new cases, according to the CDC. This amounts to:

    • An average of 133,000 new cases each day
    • 284 total new cases for every 100,000 Americans
    • 14% more new cases than last week (August 7-13)

    Last week, America also saw:

    • 81,000 new COVID-19 patients admitted to hospitals (25 for every 100,000 people)
    • 4,500 new COVID-19 deaths (1.4 for every 100,000 people)
    • 99% of new cases now Delta-caused (as of August 14)
    • An average of 840,000 vaccinations per day (per Bloomberg)

    COVID-19 cases continue to rise, with the U.S. seeing almost one million new cases this week (or more than one million, according to some non-CDC trackers). Deaths are also increasing, up 11% from last week and up almost 200% from late July. The vast majority of these deaths continue to occur in unvaccinated Americans.

    In the South, hospitals are becoming overwhelmed—to a degree reminiscent of March 2020 in New York City. Seven states have seen more than 20 new COVID-19 patients entering the hospital for every 100,000 residents in the past week: Florida, Georgia, Alabama, Louisiana, Kentucky, Oklahoma, and Texas. In Florida, that number is over 30 new patients for every 100,000.

    Children are accounting for a higher share of COVID-19 hospitalizations than at any previous point in the pandemic. Overall, last week, the U.S. saw four new COVID-19 patients under age 17 enter the hospital for every million children. In Florida, that number is about 12 for every million.

    Still, even parts of the country without overflowing hospitals are seeing concerning case rises. The CDC now designates almost every state as “high transmission,” with over 100 new cases for every 100,000 residents and/or over a 10% test positivity rate. The only two states that don’t fit this category, Maine and Vermont, both have “substantial transmission.”

    Vaccinations continue to slowly tick up: more than one million Americans were vaccinated for three days in a row this week, and 60% of the eligible population is now fully vaccinated. But we would still have a long way to go at this current pace to be fully protected against Delta—which now comprises 99% of U.S. cases, per the CDC.

  • Source shout-out: Centers for Medicare & Medicaid Services

    Source shout-out: Centers for Medicare & Medicaid Services

    CMS now allows users to search directly for COVID-19 data on specific nursing homes. Screenshot taken on August 15.

    A recent issue of Al Tompkins’ newsletter led me to check out the Centers for Medicare & Medicaid Services (CMS) COVID-19 data page for the first time in a few months. And it has gotten a serious renovation during that time.

    Among many other responsibilities, CMS oversees the nation’s nursing homes—providing funding, monitoring quality standards, and more. As a result, CMS has tracked COVID-19 cases and deaths in nursing homes throughout the pandemic, along with tracking how well nursing homes adhere to standards such as PPE use and regular testing.

    The agency’s public data COVID-19 in nursing homes used to be displayed as a very basic page with links out to spreadsheet downloads. In fact, back in September 2020, I called out the website for its poor data accessibility, explaining that the site was set up in a manner challenging for screenreaders.

    Now, the site includes a customized data explorer, easy-to-read overarching statistics, and an API that developers can use to readily access nursing home data. Perhaps most useful for the average reader (and for local journalists) is a data visualization section. Users can search an interactive map for nursing homes in their area, then view those facilities’ COVID-19 stats. The section also includes maps displaying nursing home COVID-19 cases, deaths, and vaccinations by state.

    In short, CMS’s COVID-19 data are now both easier to access (from the journalist’s or researcher’s perspective) and easier to explore right on the agency’s website. Thank you, CMS developers!

  • Featured sources, August 15

    • CDC Variant Proportions: The CDC has adjusted the update schedule of its variant proportions estimates, from every two weeks to once a week. Variant numbers are still somewhat delayed (the most recent estimates are now from August 7, about a week ago), but this is a big improvement. The agency has also expanded its estimates to include Delta sub-lineages, called AY.1, AY.2, and AY.3.
    • COVID-19 Vaccination among People with Disabilities: Another recent change to the CDC’s COVID Data Tracker is this new page, reflecting vaccination coverage among Americans with disabilities. Data come from the Census’ Household Pulse Survey, which began asking respondents about their disability and vaccine status in April 2021.
    • Breakthrough cases by state, NYT: The New York Times has compiled and analyzed state data from on breakthrough (post-full-vaccination) COVID-19 cases, hospitalizations, and deaths. This information is available for 40 states and Washington, D.C.; the remaining 10 states failed to share their data with the NYT. Raw data underlying this analysis have yet to be made public on the NYT GitHub repository.
    • Education Stabilization Fund: The U.S. Department of Education has distributed a lot of money to school districts in the past year and a half—funding technology for remote learning, ventilation updates to buildings, COVID-19 tests, and more. This DOE database provides detailed records on which schools received funding and how much of the money has been spent.

  • Three more COVID-19 data points, August 15

    Three more COVID-19 data points, August 15

    The number of children hospitalized with COVID-19 has shot up in recent weeks. Chart from the CDC COVID Data Tracker.

    A couple of additional items from this week’s COVID-19 headlines:

    • 1,900 children now hospitalized with COVID-19 in the U.S.: More kids are now seriously ill with COVID-19 than at any other time in the pandemic. The national total hit 1,902 on Saturday, according to HHS data. Asked about this trend at a press briefing on Thursday, Dr. Anthony Fauci explained that, thanks to Delta’s highly contagious properties, we’re now seeing more children get sick with COVID-19 just as we are seeing more adults get it. The vast majority of kids who contract the virus have mild cases, but this is still a worrying trend as schools reopen with, in many cases, limited safety measures. For more on this issue, I recommend Katherine J. Wu’s recent article in The Atlantic.
    • 2.7% of Americans now eligible for a third vaccine dose: Both the FDA and the CDC have now given the go-ahead for cancer patients, organ transplant recipients, and other immunocompromised Americans to get additional vaccine doses. There are about 7 million Americans eligible, comprising 2.7% of the population. Studies have shown that two Pfizer or Moderna doses do not provide these patients with sufficient COVID-19 antibodies to protect against the virus, while three doses bring the patients up to the same immune system readiness that a non-immunocompromised person would get out of two dioses. Still, this move goes against the World Health Organization’s push for wealthy nations to stop giving out boosters until the rest of the world has received more shots.
    • 203 cases so far linked to Lollapalooza, out of 385,000 attendees: Chicago residents and public health experts worried that Lollapalooza, a massive music festival held in the city in late July, would become a superspreader event. Two weeks out from the festival, however, local public health officials are seeing no evidence of superspreading, with a low number of cases identified in attendees. Lollapalooza may thus be an indicator that large events can still be held safely during the Delta surge—if events are held outdoors and the vast majority of attendees are vaccinated. (Officials estimated that 90% of the Lollapalooza crowd had gotten their shots.)

  • Yes, we still need better data on COVID-19 and race: An interview with Dr. Debra Furr-Holden

    Yes, we still need better data on COVID-19 and race: An interview with Dr. Debra Furr-Holden

    I recently had the opportunity to discuss data equity with Dr. Debra Furr-Holden, a public health expert at Michigan State University. Dr. Furr-Holden is the university’s Associate Dean for Public Health Integration and Director of the Flint Center for Health Equity Solutions, a health research center focused on Flint, Michigan, where she is based.

    At one of my National Science-Health-Environment Reporting Fellowship training sessions, Dr. Furr-Holden spoke about the Flint water crisis and other health equity issues. Her comments made me think about continued issues in COVID-19 data collection and reporting, so I asked her to discuss COVID-19 data further in an interview for the CDD.

    We talked about the ongoing challenges of collecting and reporting COVID-19 race data, how data gaps fuel vaccine hesitancy, the equity challenges inherent in vaccine mandates, and more.

    The interview below has been lightly edited and condensed for clarity.


    Betsy Ladyzhets: First, I’m curious about your backstory, how you got involved in doing this kind of [health equity] work.

    Dr. Debra Furr-Holden: I think it probably was born out of my own lived experience. My dad died at 37, of a complication from hypertension. My mom died at 56 of an asthma attack.

    It wasn’t until I went to college that I realized that my peers had very different experiences. I went to college with no living grandparents and one living parent, and I just assumed everybody had relatives with, you know, amputated limbs and with diabetes and heart disease. And I realized that’s not the case.

    As I networked with the very small cohort of African-American students in my class, I noticed despite our socioeconomic backgrounds—because I came from sort of more humble beginnings than some of my Black and brown peers—I was like, Oh, [these health conditions are] over-represented in black and brown people.

    BL: How has that informed the work that you’ve been doing with COVID? I saw that you’ve been advocating for better vaccine access and stuff like that?.

    DFH: What I’ve realized is, a lot of what we do around disparities, we do to people, and for people, and on their behalf. But the populations most affected very rarely have a voice, and the solutions that get created and implemented and employed—and we saw it with COVID, we’re seeing it now.

    The President has made a national declaration, give everybody $100 for the newly vaccinated. And that doesn’t make sense to a lot of people. People who are having trouble paying for their hypertension medication or their other things are now being told, we’ll give you $100 to get this COVID vaccine. When earlier in the pandemic, those same people couldn’t get access to a COVID test.

    BL: And in some cases, probably still can’t get access to a COVID test.

    DFH: Yeah. And I’ve just realized, like, my own lived experience that is ongoing still informs my work, but it elevated my authentic and deep appreciation for how important the voice of community and affected populations is in the work. It’s not just about the data. It’s not just about the science… You can only glean but so much from a data table. You need more wind underneath that. And that wind is the voice of community, and the voice of the people that you’re trying to impact and serve.

    So, the big gap to me in our work around how to bridge this gap among the unvaccinated is: we are quantifying who is unvaccinated, but we’re not asking the question of, what is needed to bridge that gap for you to get the vaccine? Instead, I think we’ve got a lot of well-meaning people who are coming up with solutions, but those solutions are not mapping onto people’s concerns. And it’s not moving the needle.

    In Ohio, they offered this big lottery, it did not cause a big boom in vaccination. Same thing is happening in Michigan right now. It did not rapidly accelerate the pace of newly vaccinated people. And because my work is so community engaged, when I talk to people and they tell me the reasons underneath [their vaccination choice], it’s not about the money.

    I call the money the carrot. We’ve tried to dangle the carrot in front of people. That didn’t produce much. Now we’re using the stick.

    BL: The mandates.

    DFH: The mandates, yeah. That will likely produce more [vaccination] than the carrot did, because people will have their hands forced. But that will likely elevate resentment and give way to—any negative consequences or outcomes that come from people being forced into vaccination will likely only further fuel their mistrust of the healthcare system, and our government overall. I just feel like the solutions are not being informed by the people that we’re trying to get on board.

    BL: Yeah. What kind of information do we need to actually inform better solutions, do you think? 

    DFH: We need to hear from the very large and diverse pool of unvaccinated people. Because there’s no one solution here.

    Now, I do believe fundamentally, as a public health professional, I think of public health big population-level interventions that make health choices easy. So things like fluoride in drinking water. We don’t [remember] the time when the cavities and dental cavities were contributing to all of this excess death and morbidity. Why, because we got fluoride in drinking water. So it’s just a non-starter for us now. Same thing for standardized childhood immunizations, which were transformative for eradicating diseases that took millions of lives before we not only developed those vaccines, but made them a part of the standard immunization protocol for children.

    We’ve now got to do the work to figure out how to implement and integrate these COVID protections into our system of care, and have them be more normative. I think all of the mistakes around how the whole pandemic has been handled in the US—how the resources, not just the vaccine, but other resources, like payroll protection, enhanced unemployment, support for essential workers.

    You know, we weren’t providing PPE to essential workers in the beginning. We had national leaders saying you don’t have to wear a mask. All of these things now conflict with, “Oh, we care so much, and everybody has to get vaccinated. Everybody needs to take one for the team.” People just aren’t buying into that.

    BL: They think there’s something else going on, I guess. So, I know, when we were closer to the start of the vaccine rollout, like earlier in 2021, I saw a lot of press attention on the lack of demographic data on vaccinations. A couple of my colleagues at the COVID Tracking Project wrote an article in The Atlantic and there was other kind-of big name publication stuff. But now we still don’t have good data. And it seems like no one is really drawing attention to that. I’m wondering if you have any thoughts on this, and if there’s anything we can do to continue that pressure, because we still do need this information.

    DFH: Yeah, it’s unfortunate, because I always say a lack of data continues to fuel the debate. And the lack of quality data around COVID resources is only fueling the problem. It is an unnecessary and unacceptable omission for providers to administer COVID tests and not collect basic demographic data on the people that they’re testing. It dampens our ability to quantify who is most impacted and what should be the targets of our outreach, engagement, and intervention efforts. And it’s unnecessary and unacceptable.

    In Michigan, the system that we use is called MICR… It would take a programmer about eight seconds to make race, and ZIP code, and gender, and age category a required field to be entered. And we just simply haven’t done it. And so as a result, it’s hard for us to quantify the extent of a problem.

    Because, remember, COVID cases are only a function of COVID testing. You can only get identified as a COVID case as a function of having a COVID test. If you’re in a household, and there’s a known case in the household, and all of the other [household] members display classic COVID symptoms, if they don’t get a test, they don’t get counted anywhere. So we know that we’ve greatly underestimated the extent of the problem.

    BL: When I asked you about this at the SHERF session, you mentioned that there’s a provision in the CARES Act that requires providers to do this [data collection]. Can you talk more about that? And what we can do to actually have some accountability there?

    DFH: Yes. There is a provision in the CARES Act that all COVID testing providers have to collect these core demographic variables. And then there was follow up guidance that was issued. And when the new administration took office, they haven’t enforced that [guidance].

    So COVID testing providers continue to receive these resources to provide COVID testing, with no quality assurance or quality control, to ensure that they’re actually collecting and entering that demographic data. It then shifts the responsibility to backfill that information to local health departments and other providers, to try to link insurance records or electronic health records. Or even worse to do outreach and contact tracing and actually contact cases, by phone or by email to try to backfill that information. When there are so many other competing demands, it’s an unfair and undue burden to place on an already overstressed segment of our healthcare system. 

    What it’s akin to is gums without teeth. We have the law, but there’s no enforcement or compliance checks to ensure that that law is being honored. And I think a simple solution is compliance checks. We need compliance checks, and we need enforcement.

    BL: Do you have any thoughts on other stories that we should be telling? Like, what should I tell my journalist friends to cover around COVID and health equity?

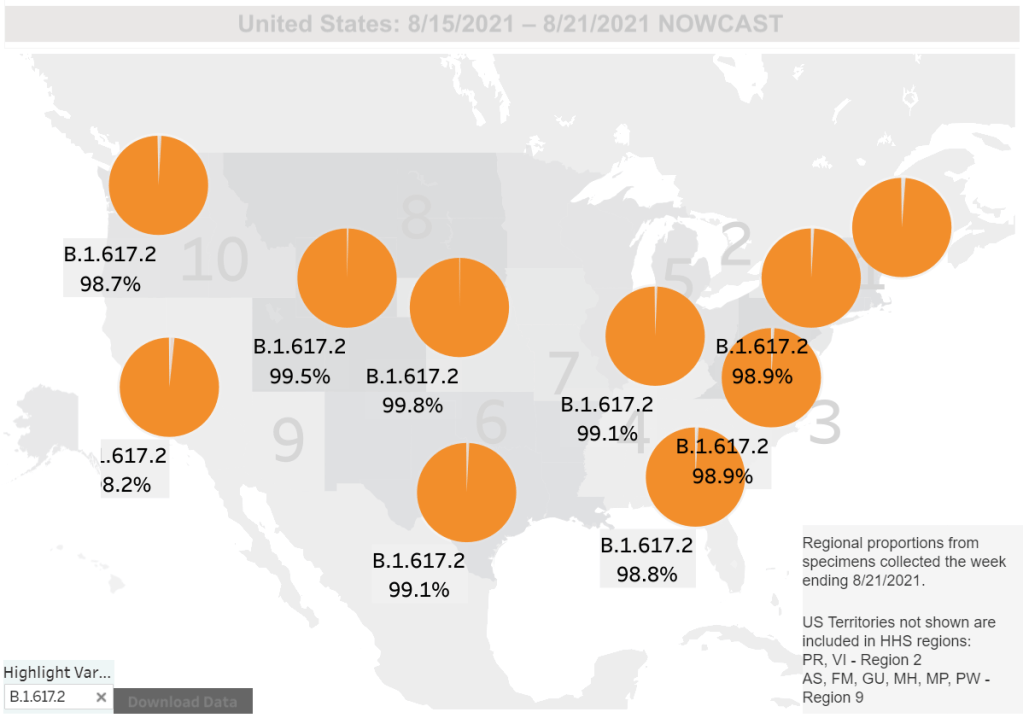
    DFH: One thing is probably already on your radar, which is the fact that we’re not doing systematic genetic sequencing on current strains of COVID. So it’s hard to estimate, you know—people keep talking about the Delta variant, but we have thousands of variants of SARS-CoV-2 now. And we just don’t have a good system for genomic surveillance to understand them.

    And the CDC a few weeks ago said, we’re just going to stop doing the genomic sequencing on any kind of systematic level and reporting. It’s a problem, because with breakthrough cases, and

    the vaccinated now showing up in hospitals and emerging data saying that even if you’re vaccinated, you can still spread and transmit… I just had a conversation with somebody who works in our building who said, I don’t want to get vaccinated, because if I get COVID, I want to have symptoms, so I’ll know, so I can protect my nine-year-old who’s got asthma. Like, I want to know. A lot of people now feel like the vaccine increases the chances of them being an asymptomatic carrier.

    We just really have to collect data. Instead of mandating shots in arms, we should be mandating the data so that we have better information and can do more credible and transparent information dissemination to communities.

    BL: Yeah, so that we can actually answer people’s questions on these things.

    DFH: Yeah.

    BL: I was also wondering if you had any recommendations, either of good stories that do a good job of covering these issues we’ve been talking about, or data sources or resources that myself and other journalists in this space should be paying attention to.

    DFH: We should be putting the press on the CDC to collect and compile the data. Like, the data on cases, all of that data should be disaggregated by race. And the percentage of cases with unknown race or unknown gender or unknown geography should also be reported. Because I don’t know if people notice this, but a lot of times [the CDC is] presenting data only on cases with complete information. But the missing information points to something important as well.

    BL: I think it’s something like they have maybe 50% or 60% of cases with known race. But where’s that other share of cases? [Editor’s note: It’s 63%, as of August 14.]

    DFH: The assumption is that the distribution of these variables in the unknown is similar to that of the known. But it is a major assumption. And it’s not an assumption that we should be making.

    BL: I see. Yeah. Anything else [you’d recommend as a story idea]?

    DFH: I do like this carrot stick analogy. The carrot is not working, the dangling the big incentive is not working. The stick will likely work. If you tell people, “You can’t get on a plane, if you’re unvaccinated,” there will be a lot of people who are unvaccinated right now who will get vaccinated because they’ll not want to lose the opportunity to travel.

    Think about the media. If you are chasing a story, or if you’ve got to be on site for something… If you’re in New York and you’ve got a story in California, you’re not going to drive to California, you will likely get off the fence and get vaccinated.

    I feel like a larger problem is, we have to engage experts in the work to make sure that we’re not furthering inequity [with mandates]. Because if we use, now, the stick, and start to mandate it…. [Michigan State University] has now mandated vaccination for all faculty, staff and students who want to return to campus by September 7. I know that that will likely produce greater increases in vaccination than did the incentives of cash payments, or lotteries or other things.

    But we have to keep an eye toward equity, and make sure—what if there’s disproportionality and then who does that impact? Are we going to see an increase in Black and brown people, or people with disabilities, or people with chronic health conditions, losing their jobs, or dropping out of school, or some of these other things? There just needs to be more thoughtfulness to how we apply these policy interventions to make sure that it’s not furthering inequity.

    BL: Have you seen any examples of where that’s been done successfully?

    DFH: No, because it’s all just coming out now.

    BL: I know there are some places, like in New York, they’re giving you an option, saying, “You can get vaccinated or you have to be tested once a week.” Is that effective? Or does that still fit into what you’re talking about?

    DFH: I think we’re gonna figure that out. And if that’s the case, then again, we gotta deal with the access issue, and people need to have fair and equitable access—and affordable access—to COVID testing.

    BL: Yeah, totally. And the last kind of big question I had for you: one thing I think a lot about as a journalist who is still rather early-career and has been covering COVID very intensely is that this is probably just the beginning of us dealing with major public health crises. You know, continued climate disasters and all that stuff.

    And I’m wondering how you think about preparing for the next COVID, or the next whatever it’s going to be. What lessons do we take from these past couple of years?

    DFH: Well, I think we’ve learned there is a business case for preparedness, and a business case for equity. Our lack of preparation for this pandemic will have cost our country tremendously. There’s going to be tremendous financial toll. So, there’s a business case to be made for preparedness.

    We learned that with the Flint water crisis. Not having the million-dollar investment in the water treatment system, not spending the 150 bucks a day on anticorrosives, those things will have cost us hundreds of millions of dollars to now replace and repair the whole water infrastructure system and pay settlements from the Flint water crisis.

    And then there’s also a business case for equity. Not doing a better job of equitably rolling out the vaccine early on caused a lot of people who were a “yes” to sort of say, “why bother?” And now many of them are a “no.” These are people who earlier on [were amenable], but then all these reports come out and get sensationalized by the media of side effects and blood clots and heart inflammation. And so a lot of people who were in line, trying to move through the line to get vaccinated are now an absolute “no.”

    That’s going to cost us as well, because we have fallen well short of that 70% goal. And new vaccinations are moving at a snail’s pace. So I think what we’ve learned—and we’ll really know, the impact of it in the next few years—is not being prepared and not practicing equity will have a tremendous financial toll on the country.

  • Opening profile: Public health collaboration in Austin, Indiana

    Opening profile: Public health collaboration in Austin, Indiana

    By Betsy Ladyzhets

    The middle and high school campus in Austin, Indiana. Photo from the Scott County School District 1 Facebook page.

    In 2015, Austin, Indiana was hit with a deadly epidemic: HIV/AIDS. This city, then over 4,000 people, saw over 200 HIV cases in about a year during its outbreak, which one health reporter called “the worst drug-fueled HIV outbreak ever to hit rural America.”

    So when the COVID-19 pandemic hit, the small city was prepared to respond. The school district and public health department took advantage of their existing relationship and community trust to plan for a safe school reopening that stands out as one of the most successful in the state, according to a COVID-19 Data Dispatch analysis.

    “The HIV outbreak actually brought a lot of people together,” said Brittany Combs, a Scott County public health nurse who worked with the district. “We all came to the same table and figured out what we needed to do to tackle the HIV outbreak. And so, for the pandemic, we all were already at the table.”

    This school district, Scott County School District 1, is the subject of the first profile in the COVID-19 Data Dispatch’s “Opening” series. Alongside four other school communities, it was selected because the majority of the district’s students returned to in-person learning during the 2020-2021 school year — and under 5% of the student population was identified as a COVID-19 case. (According to the CDC, about 5% of school-aged children in the U.S. have contracted COVID-19 since the start of the pandemic.)

    While Austin’s experience with HIV/AIDS is unique, the school district offers lessons for other communities. An open line of communication between Austin’s county public health agency, school administrators, and other local leaders fostered an environment of collaboration and trust. Plus, the administrators took advantage of teachers’ and parents’ knowledge of their students to make them an integral part of identifying COVID-19 cases and stopping outbreaks.

    Demographics for Austin, Indiana
    American Community Survey 2019 5-year estimates

    • Population: 3,700
    • Race: 97.8% white, 0.7% Native American, 0.8% other, 0.8% two or more races
    • Education: 75.8% have high school degree, 4.7% have associate’s degree, 2.0% have bachelor’s degree
    • Income: $34,200 is median household income, 27.4% in poverty
    • Computer: 80.6% have a computer, 65.9% have broadband internet1
    • Free lunch: 64.7% of students eligible for free or reduced-price lunch2

    COVID-19 stats for Scott County School District 1, 2020-2021

    • Total enrollment: 1,200 students2
    • In-person enrollment: About 80% at the start of the year, 85% at the end3
    • Total cases, 2020-2021 school year: 47 in students, 25 in staff4
      • 13 elementary school students (Austin Elementary School)
      • 19 middle school students (Austin Middle School)
      • 15 high school students (Austin High School)

    1Source: County-level statistic
    2Source: National Center for Education Statistics
    3Source: Interview with Superintendent Trevor Jones
    4Source: Data from Head School Nurse Deana Broadus. Numbers include students who did not attend in-person classes while sick, but whose cases were reported to the district.


    Public health collaboration

    In planning for reopening the school district after spring 2020 closures, the public health department had “constant meetings with the school,” Combs said. The existing relationship between the school and public health experts streamlined these meetings. And thanks to past outreach efforts around HIV and opioids, the public health department already had relationships with Austin families.

    “I like to think that the health department already has a lot of trust because we were in the news a lot, we were forefront a lot, so they kinda know who we are,” Combs said. “Hopefully, the majority of the county really trusted in what we said.”

    Families were also likely to collaborate with the school district because they wanted their kids back in classrooms, according to Superintendent Trevor Jones. He referenced Austin’s high poverty level (27.4%, compared to a national average of 10.5%) and explained that the majority of students get free breakfast and lunch. Combined with the community’s past drug abuse issues, he said, there was ample motivation among parents and teachers alike to protect students from the isolation of remote learning.

    “The safest place our kids can be is here at school,” Jones said.

    While the schools had some basic safety measures in place, such as six-foot spacing, masks required everywhere except at spaced-out desks, and regular handwashing, this community trust paid off most in identifying students with COVID-19 symptoms. Deana Broadus, head school nurse at the district, said that teachers and parents acted as a first line of defense in identifying symptoms. At the beginning of the school day, teachers took students’ temperatures and asked them about other symptoms.

    “As the school year went on, teachers [get to] know their kids,” Broadus said. “They can kind of tell, oh, she doesn’t look that well today, go see the nurse.”

    Broadus and the other school nurses also got to know their students by following up on symptom questionnaires and developing medical histories. Some students would erroneously mark every symptom on the checklist, she said: “You get to know who’s trying to go home.” In other cases, the symptom checks inspired the nurses to keep better track of seasonal allergies, recurring stomach aches, and other chronic conditions that were previously reported by parents but not thoroughly documented by the school.

    Parents took part in the informal COVID-19 surveillance, too. “Parents would call in and report certain symptoms,” Broadus said. “[Students] either needed a doctor’s note or a negative COVID test to return to school.”

    The procedure was similar if a student was sent home. While the district initially quarantined full classes following a positive case, the strategy shifted to close-contact identification: figuring out which students had sat next to an infected child. Broadus said that the chief concern she heard from parents calling in to report a case was often ensuring that no more children than necessary would need to miss in-person class, though students who missed class could still follow along online.

    Keep sick students home

    Through collaboration with the public health department — which took charge of contact tracing for parents, staff and other non-students — Broadus found that the vast majority of school cases came from outside the buildings. 

    “Usually what we found was that a parent or someone else that the child lived with was sick, and then subsequently the student got sick,” she said. And among those students, cases were typically identified quickly enough that the virus didn’t spread to others.

    One of the Austin district’s major lessons from the past school year was the importance of telling families to keep their kids home if they were sick. In the past, students and staff alike tended to “push through it” and still come in if they didn’t feel well, Broadus said. Now, the policy is to stay home from school or work if you have any symptoms, not just those matching COVID-19. To reinforce this, Jones said, the district is removing rewards for perfect attendance and similar bonuses for staff. The schools are also continuing to emphasize handwashing and other good hygiene habits.

    Still, the district did not avoid cases entirely. A total of 47 students contracted COVID-19 over the course of the school year, including 13 students at Austin Elementary School, 19 at Austin Middle School, and 15 at Austin High School — or about 4% of the district’s total enrollment. According to Broadus, the district identified the most cases (17 total) during November and December 2020, at the peak of the fall COVID-19 surge. The district added additional COVID-19 safety precautions at this time, such as limiting spectators at sporting events.

    Delta poses new challenges

    This fall, Austin’s school district is facing further challenges amplified by the country’s Delta surge. School started in-person on August 3; unlike the previous year, masks were optional. Several student cases in the first week of school led the district to switch to all-virtual classes for two weeks, Superintendent Jones said in an email on August 10.

    When students return after this virtual period, COVID-19 symptom monitoring will continue — though the district is phasing out formal checklists that proved to be less helpful than parent and teacher intuition. The six-feet distancing rule has shrunk to three feet. Ventilation has also improved, thanks to grant money from the federal government for which many districts were able to apply.

    Austin will continue to rely on its community to identify cases and stay safe in the new school year. “I feel like it wasn’t just one thing that we were doing,” Broadus said. “Everyone was working together.”


    The COVID-19 Data Dispatch’s “Opening” series is available for other publications to republish, free of charge. If you or your outlet is interested in publishing any part of this series, please contact betsy@coviddatadispatch.com.

    Update, Sept. 7, 2021: After two weeks of all-virtual classes in August 2021 prompted by high case numbers, the Austin school district returned to the COVID-19 safety protocols followed in the previous school year. Masks are once again required whenever students are not stationary at distanced desks, and desk spacing is back at six feet where possible. “We made some adjustments to our COVID procedures that have minimized the number of students in quarantine,” Superintendent Jones said in an email on Sept. 7.

    More K-12 schools reporting