In the past week (March 23 through 29), the U.S. officially reported about 140,000 new COVID-19 cases, according to the CDC. This amounts to:
An average of 20,000 new cases each day
43 total new cases for every 100,000 Americans
9% fewer new cases than last week (March 16-22)
In the past week, the U.S. also reported about 17,000 new COVID-19 patients admitted to hospitals. This amounts to:
An average of 2,400 new admissions each day
5.1 total admissions for every 100,000 Americans
5% fewer new admissions than last week
Additionally, the U.S. reported:
1,600 new COVID-19 deaths (230 per day)
88% of new cases are caused by Omicron XBB.1.5; 5% by XBB.1.9.1; 2% by XBB.1.5.1; 0.4% by CH.1.1 (as of March 18)
An average of 40,000 vaccinations per day
While official COVID-19 cases and hospitalizations continue to trend ever-so-slightly downward, wastewater surveillance data show potential new upticks in transmission. Despite continued minimal safety measures in most places, we have to remain wary of a potential spring surge.
Official data from the CDC suggested that cases and new hospital admissions dropped very slightly last week, compared to the week prior. But case data continue to be plagued with reporting delays; again this week, multiple states (Florida, Delaware, Mississippi, Oklahoma) reported no cases or had other issues. These delays make it difficult to assess patterns at state or county levels.
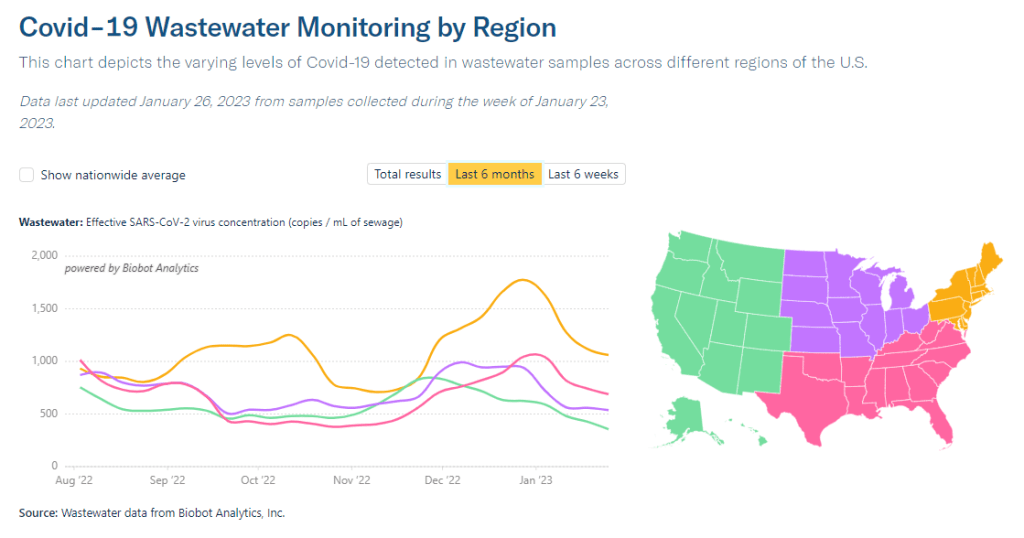
Wastewater surveillance data provide more accurate early warnings about potential rising transmission. This week, Biobot’s data suggest slight increases in all four major regions of the country. It’s worth noting, though, that Biobot’s most recent data are preliminary. I’ll be closely watching the dashboard’s next updates, this coming Tuesday and Thursday.
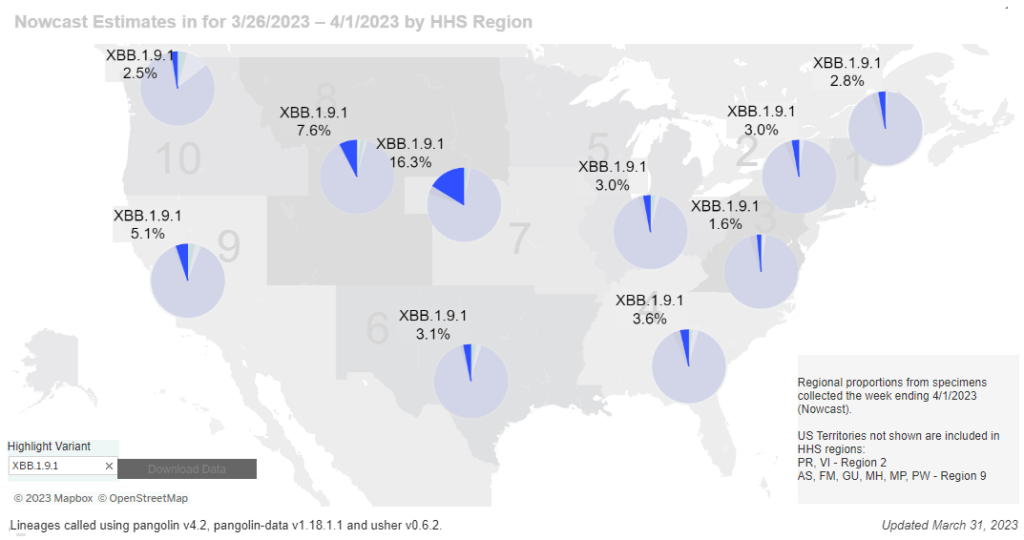
The latest Omicron variant of concern, XBB.1.9.1, could be one reason for increasing coronavirus levels. This subvariant caused an estimated 5% of new cases across the country nationwide last week, according to the CDC’s Nowcast analysis. At the same time, XBB.1.5 has declined for the first time since it emerged a couple of months ago, suggesting XBB.1.9.1 might slowly outcompete it.
XBB.1.9.1 is most prevalent in the Midwest, particularly the region including Iowa, Kansas, Missouri, and Nebraska. Some counties in this region are also reporting significant coronavirus increases in their wastewater, according to Biobot and WastewaterSCAN. Missouri’s wastewater dashboard similarly shows increases across the state.
In our current era of high background coronavirus spread (and few-to-no widespread safety measures), a new variant can easily cause concerning outbreaks. It’s important to remember that, no matter how much the virus evolves, simple measures like masks and ventilation can still make transmission less likely.
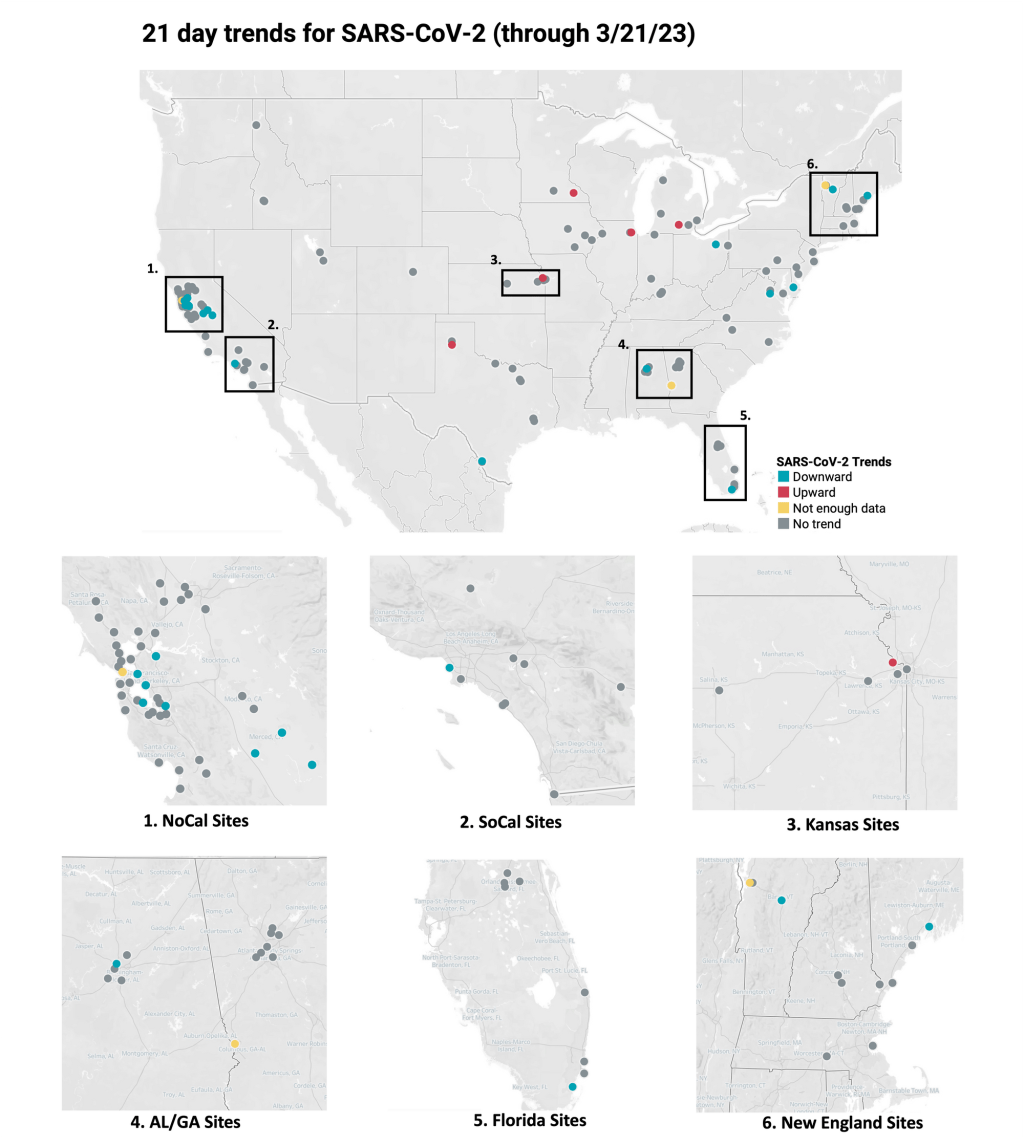
Data from WastewaterSCAN suggest that most sites in its network saw downward coronavirus trends or plateaus in recent weeks.
In the past week (March 16 through 22), the U.S. officially reported about 130,000 new COVID-19 cases, according to the CDC. This amounts to:
An average of 19,000 new cases each day
41 total new cases for every 100,000 Americans
13% fewer new cases than last week (March 9-15)
In the past week, the U.S. also reported about 17,000 new COVID-19 patients admitted to hospitals. This amounts to:
An average of 2,400 new admissions each day
5.2 total admissions for every 100,000 Americans
9% fewer new admissions than last week
Additionally, the U.S. reported:
2,000 new COVID-19 deaths (300 per day)
90% of new cases are caused by Omicron XBB.1.5; 3% by XBB.1.9.1; 2% by XBB.1.5.1; 0.4% by CH.1.1 (as of March 18)
An average of 40,000 vaccinations per day
Nationally, we continue to see the same slow decline of COVID-19 spread across the U.S., as shown by official case data, hospitalizations, and wastewater surveillance.
Reported cases dropped by 13% last week compared to the week prior, while new hospital admissions dropped by 9%. As I’ve noted in the last couple of updates, the CDC continues to deal with reporting delays from different state health departments. This week, Texas, Arkansas, Florida, and Indiana did not report cases to the CDC.
Wastewater surveillance data from Biobot and the WastewaterSCAN project suggest that COVID-19 levels are at slow declines or plateaus in most parts of the country, but some places may be seeing small increases. Biobot’s dashboard shows slight upticks in the Northeast, Midwest, and West coast regions, as of its March 22 update.
Overall, Biobot’s data suggests that national coronavirus concentrations are lower than they’ve been in about a year—but still higher than we’ve seen at this point in 2021 and 2022. The low case numbers that health departments are putting out mask a high baseline of infections, in which many people are not getting PCR tests or reporting their cases to the healthcare system.
Our US #SARSCoV2#wastewater concentration is now at its lowest point in almost a year, but remains above levels seen in previous years at this time. As we enter Spring, we will be monitoring for any indication of a potential springtime wave. https://t.co/GBL4twvGGTpic.twitter.com/qempsPrS5P
Data from the WastewaterSCAN project suggest that most of the project’s 148 monitoring sites reported downward trends or plateaus in coronavirus levels over the last three weeks. A few places have reported upticks, though, including sites in Kansas, Michigan, South Carolina, Massachusetts, and Oklahoma.
One reason for these upticks could be XBB.1.9.1, the latest Omicron subvariant to draw concern among virologists. The CDC started reporting estimates for XBB.1.9.1 in its latest variant update (this Friday): the agency estimates that this variant caused 2.5% of new cases nationwide last week, with higher prevalence (about 13%) in the Midwest region that includes Iowa, Kansas, Missouri, and Nebraska.
XBB.1.9.1 is doubling “roughly every 8 days,” according to Marc Johnson, a virologist at the University of Missouri who leads the state’s wastewater surveillance program. Johnson predicts that this subvariant will be dominant in the U.S. by the end of April, but it could face competition from XBB.1.16—another descendant of XBB that has been spreading rapidly in India.
What's next for COVID?
I projected a few weeks ago that XBB.1.9* would be the next dominant lineage in the US.
This lineage was a little over 4% of US sequences over the last 2 weeks, and the numbers are doubling roughly every 8 days.
Could the spread of these XBB sublineages across the U.S. cause a significant rise in cases and hospitalizations? It’s hard to say, given the complex picture of immunity in the country, with millions of people recently infected by a variety of variants. “Future waves are getting harder and harder to forecast,” Katelyn Jetelina wrote in Your Local Epidemiologist this week. Regardless, the same safety measures (masks, testing, etc.) continue to work against all new versions of the virus.
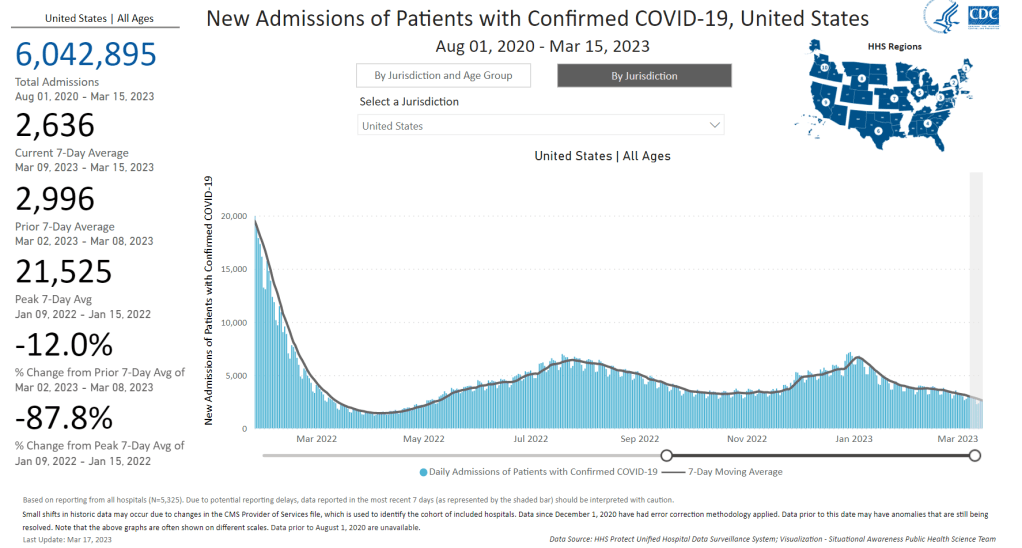
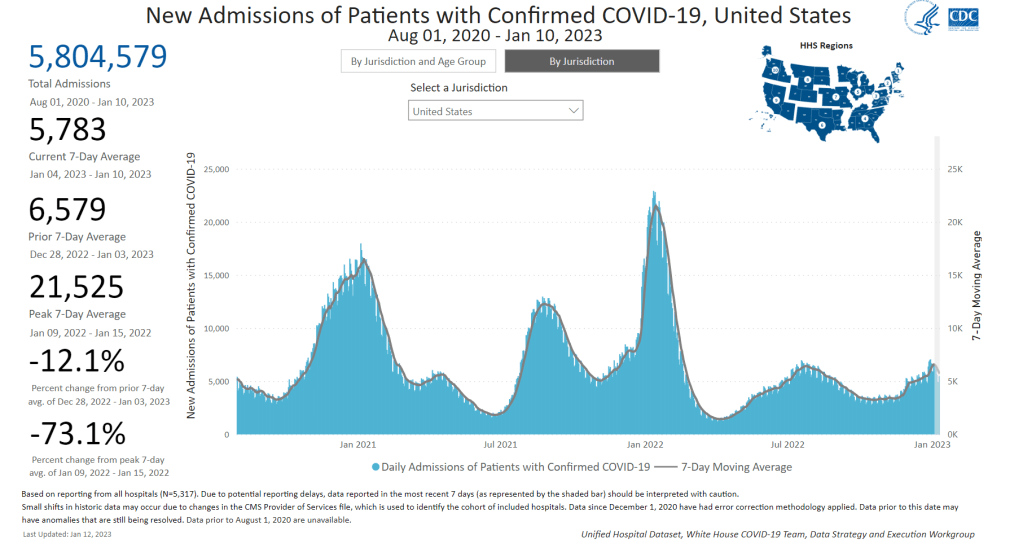
New hospital admissions have fallen significantly from their recent peak in January, but are still much higher than at this time last year. Chart from the CDC.
In the past week (March 9 through 15), the U.S. officially reported about 150,000 new COVID-19 cases, according to the CDC. This amounts to:
An average of 21,000 new cases each day
46 total new cases for every 100,000 Americans
20% fewer new cases than last week (March 2-8)
In the past week, the U.S. also reported about 19,000 new COVID-19 patients admitted to hospitals. This amounts to:
An average of 2,800 new admissions each day
5.9 total admissions for every 100,000 Americans
10% fewer new admissions than last week
Additionally, the U.S. reported:
1,700 new COVID-19 deaths (240 per day)
90% of new cases are caused by Omicron XBB.1.5; 2% by XBB.1.5.1; 0.5% by CH.1.1 (as of March 18)
An average of 40,000 vaccinations per day
The trend continues: COVID-19 spread is still on the decline across the U.S., but it’s a slow decline. These updates are getting pretty repetitive to write, as we’ve been seeing this pattern since late January—which, honestly, I’m taking as a good sign.
Last week, I noted that the drop in official COVID-19 cases (reported to the CDC) was exaggerated slightly because of data delays; three states didn’t report cases in the week ending March 8. This week, the same thing happened for three different states: Texas, Arkansas, and Indiana. We’ll likely continue to see reporting issues like this, as state and local health departments put fewer resources into tracking COVID-19.
Even so, the official case data, hospital admissions, and wastewater surveillance all point to continued decreases in coronavirus transmission. National hospital admissions dropped by about 12% this week compared to the week prior. But there are still a lot of Americans getting severe COVID-19 symptoms, with more than 3,000 people newly hospitalized each week for the last month.
Wastewater surveillance data from Biobot suggest that coronavirus spread is getting lower, but it’s still at much higher levels nationally than we saw at this time in 2021 and 2022. Regionally, the Midwest now has slightly more virus circulating than other parts of the country, but all four major regions are seeing slow declines or plateaus.
In other good news: flu activity is still low nationally, according to the CDC’s flu surveillance. Experts had worried we might see a second flu surge, driven by a different strain of the influenza virus, after the initial surge died down in January. But so far, that hasn’t happened. Almost every state reported moderate or low levels of influenza-like activity in the week ending March 11.
XBB.1.5 continues to be the dominant coronavirus lineage in the U.S., causing an estimated 90% of cases nationwide in the week ending March 18. XBB.1.5.1, a descendant of XBB.1.5, is growing slowly (it caused an estimated 2% of cases nationwide this week) and doesn’t seem to be very competitive yet. The CDC also has yet to break out XBB.1.9 or XBB.1.16, other subvariants that mutated from XBB.
Yesterday, I spoke about wastewater surveillance at New York City School of Data, a civic conference that’s part of the city’s Open Data Week. While the conference wasn’t focused on health or science topics, the organizers required masks and checked attendees’ vaccinations. I also brought my CO2 monitor to the event, and found ventilation was generally good in the session rooms. This conference was a nice reminder that some organizations are still following the data and science on COVID-19 precautions.
In the past week (March 2 through 8), the U.S. officially reported about 170,000 new COVID-19 cases, according to the CDC. This amounts to:
An average of 24,000 new cases each day
52 total new cases for every 100,000 Americans
25% fewer new cases than last week (February 23-March 1)
In the past week, the U.S. also reported about 20,000 new COVID-19 patients admitted to hospitals. This amounts to:
An average of 2,800 new admissions each day
6.1 total admissions for every 100,000 Americans
13% fewer new admissions than last week
Additionally, the U.S. reported:
1,900 new COVID-19 deaths (270 per day)
90% of new cases are caused by Omicron XBB.1.5; 2% by XBB.1.5.1; 1% by CH.1.1 (as of March 11)
An average of 50,000 vaccinations per day
Following the same pattern we’ve seen for the last few weeks, COVID-19 spread is still on the decline nationally. Official case counts, hospital admissions, and wastewater surveillance data all continue to point in this direction.
This week, the decline in CDC-reported cases was sharper than it’s been in a couple of months (with 25% fewer cases reported than the prior week). But this may be due to reporting issues, rather than an actual change in transmission patterns: the CDC’s case trends page explains that Florida, Washington State, and Utah all did not report cases in the week ending March 8.
Still, I’m heartened by the fact that hospital admissions—which are reported more reliably—dropped by 13% this week, compared to smaller week-over-week changes over the last month. Wastewater surveillance data from Biobot also continue to show steady declines, though we’re still not close to the national lows observed during this time in 2021 and 2022.
Biobot’s data suggest declining surveillance in all four major regions of the country, with coronavirus levels in the Northeast now dropping below the Midwest, South, and West coast. Some individual counties in the Midwest are still reporting increased viral concentrations in their wastewater; I specifically noted Sheridan County and Teton County, Wyoming in Biobot’s data.
Omicron XBB.1.5 has been the dominant variant in the U.S. since mid-January, and we have yet to see a new subvariant rise to meaningfully compete with it. CH.1.1, which has driven increased transmission in other parts of the world, has remained under 2% of new cases nationally, per the CDC’s estimates.
The CDC’s latest variant update also breaks out XBB.1.5.1, an offshoot of XBB.1.5, at about 2% of new cases nationally. I have yet to see much discussion of this offshoot or how it differs from XBB.1.5; I’ll cover it more in future issues as we learn more. In addition, variant experts are keeping an eye on XBB.1.9, XBB.1.16, and other subvariants that have further mutated from the XBB lineage.
In his latest Substack newsletter, long-time COVID-19 commentator Eric Topol suggests that the U.S. might be in a welcome “break from COVID-19 waves.” He points to XBB.1.5’s dominance and the fact that its rise “was not associated with a surge of COVID-19 hospitalizations or deaths in the United States or elsewhere in the world” despite the subvariant’s increased capacity to spread.
At the same time, Topol explains the problem with our current “high baseline” of continued COVID-19 spread, which leads to continued severe cases among vulnerable people and the ongoing risk of Long COVID. He also explores the potential for another Omicron-like event, which would potentially cause another major surge. His article is helpful for understanding our current COVID-19 moment.
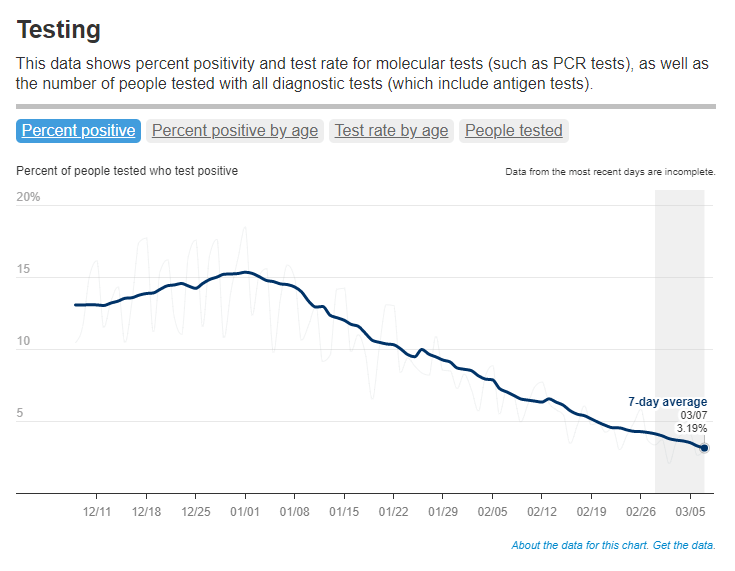
In NYC, where I live, COVID-19 case rates and test positivity are lower than they’ve been since early 2022—while still much higher than we saw last spring post-Omicron BA.1, or in spring 2021 as vaccines were widely rolled out. And the numbers are likely going to get more unreliable soon, as the city begins to wind down public testing sites.
Biobot’s regional data suggest that most of the country is seeing declining COVID-19 spread, but we’re heading into high plateaus.
In the past week (January 19 through 25), the U.S. officially reported about 300,000 new COVID-19 cases, according to the CDC. This amounts to:
An average of 42,000 new cases each day
90 total new cases for every 100,000 Americans
11% fewer new cases than last week (January 12-18)
In the past week, the U.S. also reported about 30,000 new COVID-19 patients admitted to hospitals. This amounts to:
An average of 4,200 new admissions each day
9.0 total admissions for every 100,000 Americans
14% fewer new admissions than last week
Additionally, the U.S. reported:
3,800 new COVID-19 deaths (540 per day)
61% of new cases are caused by Omicron XBB.1.5; 31% by BQ.1 and BQ.1.1; 2% by CH.1.1 (as of January 28)
An average of 100,000 vaccinations per day
At the national level, COVID-19 spread appears to be approaching another plateau. New cases and hospitalizations (as reported by the CDC) are still in decline, but their descent is slowing: reported cases dropped by 11% this week, compared to 24% last week.
Wastewater surveillance presents the same trends. National data from Biobot suggest that COVID-19 transmission is leveling out in a similar place to where we were in October and November 2022, before the holiday surge drove up spread.
Biobot’s regional data show a slowing decline in the Northeast, plateaus in the Midwest and South, and a somewhat-more-pronounced decline in the West. And wastewater surveillance data from the CDC shows that COVID-19 spread is going up in some places, down in others: out of about 1,000 sites reporting data in the last two weeks, 48% reported decreases in coronavirus levels while 40% reported increases.
Unlike in recent weeks where every state has reported declines in COVID-19 cases and hospitalizations, a few places are now reporting definitive upticks, according to the latest Community Profile Report. These states include Alaska, Vermont, Maine, South Dakota, North Dakota, Nevada, Oklahoma, Minnesota, and Indiana.
Why might some states report COVID-19 upticks just after we emerged from a surge over the holidays? One explanation could be the XBB.1.5 variant, which continues to outcompete other Omicron lineages. XBB.1.5 now comprises about 60% of new cases nationwide (according to the CDC’s estimates); while it is most dominant in the Northeast, it’s growing—and likely reinfecting people—in other regions.
The CDC’s latest variant estimates also now include Omicron CH.1.1, which has been connected to rising cases in the U.K. and New Zealand in recent months. Per the CDC, CH.1.1 has been present in the U.S. at low levels (like, 1% or less) for a few weeks now, without posing a major challenge to XBB.1.5. But it is still a variant worth keeping an eye on.
As flu and RSV cases continue to trend down, the U.S. is confronted with the final weeks of a respiratory disease-heavy winter that was pretty rough on our healthcare system—but fell short of the mind-boggling case numbers that we saw in the prior two winters. Yes, we didn’t see a repeat of “the first Omicron wave”; but still, millions of people got sick, thousands died. Many will likely experience Long COVID as a consequence of their infections this winter.
New hospital admissions for COVID-19 are starting to trend down, according to the CDC, though we’ll need more data to see if this trend persists.
In the past week (January 5 through 11), the U.S. officially reported about 420,000 new COVID-19 cases, according to the CDC. This amounts to:
An average of 59,000 new cases each day
126 total new cases for every 100,000 Americans
13% fewer new cases than last week (December 29-January 4)
In the past week, the U.S. also reported about 40,000 new COVID-19 patients admitted to hospitals. This amounts to:
An average of 5,800 new admissions each day
12.3 total admissions for every 100,000 Americans
12% fewer new admissions than last week
Additionally, the U.S. reported:
3,900 new COVID-19 deaths (560 per day)
43% of new cases are caused by Omicron XBB.1.5; 45% by BQ.1 and BQ.1.1 (as of January 14)
An average of 150,000 vaccinations per day (CDC link)
Last week, I wrote that a combination of holiday travel/gatherings and the latest Omicron subvariant, XBB.1.5, was driving a winter surge. This week, COVID-19 metrics suggest that the surge may have peaked, though we’ll need more data to say for sure—and XBB.1.5 remains a concern.
After reporting a significant increase in coronavirus levels through the end of December, Biobot’s wastewater dashboard is now showing downturns nationally and for all four U.S. regions. The CDC’s wastewater dashboard similarly shows that about two-thirds of sites in the National Wastewater Surveillance System have reported decreasing COVID-19 levels in the last two weeks, as of January 10.
“Importantly, this data is subject to change as we update 2x weekly,” Biobot’s Twitter shared on Thursday, when the company’s dashboard was most recently updated. “Stay tuned for Tuesday’s update.”
📣Our #Covid ww dashboard has been updated—https://t.co/GBL4twvGGT. We’re seeing a drop in concentrations in all regions, which may indicate the passing of the holiday surge. Importantly, this data is subject to change as we update 2x weekly. Stay tuned for Tuesday’s update.
Official COVID-19 cases and hospital admissions are also trending down, according to CDC data: new cases dropped by 13% from the week ending January 4 to the week ending January 11, while newly hospitalized patients dropped by 12%. But this trend isn’t universal; five states and Washington D.C. reported increased hospitalizations this week, with the biggest upticks in Rhode Island, Louisiana, and Maine.
XBB.1.5, the latest and most contagious Omicron subvariant, caused an estimated 43% of new cases nationwide in the week ending January 14, per the CDC. It’s clearly outcompeting BQ.1 and BQ.1.1 as well as a number of other strains in the “Omicron soup” we currently face, but is not taking over as quickly as we saw the original Omicron do in late 2021.
This strain continues to dominate the Northeast—particularly New England and New York/New Jersey—where COVID-19 spread is trending down. But it’s just starting to pick up in other parts of the country; to me, it seems likely that the Northeast had a holidays-and-XBB.1.5 combined surge, while other areas may face a second COVID-19 increase as this variant spreads more widely.
Meanwhile, other respiratory viruses continue to place additional burden on our health system. For example, the CDC recently released estimates about this year’s flu season, finding that the flu may have caused up to 560,000 hospitalizations and 48,000 deaths since fall 2022.
XBB.1.5 caused about 28% of new cases in the week ending January 7 (confidence interval: 14% to 47%), according to the CDC’s estimates.
You’ve probably seen it in the news this week: XBB.1.5 is the latest Omicron subvariant to spread rapidly through the U.S.
It is, of course, more transmissible and more capable of evading immunity from past infections than other versions of Omicron that have gone before it, as this lineage continues mutating. Scientists are still learning about XBB.1.5; it emerged from the U.S. during the holiday season, which has posed surveillance challenges. But we know enough to say that this variant is bad news for an already overstretched healthcare system.
Here’s a brief FAQ post on XBB.1.5.
Where did XBB.1.5 come from?
XBB, the parent of this latest lineage, emerged in Asia in October 2022. It evolved from Omicron BA.2 via recombination, which basically means two different BA.2 subvariants fused—likely while the same person was infected with both—and formed this new strain. (See my variants post from October for more details on XBB.)
XBB started spreading and mutating in the U.S. a few weeks later, leading to XBB.1.5. This subvariant was first identified in New York State in mid-December, though it could have evolved elsewhere in the northeast (since New York has better variant surveillance than some other states). Eric Topol’s newsletter has more details about XBB evolution.
New variant to watch
XBB.1.5 really taking off in New York, where it appears to have evolved
BQ.1* in NY has been almost flat since dominance in Nov
What are XBB.1.5’s advantages compared to other variants?
It spreads faster, likely because it is more capable of evading immune system protections from past infection or vaccination than other Omicron subvariants. In the U.S., CDC data suggests that XBB.1.5 is starting to outcompete other lineages in the “Omicron variant soup” we currently have circulating.
BQ.1.1 and XBB (original) were already known to be the best-evolved subvariants in this area before XBB.1.5 came along, according to this December 2022 paper in Cell. XBB.1.5 has taken this immune escape further, as it evolved a mutation called F486P that’s tied to this property.
“It’s crazy infectious,” Paula Cannon, a virologist at the University of Southern California, told USA TODAY reporter Karen Weintraub. Cannon added that protections that have worked against other coronavirus strains for the last three years will likely be less effective against XBB.1.5 and other new variants.
What questions are scientists currently working to answer about XBB.1.5?
One major question that arises with any new subvariant is severity: will XBB.1.5 have a higher capacity to cause severe symptoms than other coronavirus lineages? (We now know, for example, that Delta was more severe compared to prior variants.)
The World Health Organization is currently working on a report about XBB.1.5’s severity, according to POLITICO. Scientists and public health officials will also study whether current COVID-19 treatments work against this subvariant. Antiviral treatments Paxlovid and Mulnopiravir likely won’t be impacted, but Omicron’s continued evolution has put a lot of restrictions on monoclonal antibodies.
Another important question will be how well our updated booster shots work against XBB.1.5. The shots used in the U.S. were primed for BA.4 and BA.5, while XBB is derived (albeit indirectly) from BA.2, so our shots are not the best match. Still, antibody neutralization studies have shown that the shots provide protection against XBB, meaning some impact on XBB.1.5 is likely. This is a great time to get your booster if you haven’t yet.
What impact is XBB.1.5 currently having in the U.S.?
The subvariant caused about 28% of new cases in the week ending January 7, according to CDC estimates. These estimates have a fairly wide confidence interval, though, meaning that XBB.1.5’s true prevalence could be between 14% and 47%; the CDC will improve these estimates in the coming weeks as it collects more XBB.1.5 samples.
But we know with more confidence that XBB.1.5 has already taken over in the Northeast. It’s causing the vast majority of cases in HHS Region 1 (New England) and Region 2 (New York and New Jersey). Other mid-Atlantic states are catching up.
Some experts have noted that New York and other Northeast states are currently reporting rising COVID-19 hospitalizations, which could be a sign that XBB.1.5 causes more severe disease. It’s currently unclear how much the increased hospitalizations may be attributed to XBB.1.5’s presence, though, as the entire country is seeing this trend already in the wake of the holidays.
Sam Scarpino, a disease surveillance expert at Northeastern University, has a helpful Twitter thread explaining this issue. “It’s clear that XBB.1.5 is correlated [to] an increase in hospitalizations in many highly vaccinated states,” he writes. “I suspect it will hit harder in states with lower bivalent booster rates.”
1/ For those concerned about #XBB15 and hospitalizations, I think the evidence is more mixed than many are admitting.
While it's true hospitalizations are up in states like MA where XBB.1.5 is common, they are up across the entire US, even in states w/ little-to-no #XBB15! pic.twitter.com/LVrYqjn44K
Why has XBB.1.5’s prevalence been harder to pin down than other subvariants?
Many of the news articles you might have read this week about XBB.1.5 cited that the subvariant’s prevalence more than doubled in about one week, according to CDC estimates. But then the CDC’s estimates were revised down this week, suggesting that XBB.1.5 actually caused 18% of new cases in the last week of December—not 41%.
Why did the estimate change so dramatically? Well, it actually didn’t: as the CDC itself pointed out in its Weekly Review newsletter this Friday, the 41% estimate had a big confidence interval (23% to 61%), so the revision down to 18% was not far outside the existing realm of possibility. The CDC revises its variant estimates constantly as new data come in; this might be a bigger shift than we’re used to seeing, but it’s still pretty unsurprising.
The CDC’s variant forecasting team is also facing a couple of challenges unique to XBB.1.5 right now. First, this is a homegrown, U.S.-derived variant, so they don’t have a wealth of international sequences to analyze in preparation for a U.S. surge. And second, XBB.1.5 arose during the holidays, when a lot of COVID-19 testing and sequencing organizations were taking time off. The CDC is currently working with very limited data, but it will continue to revise estimates—and make them more accurate—as more test results come in.
For more info on the CDC’s process here, I recommend this Twitter thread from epidemiologist Duncan MacCannell:
The variant surveillance dashboard on the CDC COVID Data Tracker was just updated to include projections up to 1/7/2022; this is a weekly update that posts like clockwork every Friday. https://t.co/rnE66MCoHSpic.twitter.com/WGtfHix8va
How will XBB.1.5 impact the next phase of the pandemic?
Scientists will be closely watching to see how quickly XBB.1.5 spreads in other parts of the U.S., as well as how it performs in other countries that recently had surges of other Omicron subvariants.
Overall, the data we have about this subvariant so far suggest that it’s not distinct enough from other versions of Omicron to drive a massive new surge on the level of Omicron BA.1 last winter. But it’s still arriving in the wake of holiday travel and gatherings—and in a country that has largely abandoned public health measures that stop the virus from spreading.
In New York, for example, XBB.1.5 might not be the main cause of rising hospitalizations. Yet it is undoubtedly making more people sick with COVID-19, at a time when this region also faces continued healthcare pressure from flu and RSV. And an impending nurses’ strike won’t help the situation either, to put it mildly.
I think this Twitter thread from T. Ryan Gregory, an evolutionary biology expert who tracks coronavirus variants, is helpful at putting XBB.1.5 into context. This latest lineage follows other versions of Omicron that have kept the U.S. and other countries at relatively high levels of COVID-19 transmission throughout the last year. While our current moment may not look as dire as January 2022, we are currently seeing COVID-19 go up from an already-unsustainable baseline.
“BA.1 was the highest peak,” he writes, referring to 2022 in Canada and the U.K., “but the area under the curve of the others was as bad or worse.”
That said, I don't think "not as bad as the first Omicron wave" should be the standard. As noted, Canada, the UK, etc. had their deadliest year in 2022 through multiple Omicron waves. BA.1 was the highest peak, but the area under the curve of the others was as bad or worse. pic.twitter.com/5JwU857oHo
In the past week (December 29 through January 4), the U.S. officially reported about 470,000 new COVID-19 cases, according to the CDC. This amounts to:
An average of 67,000 new cases each day
143 total new cases for every 100,000 Americans
16% more new cases than last week (December 22-28)
In the past week, the U.S. also reported about 46,000 new COVID-19 patients admitted to hospitals. This amounts to:
An average of 6,500 new admissions each day
13.9 total admissions for every 100,000 Americans
16% more new admissions than last week
Additionally, the U.S. reported:
2,700 new COVID-19 deaths (390 per day)
28% of new cases are caused by Omicron XBB.1.5; 56% by BQ.1 and BQ.1.1; 5% by XBB (as of January 7)
An average of 150,000 vaccinations per day
Well, here we are: the winter COVID-19 surge. It may have happened later than some experts predicted, but the U.S. is clearly now experiencing an uptick in virus transmission as the latest, most contagious Omicron subvariants collide with holiday travel and gatherings.
You might notice that the CDC’s official case numbers didn’t rise too dramatically this week (though the national count is up 16% compared to last week). That’s unsurprising: case increases after holidays are always delayed, because many testing sites and public health officials take time off from processing new data. Christmas and New Year’s tend to deliver the worst of this trend—and in 2022, limited access to PCR testing made case numbers even less reliable.
Wastewater surveillance, on the other hand, clearly shows a significant rise in coronavirus spread from early December through early January—building on another rise that followed Thanksgiving. Biobot’s dashboard suggests that the U.S. as a whole is seeing about as much COVID-19 transmission now as we saw at the peak of the summer BA.5 wave. In some places, transmission is the highest it’s been since last January (during the original Omicron surge.)
The CDC’s wastewater data similarly show increasing COVID-19: out of 600 sites with available recent data, more than half were reporting upticks in the two-week period ending January 2. 117 of those sites reported an increase between 100% and 999%, and 87 reported an increase over 1,000%.
Regionally, the Northeast has reported the biggest recent COVID-19 spike in wastewater, though the trend may already be turning around. We see this both in Biobot’s regional data and in individual cities and counties, like Boston and New York City. The Northeast is also a hotspot for XBB.1.5, a homegrown Omicron subvariant that’s spreading faster than other lineages. (More on that later in the issue.)
In addition to the wastewater surveillance, hospitalization data have remained uninterrupted by the holidays with clear increases in COVID-19 patients through December and into this week. This week, about 6,600 new COVID-19 patients were admitted to hospitals nationwide, a 16% increase from the prior week and about twice the number of people admitted during the week before Thanksgiving.
Washington D.C., Connecticut, Massachusetts, and West Virginia reported the highest rates of new COVID-19 patients in the week ending January 3, according to the latest Community Profile Report. They were followed by other Northeast states New Jersey, New York, and Delaware. But states reporting the highest increases in hospitalization are in the South: Louisiana, Mississippi, Florida, Texas.
Two pieces of good news for this week: the flu and RSV are both trending down after their surges earlier in the fall. High levels of influenza-like activity remain in the majority of states, though. And we may see a second flu peak driven by a second strain, as Katelyn Jetelina reports in Your Local Epidemiologist.
All the same safety measures we know and love—masks, testing, vaccinations, etc.—continue to help reduce the risk of COVID-19 and other viruses. But uptake of these measures remains low. As of January 5, only 15% of the eligible U.S. population has received an Omicron-specific booster dose, per the CDC.
Biobot’s wastewater surveillance data suggest that COVID-19 spread is trending down in the West coast and plateauing in other regions. Data as of December 15.
In the past week (December 8 through 14), the U.S. reported about 460,000 new COVID-19 cases, according to the CDC. This amounts to:
An average of 65,000 new cases each day
139 total new cases for every 100,000 Americans
3% fewer new cases than last week (December 1-7)
In the past week, the U.S. also reported about 35,000 new COVID-19 patients admitted to hospitals. This amounts to:
An average of 5,000 new admissions each day
10.7 total admissions for every 100,000 Americans
2% more new admissions than last week
Additionally, the U.S. reported:
2,700 new COVID-19 deaths (390 per day)
69% of new cases are caused by Omicron BQ.1 and BQ.1.1; 5% by BF.7; 7% by XBB (as of December 17)
An average of 250,000 vaccinations per day (CDC link)
After a significant post-Thanksgiving spike, COVID-19 transmission in the U.S. appears to be in a high plateau, according to trends in cases and wastewater. Official case counts stayed fairly steady this week compared to the week following the holiday, according to the CDC, while wastewater data from Biobot show coronavirus concentrations leveling out.
COVID-19 hospital admissions are similarly at a high plateau: about 5,000 new people with COVID-19 were admitted to hospitals every day last week, per the CDC. That’s a 2% increase from last week.
Going beyond the national trends, though, we see that some places are experiencing dips in COVID-19 spread while others are spiking. In Boston, for example, wastewater data suggest that COVID-19 is at its most prevalent since the surge in early summer. Across the country in Los Angeles, coronavirus levels in wastewater are trending down after increasing through November.
New York and New Jersey had the highest official COVID-19 case rates in the last week, according to the latest Community Profile Report, followed by Illinois, California, and Rhode Island. But these data may be more a product of which states still have somewhat-available PCR testing than actual case comparisons.
And even in places where COVID-19 is declining, the combined threat of this virus, flu, and RSV is still putting a lot of strain on healthcare systems. Take Los Angeles: while it might not be seeing record COVID-19 cases, the city currently has fewer free hospital beds available than at any other point in the pandemic, per reporting by the Los Angeles Times.
Flu might be peaking in some parts of the country, Helen Branswell wrote in STAT on Friday, based on CDC data. But it’s still early in the typical flu season, and hard to tell how COVID-19 and the flu (and RSV) might impact each other.
As we gear up for another week of holiday travel and gatherings—and as highly contagious Omicron subvariants, the BQs and XBB, continue to outcompete other versions of the virus—this is an important time to take all possible safety precautions.
That includes getting your flu shot and the new Omicron-specific COVID-19 booster, which further CDC studies have shown is highly effective at preventing hospitalization. And it includes masking, testing before and after events, and gathering outdoors (or otherwise improving ventilation) to reduce your risk of spreading all kinds of viruses.
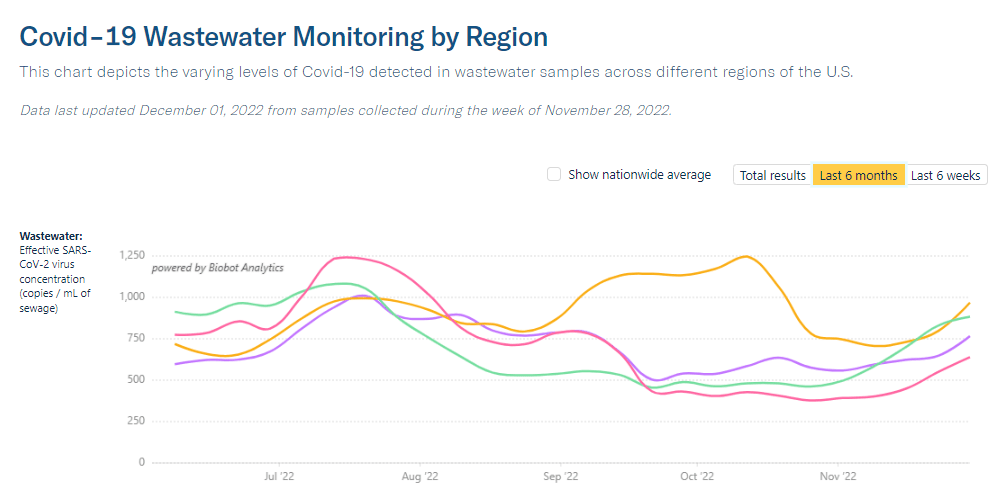
All four major regions of the country are reporting increased coronavirus levels in their wastewater, per Biobot. Data as of November 28.
In the past week (November 24 through 30), the U.S. reported about 303,000 new COVID-19 cases, according to the CDC. This amounts to:
An average of 43,000 new cases each day
92 total new cases for every 100,000 Americans
1% fewer new cases than last week (November 17-23)
In the past week, the U.S. also reported about 29,000 new COVID-19 patients admitted to hospitals. This amounts to:
An average of 4,200 new admissions each day
9.0 total admissions for every 100,000 Americans
18% more new admissions than last week
Additionally, the U.S. reported:
1,800 new COVID-19 deaths (250 per day)
63% of new cases are caused by Omicron BQ.1 and BQ.1.1; 6% by BF.7; 5% by BN.1; 6% by XBB (as of December 3)
An average of 200,000 vaccinations per day
If the U.S. wasn’t at the start of a COVID-19 surge before Thanksgiving, we’re certainly in one now. While official case counts have stagnated, wastewater surveillance indicates that the country is seeing about 1.5 times the coronavirus transmission that we had three weeks ago, according to data from Biobot.
All four major regions of the country are experiencing clear upward trends in COVID-19 spread, per Biobot, with no sign of peaking; this is the first time there’s been a unified national increase since mid-summer. Individual metropolitan areas from Boston, to the Twin Cities in Minnesota, to Los Angeles, are reporting major upticks.
The current difference between wastewater surveillance trends and case trends further confirms what I’ve been saying for months: case data simply are no longer that helpful for seeing early warnings of surges, as few people seek out PCR testing compared to earlier points in the pandemic. If you don’t already have a good place to see wastewater data for your community, put some pressure on your local officials to make this information available.
The U.S.’s new increase in transmission can likely be attributed to travel and gatherings over the Thanksgiving holiday, combined with newer, more-transmissible versions of Omicron. Lineages BQ.1 and BQ.1.1 caused almost two-thirds of new cases in the week ending December 3, according to CDC estimates, while XBB caused about 6% of new cases.
XBB has been spreading intensely in some Asian countries, and experts are watching to see how it competes with the alphabet soup of subvariants already circulating in the U.S. So far, it is most prevalent in the Northeast, per the CDC.
In addition to wastewater trends, new hospital admissions for COVID-19 went up this week: about 18% more patients were admitted to hospitals around the country in the week ending November 30 compared to the prior week. These patients are entering a hospital system already overwhelmed by flu, RSV, and other respiratory viruses.
As epidemiologist Caitlin Rivers noted in her newsletter last week: “The cumulative hospitalization rate for influenza is already on par with where we would expect to be in December or January.” And that virus continues to spread further, with most of the country experiencing high or very high levels of influenza-like activity.
COVID-19 and these other viruses might not seem like a big deal thanks to vaccines and treatments, but they can still have very severe consequences. For example, New York City just reported that three children died of COVID-19 in recent weeks. And the risk of Long COVID remains, too.
I still see zero media mentions of the fact that three children have died of covid in NYC in the last week and a half.
Hardly anyone I know has any idea.
Seems like something people should know, so they can make adjustments for their family’s personal safety if they need to.