In the past week (December 29 through January 4), the U.S. officially reported about 470,000 new COVID-19 cases, according to the CDC. This amounts to:
- An average of 67,000 new cases each day
- 143 total new cases for every 100,000 Americans
- 16% more new cases than last week (December 22-28)
In the past week, the U.S. also reported about 46,000 new COVID-19 patients admitted to hospitals. This amounts to:
- An average of 6,500 new admissions each day
- 13.9 total admissions for every 100,000 Americans
- 16% more new admissions than last week
Additionally, the U.S. reported:
- 2,700 new COVID-19 deaths (390 per day)
- 28% of new cases are caused by Omicron XBB.1.5; 56% by BQ.1 and BQ.1.1; 5% by XBB (as of January 7)
- An average of 150,000 vaccinations per day
Well, here we are: the winter COVID-19 surge. It may have happened later than some experts predicted, but the U.S. is clearly now experiencing an uptick in virus transmission as the latest, most contagious Omicron subvariants collide with holiday travel and gatherings.
You might notice that the CDC’s official case numbers didn’t rise too dramatically this week (though the national count is up 16% compared to last week). That’s unsurprising: case increases after holidays are always delayed, because many testing sites and public health officials take time off from processing new data. Christmas and New Year’s tend to deliver the worst of this trend—and in 2022, limited access to PCR testing made case numbers even less reliable.
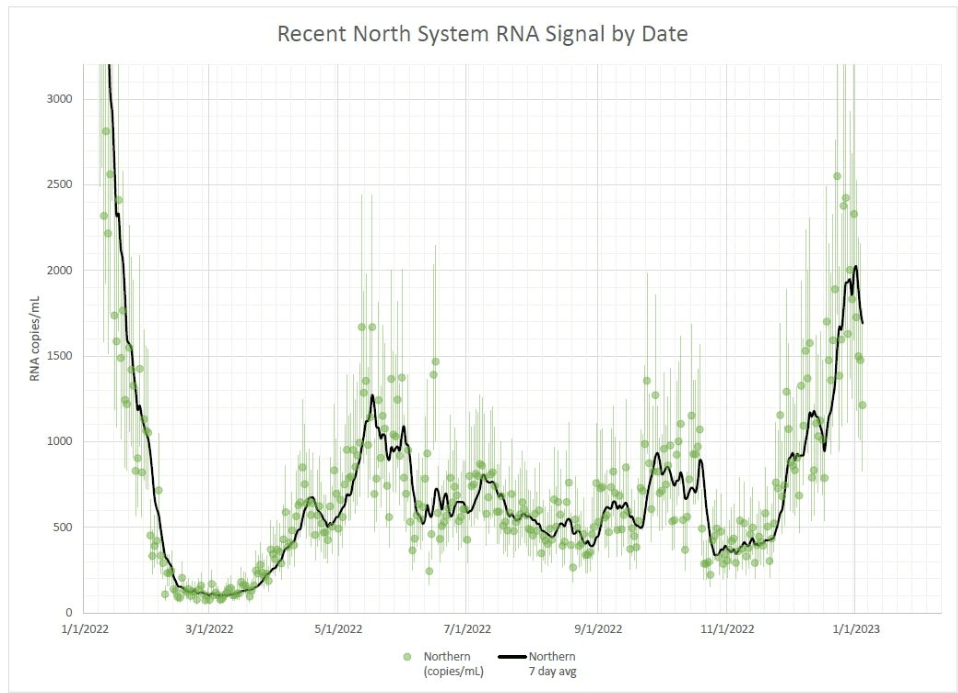
Wastewater surveillance, on the other hand, clearly shows a significant rise in coronavirus spread from early December through early January—building on another rise that followed Thanksgiving. Biobot’s dashboard suggests that the U.S. as a whole is seeing about as much COVID-19 transmission now as we saw at the peak of the summer BA.5 wave. In some places, transmission is the highest it’s been since last January (during the original Omicron surge.)
The CDC’s wastewater data similarly show increasing COVID-19: out of 600 sites with available recent data, more than half were reporting upticks in the two-week period ending January 2. 117 of those sites reported an increase between 100% and 999%, and 87 reported an increase over 1,000%.
Regionally, the Northeast has reported the biggest recent COVID-19 spike in wastewater, though the trend may already be turning around. We see this both in Biobot’s regional data and in individual cities and counties, like Boston and New York City. The Northeast is also a hotspot for XBB.1.5, a homegrown Omicron subvariant that’s spreading faster than other lineages. (More on that later in the issue.)
In addition to the wastewater surveillance, hospitalization data have remained uninterrupted by the holidays with clear increases in COVID-19 patients through December and into this week. This week, about 6,600 new COVID-19 patients were admitted to hospitals nationwide, a 16% increase from the prior week and about twice the number of people admitted during the week before Thanksgiving.
Washington D.C., Connecticut, Massachusetts, and West Virginia reported the highest rates of new COVID-19 patients in the week ending January 3, according to the latest Community Profile Report. They were followed by other Northeast states New Jersey, New York, and Delaware. But states reporting the highest increases in hospitalization are in the South: Louisiana, Mississippi, Florida, Texas.
Two pieces of good news for this week: the flu and RSV are both trending down after their surges earlier in the fall. High levels of influenza-like activity remain in the majority of states, though. And we may see a second flu peak driven by a second strain, as Katelyn Jetelina reports in Your Local Epidemiologist.
All the same safety measures we know and love—masks, testing, vaccinations, etc.—continue to help reduce the risk of COVID-19 and other viruses. But uptake of these measures remains low. As of January 5, only 15% of the eligible U.S. population has received an Omicron-specific booster dose, per the CDC.

Leave a comment