
In the past week (March 9 through 15), the U.S. officially reported about 150,000 new COVID-19 cases, according to the CDC. This amounts to:
- An average of 21,000 new cases each day
- 46 total new cases for every 100,000 Americans
- 20% fewer new cases than last week (March 2-8)
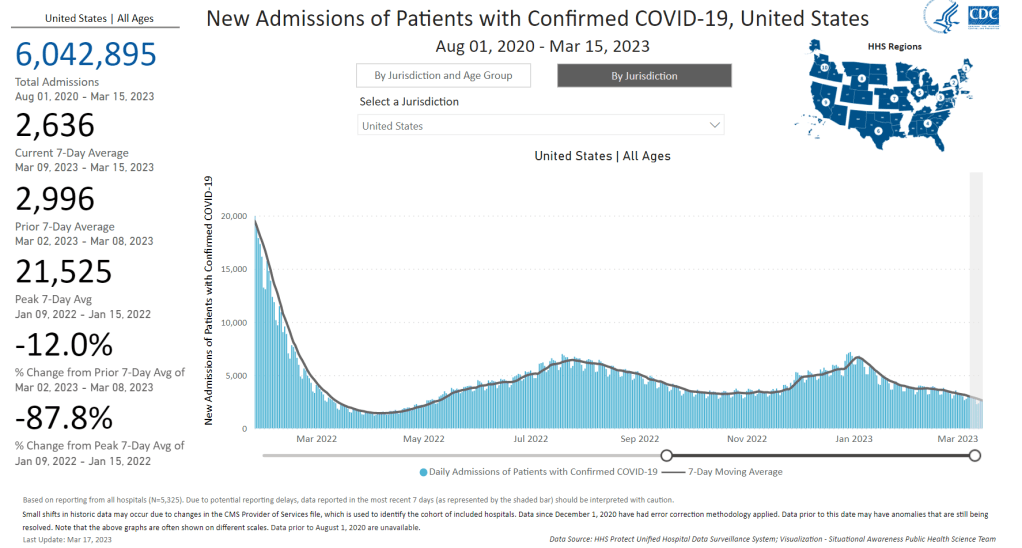
In the past week, the U.S. also reported about 19,000 new COVID-19 patients admitted to hospitals. This amounts to:
- An average of 2,800 new admissions each day
- 5.9 total admissions for every 100,000 Americans
- 10% fewer new admissions than last week
Additionally, the U.S. reported:
- 1,700 new COVID-19 deaths (240 per day)
- 90% of new cases are caused by Omicron XBB.1.5; 2% by XBB.1.5.1; 0.5% by CH.1.1 (as of March 18)
- An average of 40,000 vaccinations per day
The trend continues: COVID-19 spread is still on the decline across the U.S., but it’s a slow decline. These updates are getting pretty repetitive to write, as we’ve been seeing this pattern since late January—which, honestly, I’m taking as a good sign.
Last week, I noted that the drop in official COVID-19 cases (reported to the CDC) was exaggerated slightly because of data delays; three states didn’t report cases in the week ending March 8. This week, the same thing happened for three different states: Texas, Arkansas, and Indiana. We’ll likely continue to see reporting issues like this, as state and local health departments put fewer resources into tracking COVID-19.
Even so, the official case data, hospital admissions, and wastewater surveillance all point to continued decreases in coronavirus transmission. National hospital admissions dropped by about 12% this week compared to the week prior. But there are still a lot of Americans getting severe COVID-19 symptoms, with more than 3,000 people newly hospitalized each week for the last month.
Wastewater surveillance data from Biobot suggest that coronavirus spread is getting lower, but it’s still at much higher levels nationally than we saw at this time in 2021 and 2022. Regionally, the Midwest now has slightly more virus circulating than other parts of the country, but all four major regions are seeing slow declines or plateaus.
In other good news: flu activity is still low nationally, according to the CDC’s flu surveillance. Experts had worried we might see a second flu surge, driven by a different strain of the influenza virus, after the initial surge died down in January. But so far, that hasn’t happened. Almost every state reported moderate or low levels of influenza-like activity in the week ending March 11.
XBB.1.5 continues to be the dominant coronavirus lineage in the U.S., causing an estimated 90% of cases nationwide in the week ending March 18. XBB.1.5.1, a descendant of XBB.1.5, is growing slowly (it caused an estimated 2% of cases nationwide this week) and doesn’t seem to be very competitive yet. The CDC also has yet to break out XBB.1.9 or XBB.1.16, other subvariants that mutated from XBB.
Yesterday, I spoke about wastewater surveillance at New York City School of Data, a civic conference that’s part of the city’s Open Data Week. While the conference wasn’t focused on health or science topics, the organizers required masks and checked attendees’ vaccinations. I also brought my CO2 monitor to the event, and found ventilation was generally good in the session rooms. This conference was a nice reminder that some organizations are still following the data and science on COVID-19 precautions.

Leave a comment