Tag: Wastewater

  • National numbers, December 4

    National numbers, December 4

    All four major regions of the country are reporting increased coronavirus levels in their wastewater, per Biobot. Data as of November 28.

    In the past week (November 24 through 30), the U.S. reported about 303,000 new COVID-19 cases, according to the CDC. This amounts to:

    • An average of 43,000 new cases each day
    • 92 total new cases for every 100,000 Americans
    • 1% fewer new cases than last week (November 17-23)

    In the past week, the U.S. also reported about 29,000 new COVID-19 patients admitted to hospitals. This amounts to:

    • An average of 4,200 new admissions each day
    • 9.0 total admissions for every 100,000 Americans
    • 18% more new admissions than last week

    Additionally, the U.S. reported:

    • 1,800 new COVID-19 deaths (250 per day)
    • 63% of new cases are caused by Omicron BQ.1 and BQ.1.1; 6% by BF.7; 5% by BN.1;  6% by XBB (as of December 3)
    • An average of 200,000 vaccinations per day

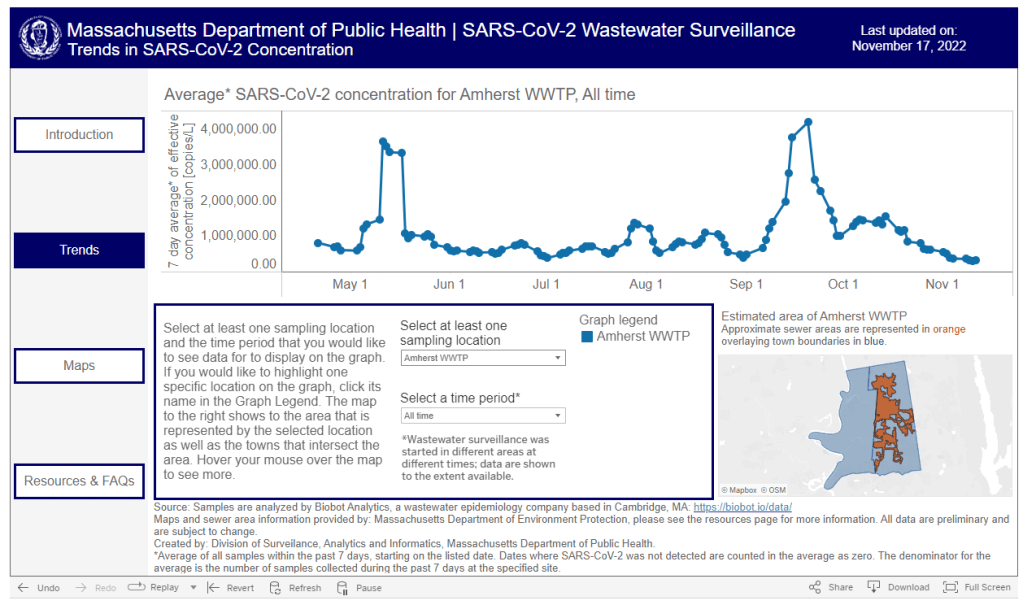
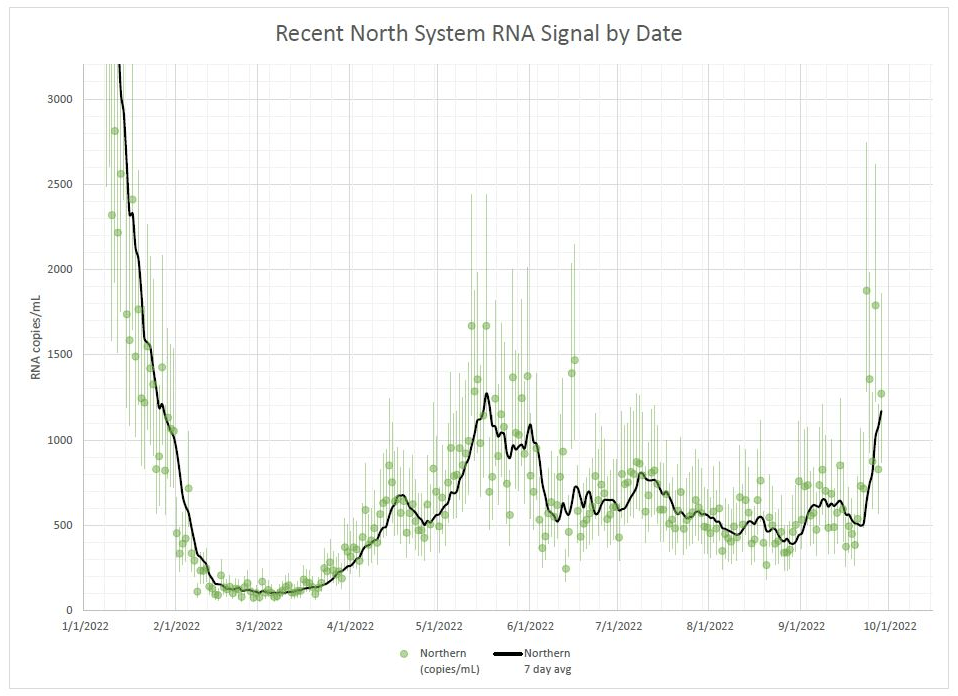
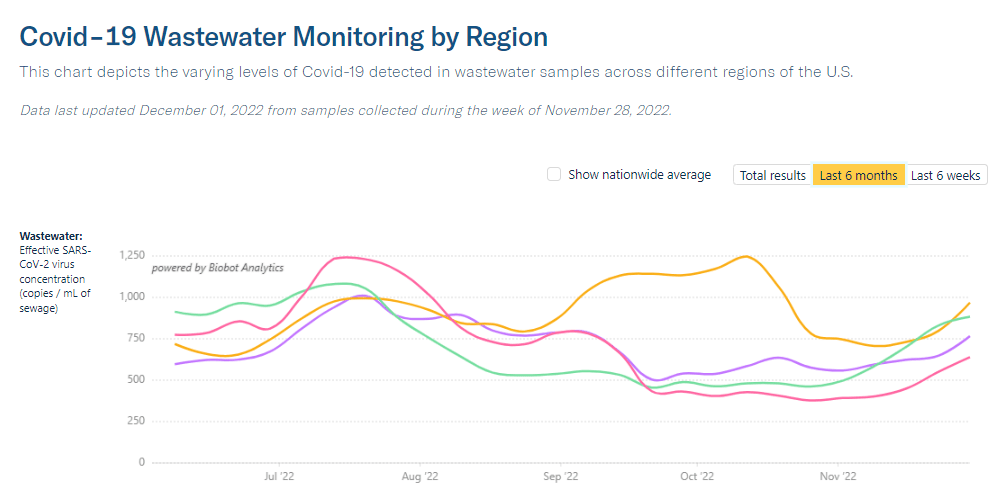
    If the U.S. wasn’t at the start of a COVID-19 surge before Thanksgiving, we’re certainly in one now. While official case counts have stagnated, wastewater surveillance indicates that the country is seeing about 1.5 times the coronavirus transmission that we had three weeks ago, according to data from Biobot.

    All four major regions of the country are experiencing clear upward trends in COVID-19 spread, per Biobot, with no sign of peaking; this is the first time there’s been a unified national increase since mid-summer. Individual metropolitan areas from Boston, to the Twin Cities in Minnesota, to Los Angeles, are reporting major upticks.

    The current difference between wastewater surveillance trends and case trends further confirms what I’ve been saying for months: case data simply are no longer that helpful for seeing early warnings of surges, as few people seek out PCR testing compared to earlier points in the pandemic. If you don’t already have a good place to see wastewater data for your community, put some pressure on your local officials to make this information available.

    The U.S.’s new increase in transmission can likely be attributed to travel and gatherings over the Thanksgiving holiday, combined with newer, more-transmissible versions of Omicron. Lineages BQ.1 and BQ.1.1 caused almost two-thirds of new cases in the week ending December 3, according to CDC estimates, while XBB caused about 6% of new cases.

    XBB has been spreading intensely in some Asian countries, and experts are watching to see how it competes with the alphabet soup of subvariants already circulating in the U.S. So far, it is most prevalent in the Northeast, per the CDC.

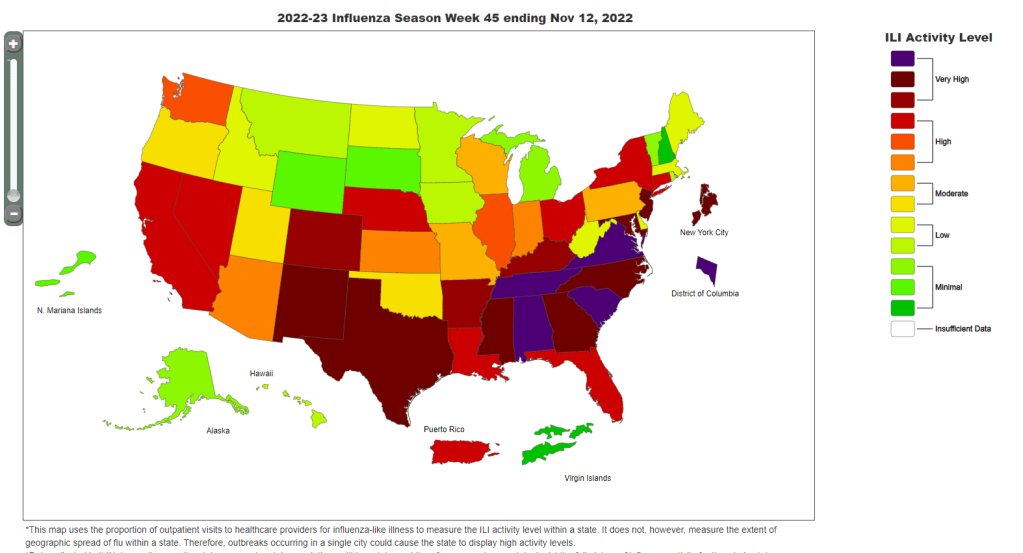
    In addition to wastewater trends, new hospital admissions for COVID-19 went up this week: about 18% more patients were admitted to hospitals around the country in the week ending November 30 compared to the prior week. These patients are entering a hospital system already overwhelmed by flu, RSV, and other respiratory viruses.

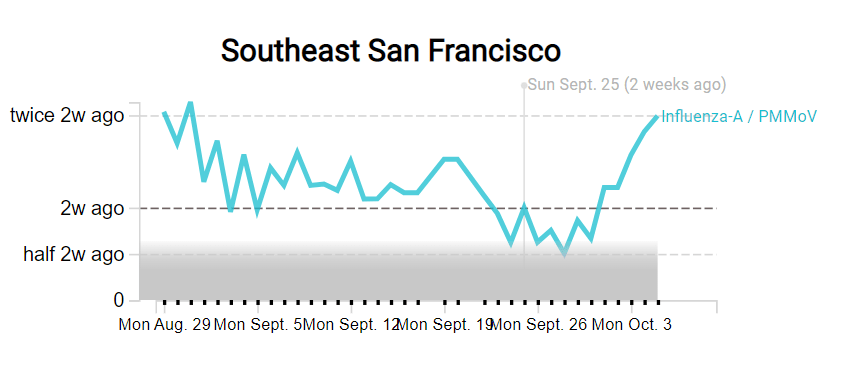
    As epidemiologist Caitlin Rivers noted in her newsletter last week: “The cumulative hospitalization rate for influenza is already on par with where we would expect to be in December or January.” And that virus continues to spread further, with most of the country experiencing high or very high levels of influenza-like activity.

    COVID-19 and these other viruses might not seem like a big deal thanks to vaccines and treatments, but they can still have very severe consequences. For example, New York City just reported that three children died of COVID-19 in recent weeks. And the risk of Long COVID remains, too.

  • Where to find wastewater data for your community

    Where to find wastewater data for your community

    The Massachusetts Department of Public Health is one of the latest state agencies to set up a public wastewater dashboard.

    As we head into the holidays with limited COVID-19 testing and undercounted case numbers, wastewater surveillance is the best way to evaluate how much the virus is spreading in your region. And it’s now available in more places than ever, thanks to the many research groups and public health agencies setting up sewage testing.

    To help you find wastewater surveillance in your area, I recently updated my COVID-19 Data Dispatch resource page about U.S. wastewater dashboards. The page includes links to and notes about national, state, and a few local dashboards.

    Let’s review the options. First, there are now three national dashboards with U.S. wastewater data, each covering a different set of locations.

    • The CDC’s National Wastewater Surveillance System is the biggest, including more than 1,000 sites from almost every state, though some states have far better coverage than others. Click on an individual site to see coronavirus trends for that location.
    • Biobot Analytics is the biggest private company doing wastewater surveillance; it provides analysis for hundreds of sites in the CDC NWSS network as well as its own, separate network. Biobot’s national and regional data (which include NWSS sites) are particularly helpful for large-scale trends.
    • WastewaterSCAN is a project that started from an academic partnership between Stanford University, Emory University, the University of Michigan, and communities in California. It’s since expanded to include sites in about 20 states, and participating sewersheds are tested for monkeypox, flu, and RSV in addition to the coronavirus.

    Second, 21 states currently have their own wastewater dashboards or reporting systems. If this is available in your area, I highly recommend looking at your local dashboard in addition to the national options. State and local dashboards tend to include more detailed and/or more frequently updated data, and are often tailored to their community’s needs more closely.

    These are the states with wastewater dashboards; see the resource page for links and more info:

    • California, Colorado, Georgia, Hawaii, Idaho, Indiana, Maine, Maryland, Massachusetts, Michigan, Minnesota, Missouri, Nebraska, New York State, North Carolina, Ohio, Oklahoma, Oregon, Utah, West Virginia, Wisconsin.

    Wastewater trends do not correspond directly to infection trends, because people sick with COVID-19 might shed the virus at different rates (based on where they are in their infection, variants, and other factors). Some researchers are working to better understand the correlation between wastewater trends and cases, but for now, the sewage data are best understood as a broad indicator of risk—not a precise estimate of how many people in your community are sick.

    For tips on interpreting wastewater data, I recommend looking at past COVID-19 Data Dispatch posts on this topic, as well as this FAQ from the People’s CDC.

    More wastewater data

  • National numbers, November 20

    National numbers, November 20

    Data from the CDC indicate that much of the country is seeing high flu levels. Chart as of November 12.

    In the past week (November 10 through 16), the U.S. reported about 280,000 new COVID-19 cases, according to the CDC. This amounts to:

    • An average of 40,000 new cases each day
    • 86 total new cases for every 100,000 Americans
    • 3% fewer new cases than last week (November 3-9)

    In the past week, the U.S. also reported about 24,000 new COVID-19 patients admitted to hospitals. This amounts to:

    • An average of 3,400 new admissions each day
    • 7.3 total admissions for every 100,000 Americans
    • 1% fewer new admissions than last week

    Additionally, the U.S. reported:

    • 2,200 new COVID-19 deaths (320 per day)
    • 50% of new cases are caused by Omicron BQ.1 and BQ.1.1; 8% by BF.7; 5% by BN.1;  2% by BA.2.75 and BA.2.75.2 (as of November 19)
    • An average of 400,000 vaccinations per day

    Nationwide, reported COVID-19 cases and new hospital admissions are still in a plateau; both metrics declined very slightly this week after rising slightly last week (declining by 3% and 1%, respectively).

    While we have yet to see as clear of a fall/winter surge as we did in the last two years, infection levels are still quite high. Evidence for this comes from wastewater data, which doesn’t rely on people getting PCR tests; trends from Biobot suggest that viral transmission is at a similar level to late October/early November of last year, when Delta was still the dominant variant.

    Biobot’s data also indicate that the West coast region is now seeing a notable uptick in COVID-19 spread, taking over from the Northeast (which has been a regional hotspot since September). Wastewater testing sites in cities like Los Angeles is reporting significant transmission spikes in the last couple of weeks.

    The West coast, like the Northeast, has been a hotspot for newer Omicron subvariants BQ.1 and BQ.1.1, according to CDC estimates. Nationwide, the BQ lineage caused about half of new cases in the last week—solidly outcompeting its parent lineage, BA.5. And there are several other Omicron subvariants spreading, including two lineages from BA.2, BF.7 and BN.1.

    With all these new variants circulating and colder weather throughout the country, why haven’t we seen a significant jump in COVID-19 spread? It’s possible that the U.S. has enough prior immunity from vaccinations and past infections to prevent a big surge, White House COVID-19 coordinator Ashish Jha said at the STAT Summit last week.

    I hope Jha is right, but I personally remain skeptical. Way too few people have received the new booster shots that protect against Omicron variants, while we’re heading into several weeks of holiday travel and gatherings—with fewer COVID-19 protections than in the last two years.

    At the same time, the U.S. is dealing with flu and RSV surges. About a dozen states, plus New York City and Washington, D.C., reported “very high” levels of influenza-like activity in the week ending November 12, according to the CDC. And the country’s RSV wave continues at high intensity, though it might be reaching its peak.

    These two respiratory diseases may be less severe than COVID-19 at an individual level (especially accounting for the burden of Long COVID), but they can still put intense pressure on healthcare systems—especially those focused on treating children. Wearing a mask, avoiding indoor crowds, improving ventilation, and other measures can protect against all three diseases.

  • Sources and updates, November 13

    • Updated booster doses by state: This week, the CDC started reporting how many people have received the bivalent, Omicron-specific boosters by state, including state-level data for several demographic groups (over age 5, over 12, over 18, and over 65). The numbers are low: Vermont and Washington, D.C. have the highest booster rates as of November 9, with 21% and 20% of their populations receiving the bivalent shots, respectively. In about half of states, less than 10% of the population has received an updated booster. (H/t Jason Salemi.)
    • Additional data suggests new boosters work against BQs: Speaking of the updated booster shots, a recent preprint from researchers at Emory University, Stanford University, and the NIH found that the new boosters produced several times more neutralizing antibodies against subvariants BQ.1.1 and BA.2.75.2 compared to the older vaccines. This was a small lab study and hasn’t yet been peer-reviewed, but it follows similar evidence from other research suggesting that the new boosters do provide additional protection against the most concerning variants currently circulating in the U.S. (See last week’s post.) If you haven’t gotten a bivalent booster yet, now is a good time!
    • More evidence that masks in schools prevent COVID-19 spread: Another notable new study this week, published in the New England Journal of Medicine: a group of researchers from Boston institutions examined the differences in COVID-19 case numbers between public school districts that kept mask requirements in place during spring 2022, and those that lifted their requirements upon a statewide policy change in February. Overall, ending required masking led to “an additional 44.9 COVID-19 cases per 1,000 students and staff” during the remainder of the semester, the researchers found. The study demonstrates that masks are still a useful public health strategy to reduce illness—and risk of Long COVID—in schools.
    • Paxlovid may reduce Long COVID risk: When Paxlovid first became available earlier in the year, some Long COVID patients reported that the drug helped alleviate their symptoms. A new study from Ziyad Al-Aly and his team at the Veterans Affairs St. Louis healthcare system provides evidence behind the anecdotal reports, finding that veterans treated with Paxlovid had a 25% lower risk of long-term symptoms, based on their electronic health records. The study has received some criticism (and has not yet been peer-reviewed); to me, it provides motivation for actual clinical trials examining Paxlovid’s use for treating Long COVID. RECOVER is running one such trial, but it won’t start until early 2023.
    • Estimating COVID-19 infections from wastewater: And one more study that caught my attention this week: researchers at the University of Florida used a modeling technique called a “mass balance equation” to estimate how many people in Gainseville, Florida were sick with COVID-19 based on the virus’ concentration in wastewater. Using about one year of wastewater data (May 2020 to May 2021), the researchers were able to accurately predict actual infections with an error of just 1%. Translating wastewater data into useful information for public health action has been a major challenge for the growing field, so I was glad to see this study providing a potentially-useful method.

  • COVID source shout-out: New York wastewater dashboard

    COVID source shout-out: New York wastewater dashboard

    The New York State wastewater dashboard is one of my favorite local data sources. Screenshot taken on November 6.

    I look at a lot of wastewater surveillance dashboards these days—sometimes reporting on this type of COVID-19 data, sometimes trying to gauge my own risk level. The New York State Wastewater Surveillance Network’s dashboard is one of my favorites, both because I like how it’s set up and because of location bias (i.e. I live in New York).

    The New York State network is a collaboration between state agencies and researchers at Syracuse University, the State University of New York, and others. It covers every single county in the state; most wastewater treatment plants included work directly with the researchers, with the exception of New York City (which does its own sampling and sends data to the state team).

    On the dashboard, you can see the coronavirus detection levels and recent trends for every county. Then, upon clicking on a specific wastewater treatment plant, you can see time series of both coronavirus concentration in wastewater and reported COVID-19 cases. Seeing the time series is pretty important because it provides broader context on how current coronavirus levels compare to past trends.

    NYC used to not be included on this dashboard, but the NYC sites were added in recent weeks. To me, this is a pretty big deal because the city doesn’t have its own wastewater dashboard (yet). For now, I’m adding the state dashboard to my regular rotation of local data sources.

  • The U.S.’s flu and RSV surveillance is insufficient for tracking this fall’s outbreaks

    The U.S.’s flu and RSV surveillance is insufficient for tracking this fall’s outbreaks

    The CDC’s FluView dashboard does not provide precise case numbers, only an approximation of “activity level.”

    I recently received a question from a reader, asking how to follow both COVID-19 and the flu in the county where she lives. For COVID-19, county-level data sources aren’t too hard to find: the CDC still provides some clinical data—though case numbers are now updated weekly, instead of daily—and many counties have wastewater surveillance available. (See last week’s post for more details.)

    But following flu transmission is much harder: there’s no county-level tracking of this virus. The same thing goes for respiratory syncytial virus (RSV), a virus currently sending record cases to children’s hospitals across the country. There are a few data sources available, which I’ll list later in this post, though nothing as comprehensive as what we’ve come to expect for COVID-19.

    As I’ve previously written, the COVID-19 pandemic inspired nationwide disease surveillance at a level the U.S. has never seen before. The healthcare and public health systems had not previously attempted to count up every case of a widely-spreading virus and share that information back to the public in close-to-real-time.

    It’s unlikely that flu, RSV, and other diseases will get the same resources as COVID-19 did for intensive tracking—at least not in the near future. But the scale of data we’ve had during the pandemic reveals that our current surveillance for these diseases is pretty inadequate, even for such basic purposes as giving hospitals advanced warning about new surges. 

    Insufficient RSV data

    A recent CNN story by Deidre McPhillips and Jacqueline Howard explains how data gaps have hindered preparation for the current RSV surge. The reporters explain that the CDC’s RSV data are “based on voluntary reporting from a few dozen labs that represent about a tenth of the population.” The CDC uses these reports to provide weekly estimates about RSV cases, though recent data tend to be incomplete due to reporting delays.

    Here’s a helpful quote from the story (though I recommend reading the whole piece):

    “For hospitals [using CDC data], it’s a little like looking through the rearview mirror. They’ve already begun to experience that uptick in cases themselves before it’s noticeable in the federal data,” said Nancy Foster, vice president for quality and patient safety with the American Hospital Association.

    “We’re talking about data that are collected inside hospitals, transmitted through a data trail to get to the federal government, analyzed there and then fed back to hospitals.”

    In other words, it’s not surprising that we saw plenty of stories about higher-than-normal RSV cases in children’s hospitals before national data actually picked up the surge. For more details on why RSV is spreading this fall and how it’s impacting children’s hospitals, I recommend this piece by Jonathan Lambert at Grid.

    Insufficient flu data

    Meanwhile, this year’s flu season is clearly starting earlier than normal; but current data aren’t able to tell us how severe the season might get or who, exactly, is being hit the hardest. According to the CDC’s flu surveillance report for this week, the agency estimates that the U.S. has seen “at least 880,000 flu illnesses, 6,900 hospitalizations, and 360 deaths from flu” so far this fall.

    The CDC’s estimates come from networks of testing labs, hospitals, and outpatient healthcare providers that participate in the agency’s flu surveillance networks. National flu data tend to be imprecise estimates, clearly labeled as “preliminary” by the CDC, while state-by-state data are estimates reported with delays. Note, for example, that the CDC’s map of “influenza-like-activity” by state and by metro area provides only general categories of activity (ranging from “minimal” to “very high”) rather than actual case numbers.

    The flu data we have so far aren’t sufficient for making predictions about how the rest of this fall and winter will go, explains STAT’s Helen Branswell in a recent story. “The virus is maddeningly unpredictable,” she writes. U.S. experts often look to the flu season in the Southern Hemisphere, which precedes ours, for clues, but this can be unreliable (just as the U.S. shouldn’t rely on other countries for all its vaccine effectiveness data).

    For both flu and RSV, one major problem with our surveillance methods is that our systems overly rely on healthcare centers. When public health agencies have to wait for hospitals and clinics to report cases of these viruses before starting to analyze data, they miss the opportunity to warn healthcare providers at the very beginning of a surge—and give them time to prepare.

    In the future, expanding non-clinical surveillance methods like wastewater and population surveys to these diseases would provide more data, more quickly; both for healthcare providers and for the general public. (I provided some more specific ideas here.)

    Existing sources

    With all the above caveats in mind, here are a few sources you can look at to track flu and RSV:

    • CDC’s weekly flu surveillance report: This page is updated once a week with national estimates of flu activity, hospitalizations, flu virus variants, and more. Data tend to be preliminary.
    • CDC’s FluView dashboard: Information from the CDC’s flu surveillance system also appears on this dashboard in a more interactive format; for example, you can see how flu activity by state has changed over time.
    • CDC’s RSV trends report: Similar to its flu reports, the CDC provides weekly updates of estimated RSV tests and cases, including national, regional, and state-by-state trends.
    • Walgreens flu index: Walgreens tracks prescriptions for antiviral medications at its pharmacies as a proxy for flu activity, by state and for select metro areas. For more information on the index, see this press release.
    • WastewaterSCAN: The SCAN network, run by researchers at Stanford University and Emory University, tests wastewater for flu, RSV, and monkeypox in addition to COVID-19 in select counties across the U.S. So far, this network is the first I know of to publicly share flu and RSV wastewater data, though other researchers are working in this area.

    Please let me know if I missed any data sources! (You can email me or comment below.)

    More federal data

  • Interpreting COVID-19 data as the CDC goes weekly and a fall surge approaches

    Interpreting COVID-19 data as the CDC goes weekly and a fall surge approaches

    As of this week, the CDC has switched to reporting COVID-19 cases and deaths on a weekly basis.

    As of this Thursday, the CDC is updating COVID-19 case and death data every week instead of every day. Here are some thoughts on interpreting COVID-19 data in the wake of this change, citing an article I recently wrote for The Atlantic.

    To me, the CDC’s shift to weekly updates feels like the end of an era for tracking COVID-19. While I understand the change, considering both our less-complete case information and other data analysis needs for the agency, I can’t help but wish we had a national public health agency with enough resources to continue providing us with frequent, reliable information on this ongoing pandemic. After all, shouldn’t that be the CDC’s job?

    The CDC has clearly deprioritized two major metrics (cases and deaths) that used to be the first places people looked to see the pandemic’s impact on their communities. Instead, the agency now points us to hospitalization metrics, variant surveillance, and wastewater—all metrics that are certainly useful, but may be harder for the average user to interpret.

    And even the case data we do have are quite unreliable at this point, as PCR tests become less and less accessible compared to rapid tests. Case numbers may be underreported by twenty times or more; it’s difficult to even get a good estimate of how far off the numbers are. Public communications like the CDC’s “Weekly Review” report fail to acknowledge this problem, and the agency does not appear to be making any effort to determine the true infection rates right now. 

    Through its current data communication choices, the CDC seems to be saying, “If you still care about keeping track of COVID-19, you’re on your own.” Even though we are likely heading for a fall surge and many people need to keep track of this disease in order to keep their communities safe.

    In absence of useful information from our public health leaders, it falls on us to survey the best available data sources and help others interpret them. My article in The Atlantic takes on this question, focusing on wastewater surveillance and population surveys as particularly useful sources we should consider right now.

    Interpreting wastewater data

    Wastewater data, unlike case data, don’t require people to actively go out and get tested: if their public sewer system is getting sampled for COVID-19, they will automatically be included in the data. You can look for wastewater surveillance in your area on Biobot’s dashboard, the CDC’s dashboard, or other state and local dashboards, depending on where you live. (I have a list of state dashboards here.)

    But interpreting wastewater data can be pretty different from interpreting case data. Here are a couple of key tips for approaching this source, based on my interview with Biobot president and cofounder Newsha Ghaeli:

    • Look at “directionality” and “magnitude.” “Directionality” means whether viral levels are going up or down, and “magnitude” means how they compare with earlier points in the pandemic. To quote from the story: “A 10 percent uptick when levels are low is less concerning than a 10 percent uptick when the virus is already spreading widely.”
    • If you do not have public wastewater data for your county, data from a neighboring county still provides useful info. When we talked, Ghaeli gave the example of a New York City resident looking at data from New Jersey or Connecticut counties neighboring the city: as people from these areas commute into NYC, a surge in one place could quickly drive a surge in the other.
    • Wastewater data are not a perfect proxy for infections. Scientists are still learning about how to best use this newer surveillance tool. Unlike clinical metrics (like cases), wastewater data can differ based on local environmental factors, and it often takes a long time for researchers to build useful interpretations of their communities. (See my past FiveThirtyEight story for more detail on this.)
    • These data can’t tell you who is getting sick. To comprehensively answer demographic questions, we need to actively survey people in our communities and ask them about their experiences with COVID-19. (See the story for more about how this works.)

    Other interpretation tips

    Beyond looking at wastewater data, here are a couple of tips I received from experts for readers seeking to watch their local COVID-19 numbers this fall:

    • “Look as local as you can,” said Pandemic Prevention Initiative expert Sam Scarpino. In other words, if you can find data for your individual county or even ZIP code, go there. 
    • Check multiple sources, and try to “triangulate” between them, said City University of New York epidemiologist Denis Nash. (I’ve provided similar advice in past posts like this one.)
    • Consider local events and behavior, Scarpino said. Quoting from the story: “If a popular community event or holiday happened recently, low case numbers might need to be taken with a grain of salt.”

    I also wanted to give a quick shout-out here to the People’s CDC, a volunteer science communication and advocacy organization. If you’re looking for more thoughtful analysis of national COVID-19 data, their weekly “weather reports” are a really helpful and accessible source. The organization also provides resources to help people push for more COVID-19 safety measures in their communities. 

    “People do want layers of protection, they do want to keep themselves in each other safe from COVID,” said Mary Jirmanus Saba, a geographer and volunteer with the People’s CDC whom I interviewed (with a couple of other volunteers) for my story. The weather reports and other similar initiatives help the organization’s followers “see that we really are there for each other,” she said.

    More wastewater reporting

  • Several respiratory viruses might spread widely this fall; here’s how we should track them

    Several respiratory viruses might spread widely this fall; here’s how we should track them

    The SCAN wastewater network is tracking flu, RSV, and other viruses in wastewater along with the coronavirus.

    As you might have guessed from the last couple weeks of National numbers posts, I am anticipating that the U.S. will see a new COVID-19 surge this fall, along with potential surges of the flu and other respiratory diseases. And I’m not the only person making this prediction: in the last couple of weeks, this potential surge has been a major theme in news publications and health experts’ Twitter threads.

    Yes, most of the U.S.’s major COVID-19 indicators appear to be at low levels right now (at least compared to earlier in the Omicron era). But rising numbers in Europe, as well as trends from some parts of the Northeast, provide reasons to worry. Here’s why it’s worth worrying, and some thoughts on better tracking these viruses in the future.

    Why experts anticipate a fall surge

    One likely reason for a fall surge, as writer Ewen Callaway explains in Nature, is an influx of new subvariants that have continued to evolve off of Omicron. While there are several lineages on the rise in various countries, researchers are finding that they tend to have similar mutations and capacities for reinfecting people, Callaway reports. Scientists call this “convergent evolution.”

    From the story:

    SARS-CoV-2-watchers are tracking an unprecedented menagerie of variants from a number of branches of the Omicron family tree, says Tom Peacock, a virologist at Imperial College London. Despite these variants’ distinct ancestries, they carry many of the same mutations to the SARS-CoV-2 spike protein (the part of the virus that immune systems target). “Clearly, there’s an optimal way for a variant to look going into this season,” says Peacock.

    The new bivalent booster shots will help reduce severe disease from these newer Omicron iterations. But Americans are currently getting boosted in such small numbers that the shots might not help alleviate healthcare systems as much as experts might’ve hoped. And that brings me to another surge driver: behavior.

    More than at any point in the pandemic, Americans are acting like COVID-19 is not worth a simple mask in public or test before a gathering—even though the coronavirus is still very capable of sending people to the hospital or giving them long-term symptoms. Indoor gatherings, holiday travel, fully opened schools, and all the behaviors that come with them will inevitably lead to outbreaks that are poorly tracked by our increasingly-less-resourced public health system (and that are largely ignored by leaders who encouraged the unsafe behavior).

    Katherine Wu summarized this situation well in a recent article for the Atlantic, writing: 

    So we can call this winter “post-pandemic” if we want. But given the policy failures and institutional dysfunctions that have accumulated over the past three years, it won’t be anything like a pre-pandemic winter, either. The more we resist that reality, the worse it will become. If we treat this winter as normal, it will be anything but.

    At the same time, the behaviors contributing to more COVID-19 spread will also help other respiratory viruses. Experts are anticipating that the U.S. could have a bad flu winter, based on trends from the Southern hemisphere—which faces the flu a few months before we do. (For journalists interested in following flu patterns this fall and winter, the Association of Health Care Journalists has a new tipsheet on the subject.)

    In addition to COVID-19 and the flu, the U.S. is seeing increased transmission of other respiratory viruses particularly primed to spread among children, such as RSV, rhinoviruses and enteroviruses. Pediatricians and hospital directors told USA TODAY’s Adrianna Rodriguez that they’re seeing more sick kids, earlier in the school year than they would typically expect. Kids have less immunity to these viruses after limited spread in the last two winters, while minimal health precautions are making it easier for the viruses to infect more people.

    Expanding COVID-19 surveillance to other viruses

    In short, we could see a lot of respiratory virus cases in the next few months. These trends have got me thinking about how, in an ideal world, the U.S. public health system might expand our existing COVID-19 surveillance to better track all of the viruses that wreak havoc on our bodies during colder weather. (As I pointed out last month, our flu tracking is pretty terrible right now.)

    Here are a few suggestions:

    • Expand wastewater surveillance to other respiratory viruses. Some pilot programs, such as the SCAN network based at Stanford and Emory Universities, have already started to monitor the flu, RSV, and other viruses in wastewater. But we need this type of tracking on a much broader scale, and we need it to be funded by the CDC and other major health institutions. (Biobot and the CDC’s expansion into monkeypox surveillance is a good first step here.)
    • Make multipurpose PCR tests widely available. My favorite place to get a COVID-19 test is one of the NYC health department’s express PCR sites. These public labs conduct PCR analysis on-site, so I get my test results in a few hours. And the results don’t just include COVID-19: the lab also tests for flu and RSV, so I can immediately rule out several explanations as to why my throat might be sore. We need many more labs doing this type of multi-virus testing.
    • Conduct population surveys for multiple respiratory diseases. I frequently reference the work of epidemiologist Denis Nash and his team at the City University of New York, who have surveyed New Yorkers and nationally to understand true COVID-19 infection rates. This type of work should be expanded to other diseases, in order to develop better, closer-to-real-time estimates of multiple conditions.
    • Add more diseases to hospital surveillance systems. Did you know that the HHS’s hospital utilization dataset includes hospitalizations for flu? While facilities have the opportunity to submit their flu patient numbers through the same system that they report on COVID-19 patients, flu reporting is optional—and therefore not very useful for analysis. A future iteration of the HHS’s hospital surveillance system should include mandatory flu reporting as well as other diseases, so that we can track severe cases more closely.
    • Incorporate respiratory virus tracking into school systems. For the first couple of pandemic-era semesters, many K-12 school systems maintained detailed records of their COVID-19 cases. This process has largely disappeared along with other COVID-19 measures—and while it lasted, it was incredibly burdensome for the school officials doing the tracking (many of them already-overworked school nurses). Still, in a future with more resources devoted to health in public schools, I’d like to see them become sites for tracking a variety of diseases and health conditions. The more collaboration between public schools and public health, the better.

    If you know of researchers or organizations working on any of these surveillance mechanisms—or anything I haven’t included on this list—please reach out! I am always on the lookout for solutions story ideas.

    More on testing

  • Sources and updates, October 2

    • Johns Hopkins dashboard creator wins public service award: Lauren Gardner, an engineering professor at Johns Hopkins University, was recently awarded the 2022 Lasker-Bloomberg Public Service Award (a major prize in biomedical research) in recognition of her work on JHU’s global COVID-19 dashboard. This dashboard was one of the world’s first and most popular sources for tracking how the pandemic spread. Unlike many other projects, it has continued fairly consistently since early 2020, and continues to be a great resource for national and international data. Congratulations to Gardner and the other folks at JHU!
    • CDC releases updated chronic disease and risk factor data: This week, the CDC published a new iteration of its Behavioral Risk Factor Surveillance System (BRFSS), a major data source providing information on chronic conditions, health behaviors, access to healthcare, and more. The surveillance system uses surveys of over 400,000 American adults, conducted annually in all 50 states and several territories. While these aren’t COVID-specific data, the datasets can be a really helpful source for examining populations more vulnerable to COVID-19 in different parts of the country.
    • Increased respiratory illnesses in children: Another CDC update: researchers from the agency published a new study in the Morbidity and Mortality Weekly Report reporting increased cases of respiratory illness in kids this past summer. Strains of rhinovirus and enterovirus that haven’t circulated much in the last two years are back in 2022 and could cause problems this fall—especially as schools continue to operate in-person with relatively few public health measures—the CDC report suggests. For more context, see this recent newsletter by Katelyn Jetelina and Caitlin Rivers.
    • Biobot and CDC expand wastewater tracking to monkeypox: Biobot, the leading COVID-19 wastewater surveillance company, is expanding its work with the CDC to include monkeypox surveillance. As part of the CDC’s National Wastewater Surveillance System (NWSS), Biobot will coordinate data collection and analysis for both COVID-19 and monkeypox through at least January 2023. “We hope this can demonstrate the flexibility and versatility of this technology for governments across the country,” Biobot president and cofounder Newsha Ghaeli said in a press release.
    • Launch of the Data Liberation Project: This is not COVID- or even health-specific, but I wanted to give a quick shout-out to the Data Liberation Project, a new effort by Jeremy Singer-Vine (widely known in data journalism circles as the author of the Data Is Plural newsletter). The new project is “an initiative to identify, obtain, reformat, clean, document, publish, and disseminate government datasets of public interest.” I hope to see some COVID-19 datasets liberated through this project!

  • National numbers, October 2

    National numbers, October 2

    Coronavirus levels in Boston, Mass. wastewater spiked intensely last week. Chart via MWRA/Biobot.

    In the past week (September 24 through 30), the U.S. reported about 330,000 new COVID-19 cases, according to the CDC. This amounts to:

    • An average of 47,000 new cases each day
    • 100 total new cases for every 100,000 Americans
    • 13% fewer new cases than last week (September 17-23)

    In the past week, the U.S. also reported about 26,000 new COVID-19 patients admitted to hospitals. This amounts to:

    • An average of 3,800 new admissions each day
    • 8.0 total admissions for every 100,000 Americans
    • 6% fewer new admissions than last week

    Additionally, the U.S. reported:

    • 2,400 new COVID-19 deaths (350 per day)
    • 81% of new cases are caused by Omicron BA.5; 13% by BA.4.6; 3% by BF.7;  1% by BA.2.75 (as of October 1)
    • An average of 400,000 vaccinations per day

    Official COVID-19 numbers continue to drop nationwide, with case counts down 13% and new hospital admissions down 6% this week compared to the prior week. Still, signals from wastewater suggest this is no time to let our guard down, especially if you live in the Northeast.

    Biobot’s wastewater surveillance dashboard is back this week (after a one-week hiatus). Nationally, this surveillance suggests coronavirus transmission is at a high plateau close to what we saw during early fall of last year, before Omicron hit. The Northeast is driving that recent trend, with an overall coronavirus concentration twice as high as the concentrations reported in other regions.

    This region remains a hotspot for Omicron BF.7, the subvariant of BA.5 that could be the U.S.’s next dominant lineage. Nationwide, BF.7 is slowly competing with BA.5: it’s grown from causing about 1% of new cases to 3.4% over the last month, according to CDC estimates. BA.4.6 also continues to grow, while BA.2.75 has remained relatively constant.

    Within the Northeast region, Boston stands out: the city’s wastewater surveillance program (run by Biobot) reported a major spike last week. And by major spike, I mean an increase of more than 100% week-over-week, according to the city’s public health department. “This spike in our wastewater concentration is of great concern and another reminder that the pandemic is far from over,” said Dr. Bisola Ojikutu, Boston’s public health commissioner, in a press release.

    Wastewater spikes typically precede case spikes by a couple of weeks, though we’ll have to see whether the significant drop in PCR testing in recent months changes this pattern. Either way, this is a good time to get a booster shot (more on boosters below), stock up on masks and rapid tests, and start planning safety measures for the holidays.

    Boston is running vaccine clinics in response to this potential new surge, and the city public health department “recommends” masking indoors. But any further mitigations are likely out of the question, even though they could have a huge impact.