
As we head into the holidays with limited COVID-19 testing and undercounted case numbers, wastewater surveillance is the best way to evaluate how much the virus is spreading in your region. And it’s now available in more places than ever, thanks to the many research groups and public health agencies setting up sewage testing.
To help you find wastewater surveillance in your area, I recently updated my COVID-19 Data Dispatch resource page about U.S. wastewater dashboards. The page includes links to and notes about national, state, and a few local dashboards.
Let’s review the options. First, there are now three national dashboards with U.S. wastewater data, each covering a different set of locations.
- The CDC’s National Wastewater Surveillance System is the biggest, including more than 1,000 sites from almost every state, though some states have far better coverage than others. Click on an individual site to see coronavirus trends for that location.
- Biobot Analytics is the biggest private company doing wastewater surveillance; it provides analysis for hundreds of sites in the CDC NWSS network as well as its own, separate network. Biobot’s national and regional data (which include NWSS sites) are particularly helpful for large-scale trends.
- WastewaterSCAN is a project that started from an academic partnership between Stanford University, Emory University, the University of Michigan, and communities in California. It’s since expanded to include sites in about 20 states, and participating sewersheds are tested for monkeypox, flu, and RSV in addition to the coronavirus.
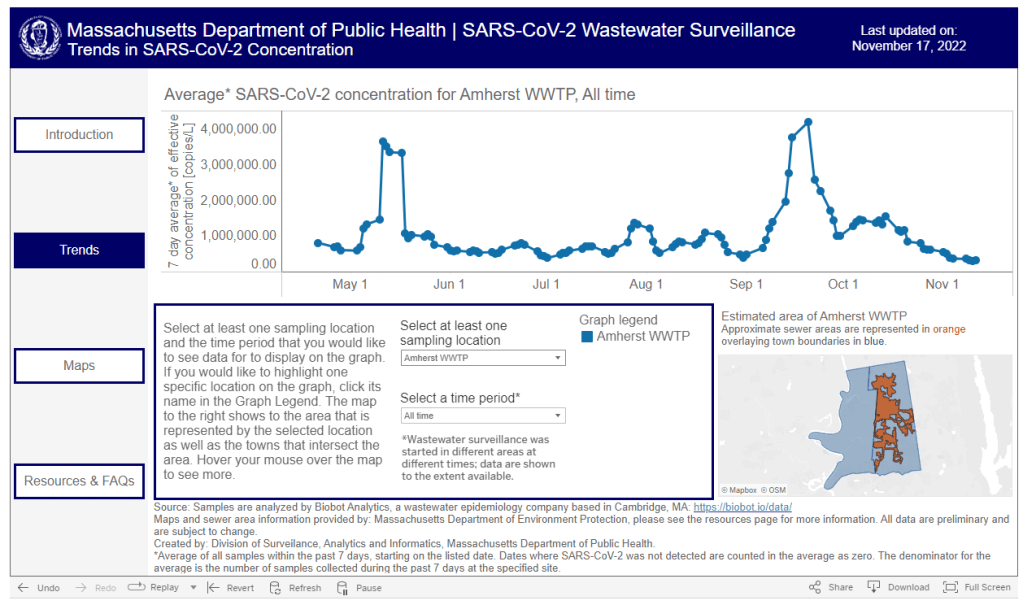
Second, 21 states currently have their own wastewater dashboards or reporting systems. If this is available in your area, I highly recommend looking at your local dashboard in addition to the national options. State and local dashboards tend to include more detailed and/or more frequently updated data, and are often tailored to their community’s needs more closely.
These are the states with wastewater dashboards; see the resource page for links and more info:
- California, Colorado, Georgia, Hawaii, Idaho, Indiana, Maine, Maryland, Massachusetts, Michigan, Minnesota, Missouri, Nebraska, New York State, North Carolina, Ohio, Oklahoma, Oregon, Utah, West Virginia, Wisconsin.
Wastewater trends do not correspond directly to infection trends, because people sick with COVID-19 might shed the virus at different rates (based on where they are in their infection, variants, and other factors). Some researchers are working to better understand the correlation between wastewater trends and cases, but for now, the sewage data are best understood as a broad indicator of risk—not a precise estimate of how many people in your community are sick.
For tips on interpreting wastewater data, I recommend looking at past COVID-19 Data Dispatch posts on this topic, as well as this FAQ from the People’s CDC.

Leave a comment