Tag: vaccine registries

  • How is the CDC tracking the latest round of COVID-19 vaccines?

    How is the CDC tracking the latest round of COVID-19 vaccines?

    The CDC’s vaccination data pages all stopped updating in May 2023. How is the agency tracking our current round of shots?

    It’s now been a couple of weeks since updated COVID-19 vaccines became available in the U.S. At this point in prior COVID-19 vaccine rollouts, we would know a lot about who had received those vaccines: data would be available by state, for different age groups, and other demographic categories.

    This time, though, the data are missing on a national scale. Following the end of the federal public health emergency in May, the CDC has lost its authority to collect vaccination data from all state and local health agencies that keep immunization records. As a result, the CDC is no longer providing comprehensive vaccination numbers on its COVID-19 dashboards.

    But we still have some information about this year’s vaccination campaign, thanks to continued CDC efforts as well as reporting by other health agencies and research organizations. In fact, last week, the federal Department of Health and Human Services (HHS) told reporters that more than seven million Americans have received updated COVID-19 vaccines so far this fall.

    HHS also said that about 14 million doses have been shipped to vaccination sites, primarily pharmacies. In addition, 710,000 vaccines for children have been ordered through a federal program that provides these shots.

    Vaccine distribution numbers are slightly easier for the CDC and HHS to collect, as they can work directly with vaccine manufacturers. To understand how many people are getting the shots, though, is more challenging—requiring a mix of data from state and local agencies, surveys, and other surveillance mechanisms.

    What changed with the PHE’s end:

    Early in the pandemic, the CDC established data-sharing agreements with the health agencies that keep immunization records. This includes all states, territories, and a few large cities (such as New York City and Philadelphia) that have separate records systems from their states; you can see a full list of records systems here.

    Through those agreements, the CDC collected vaccine administration numbers, standardized the data (as much as possible), and reported them on public dashboards. The CDC wasn’t able to collect as detailed demographic information as many health experts would’ve liked—for example, they never reported vaccinations by race and ethnicity below the national level. But the data were still useful for tracking who got vaccinated across the U.S.

    These data-sharing agreements concluded with the end of the public health emergency (PHE) in May 2023. According to a CDC report published at that time, the CDC was able to extend agreements with some jurisdictions past the PHE’s end. Still, the report’s authors acknowledged that “future data might not be as complete” as during the emergency period. Even if 40 out of 50 states keep reporting, the remaining 10 represent data gaps.

    Notably, the May report also claims that the CDC would continue to provide data on COVID-19 vaccination coverage on the CDC’s COVID-19 dashboard and a separate vaccination dashboard. But neither of those dashboards has been updated with any information from this fall’s vaccine campaign, as of this publication.

    In addition to compiling data from state and local systems, the CDC has other mechanisms for tracking vaccinations. According to CBS News reporter Alexander Tin, CDC officials highlighted a couple during a briefing on October 4:

    • The National Immunization Survey, a phone survey conducted by CDC officials to estimate national vaccination coverage based on a representative sample of Americans. This survey is currently the CDC’s method for tracking flu vaccinations.
    • CDC’s Bridge Access and Vaccines for Children (VFC) programs, both of which buy vaccines to distribute to Americans who may not have health insurance or face other financial barriers to vaccination. The Bridge Access program was specifically set up for COVID-19 vaccines, while the VFC program covers other childhood vaccines.
    • Contact with vaccine manufacturers and distributors, i.e. the pharmaceutical companies that make the vaccines and the pharmacies and healthcare organizations that give them out. These companies share data with the CDC, offering insights into how many vaccines have been distributed to different locations; though the data may not be comprehensive if not all distributors are included (i.e. just big pharmacy chains, not smaller, independent stores).

    Other places to look for vaccination data:

    Outside of the CDC, there are a few other places where you can look for vaccination data. Here are a couple that I’m monitoring:

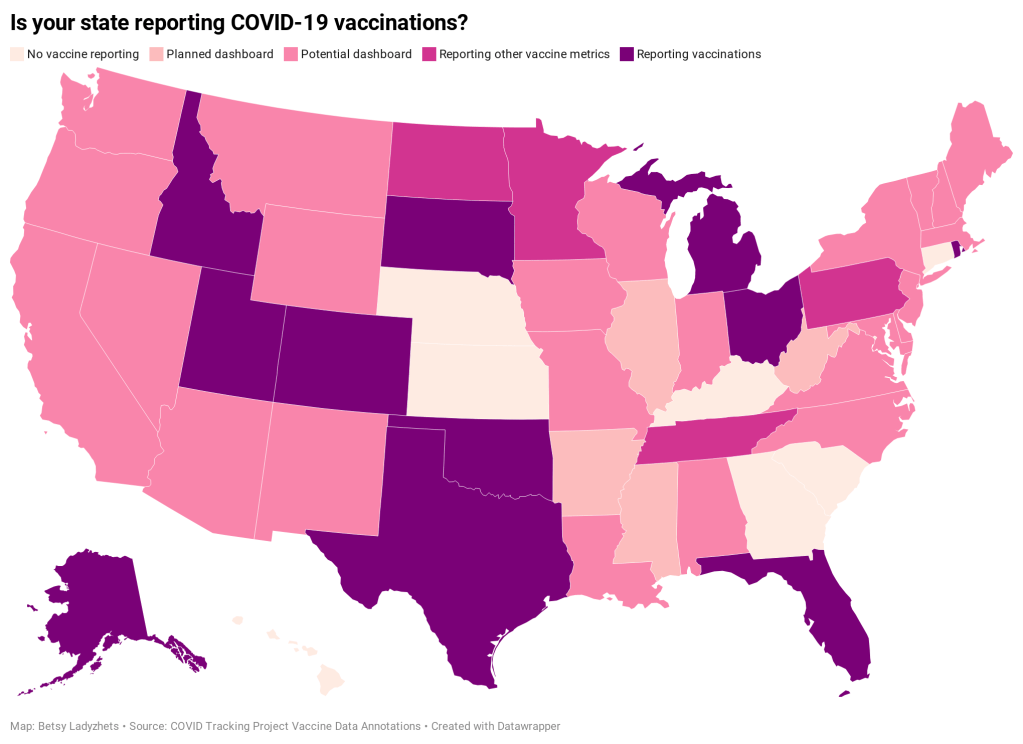
    • State and local public health agencies: Some agencies that track immunizations have their own dashboards, reporting on vaccinations in a specific state or locality. For example, New York City’s health department tracks COVID-19 vaccinations among city residents, although the agency hasn’t yet published data for this fall’s vaccines. I have a list of state vaccination dashboards here; this doesn’t currently represent data on the fall 2023 vaccines, but I aim to do that update in the coming weeks.
    • Outside surveys, such as KFF’s COVID-19 Vaccine Monitor: Like the CDC’s National Immunization Survey, other health organizations conduct surveys to track vaccinations. The Kaiser Family Foundation’s COVID-19 Vaccine Monitor is one well-known project, which has been doing regular surveys on COVID-19 vaccine uptake since December 2020.
    • Scientific reports answering specific vaccination questions: Public health researchers may use surveys, immunization records, or other data systems to study specific questions about vaccination, such as the impact that vaccination has on lowering a patient’s risk of severe disease. These studies are often published in the CDC’s Morbidity and Mortality Weekly Report and other journals.

    If you have other questions about vaccination data—or want to share a data source I didn’t mention here—please reach out: email me or leave a comment below.

  • The US still doesn’t have the data we need to make informed decisions on booster shots

    The US still doesn’t have the data we need to make informed decisions on booster shots

    How often will we see new variants like Omicron, that are incredibly different from other lineages that came before them? According to Trevor Bedford, it could be between 1.5 and 10.5 years.

    Last fall, I wrote—both in the COVID-19 Data Dispatch and for FiveThirtyEight—that the U.S. did not have the data we needed to make informed decisions about booster shots. Several months later, we still don’t have the data we need, as questions about a potential BA.2 wave and other future variants abound. Discussions at a recent FDA advisory committee meeting made these data gaps clear.

    Our country has a fractured public health system: every state health department has its own data systems for COVID-19 cases, vaccinations, and other metrics, and these data systems are often very difficult to link up with each other. This can make it difficult to answer questions about vaccine effectiveness, especially when you want to get specific about different age groups, preexisting conditions, or variants.

    To quote from my November FiveThirtyEight story:

    In the U.S., vaccine research is far more complicated. Rather than one singular, standardized system housing health care data, 50 different states have their own systems, along with hundreds of local health departments and thousands of hospitals. “In the U.S., everything is incredibly fragmented,” said Zoë McLaren, a health economist at the University of Maryland Baltimore County. “And so you get a very fragmented view of what’s going on in the country.”

    For example, a database on who’s tested positive in a particular city might not be connected to a database that would reveal which of those patients was vaccinated. And that database, in turn, is probably not connected to health records showing which patients have a history of diabetes, heart disease or other conditions that make people more vulnerable to COVID-19.

    Each database has its own data fields and definitions, making it difficult for researchers to integrate records from different sources. Even basic demographics such as age, sex, race and ethnicity may be logged differently from one database to the next, or they may simply be missing. The Centers for Disease Control and Prevention, for instance, is missing race and ethnicity information for 35 percent of COVID-19 cases as of Nov. 7.*

    *As of April 9, the CDC is still missing race and ethnicity information for 35% of COVID-19 cases.

    This past Wednesday, the FDA’s Vaccines and Related Biological Products Advisory Committee (VRBPAC) met to discuss the future of COVID-19 booster shots. Notably, this committee didn’t actually need to vote on anything, since the FDA and CDC had already authorized a second round of boosters for Americans over age 50 and immunocompromised people the week before. 

    When asked why the FDA hadn’t waited to hear from its advisory committee before making this authorization decision, vaccine regulator Peter Marks said that the agency had relied on data from the U.K. and Israel to demonstrate the need for more boosters—combined with concerns about a potential BA.2 wave. The FDA relied on data from the U.K. and Israel when making its booster decision in the fall, too; these countries, with centralized health systems and better-organized data, are much more equipped to track vaccine effectiveness than we are.

    With that authorization of second boosters for certain groups already a done deal, the VRBPAC meeting this past Wednesday focused more on the information we need to make future booster decisions. Should we expect annual COVID-19 shots, like we do for the flu? What about shots that are designed to combat specific variants? A lot of this is up in the air right now, the meeting discussion indicated.

    Also up in the air: will the FDA ever host a virtual VRBPAC meeting without intensive technical difficulties? The meeting had to pause for more than half an hour to sort out a livestream issue.

    Here are some vaccine data questions that came up on Wednesday, drawing from my own notes on the meeting and the STAT News liveblog:

    • How much does protection from a booster shot wane over time? We know that booster shots increase an individual’s protection from a coronavirus infection, symptoms, hospitalization, and other severe outcomes; CDC data presented during the VRBPAC meeting showed that, during the Omicron surge, Americans who were boosted were much more protected than those with fewer doses. But we don’t have a great sense of how long these different types of protection last.
    • How much does booster shot protection wane for different age groups? Waning immunity has been a bigger problem among seniors and immunocompromised people, leading to the FDA’s decision on fourth doses for these groups. But what about other age groups? What about people with other conditions that make them vulnerable to COVID-19, like diabetes or kidney disease? This is less clear.
    • To what degree is waning immunity caused by new variants as opposed to fewer antibodies over time? This has been a big question during the Delta and Omicron surges, and it can be hard to answer because of all the confounding variables involved. In the U.S., it’s difficult to link up vaccine data and case data; tacking on metrics like which variant someone was infected with or how long ago they were vaccinated often isn’t possible—or if it is possible, it’s very complicated. (The U.K. does a better job of this.)
    • Where will the next variant of concern come from, and how much will it differ from past variants? Computational biologist Trevor Bedford gave a presentation to VRBPAC that attempted to answer this question. The short answer is, it’s hard to predict how often we’ll see new events like Omicron’s emergence, in which a new variant comes in that is extremely different from the variants that preceded it. Bedford’s analysis suggests that we could see “Omicron-like” events anywhere from every 1.5 years to every 10.5 years, and we should be prepared for anything on that spectrum. The coronavirus has evolved quite quickly in the last two years, Bedford said, and will likely continue to do so; though he expects some version of Omicron will be the main variant we’re dealing with for a while.
    • What will the seasonality of COVID-19 be? The global public health system has a well-established process for developing new flu vaccines, based on monitoring circulating flu strains in the lead-up to flu seasons in different parts of the world. Eventually, we will likely get to a similar place with COVID-19 (if annual vaccines become necessary! also an open question at the moment). But right now, the waxing and waning of surges caused by new variants and human behavior makes it difficult to identify the actual seasonality of COVID-19.
    • At what point do we say the vaccine isn’t working well enough? This question was asked by VRBPAC committee member Cody Meissner of Tufts University, during the discussion portion of the meeting. So far, the most common way to measure COVID-19 vaccine effectiveness in the lab is by testing antibodies generated by a vaccine against different forms of the coronavirus. But these studies don’t account for other parts of the immune system, like T cells, that garner more long-term protection than antibodies. We need a unified method for measuring vaccine effectiveness that takes different parts of the immune system into account, along with real-world data.
    • How might vaccine safety change over time? This question was brought up by Hayley Ganz of Stanford, another VRBPAC committee member. The CDC does have an extensive system for monitoring vaccine safety; data from that system should be readily available to the experts making booster shot decisions.

    Another thing I’m wondering about right now, personally, is how the U.S.’s shifting focus away from case data might make all of this more complicated. As public health agencies scale down case investigations and contact tracing—and more people test positive on at-home, rapid tests that are never reported to these agencies—we’re losing track of how many Americans are actually getting COVID-19. And breakthrough cases, which are more likely to be mild or asymptomatic, might also be more likely to go unreported.

    So, how does the U.S. public health system study vaccine effectiveness in a comprehensive way if we simply aren’t logging many of our cases? Programs such as randomized surveillance testing and cohort studies might help, but outside of a few articles and Twitter conversations, I’m not seeing much discussion of these solutions.

    Finally: a few friends and relatives over age 50 have asked me about when (or whether) to get another booster shot, given all of the uncertainties I laid out above. If you’re in the same position, here are a couple of resources that might help:

    More vaccine data

  • Featured sources, Feb. 21

    • Bloomberg’s COVID-19 Vaccine Tracker: We’ve featured Bloomberg’s tracker in the CDD before (in fact, you can read Drew Armstrong’s walkthrough of the dashboard here), but it’s worth highlighting that the Bloomberg team made two major updates this week. First, they added a demographic vertical, which includes race and ethnicity data for the U.S. overall and for 27 states that are reporting these data. This vertical will be updated weekly. Second, the team made all of their data available on GitHub! I, for one, am quite excited to dig through the historical figures.
    • CoVariants: This new resource from virus tracker Dr. Emma Hodcroft provides an overview of SARS-CoV-2 variants and mutations. You can explore how variants have spread across different parts of the world through brightly colored charts. The resource is powered by GISAID, Nextstrain, and other sequencing data; follow Dr. Hodcroft on Twitter for regular updates.
    • The Next Phase of Vaccine Distribution: High-Risk Medical Conditions (from KFF): The latest analysis brief from the Kaiser Family Foundation looks at how individuals with high-risk medical conditions are being prioritized for vaccine distribution in each state. KFF researchers compared each state’s prioritization plans to the CDC’s list of conditions that “are at increased risk” or “may be at an increased risk” for severe illness due to COVID-19; the analysis reflects information available as of February 16.
    • First Month of COVID-19 Vaccine Safety Monitoring (CDC MMWR): This past Friday, the CDC released a Morbidity and Mortality Weekly Report with data from the first month of safety monitoring, using the agency’s Vaccine Adverse Event Reporting System (or VAERS). Out of the 13.8 million vaccine doses administered during this period, about 7,000 adverse events were reported—and only 640 were classified as serious. Check the full report for figures on common side effects and enrollment in the CDC’s new v-safe monitoring program.

  • Diving into COVID-19 data #1: Workshop recap

    Diving into COVID-19 data #1: Workshop recap

    Our first workshop happened this week!

    Drew Armstrong, Bloomberg News‘s senior editor for health care, talked about his work on the publication’s Vaccine Tracker; and Arielle Levin Becker, director of communications and strategic initiatives for the Connecticut Health Foundation, discussed how to navigate COVID-19 race and ethnicity data. Thank you to everyone who attended—we had a great turnout!

    For those who couldn’t make it live, you can watch the recording of the session below. You can also check out the slides here. I’m also sharing a brief recap of the workshop in today’s issue.

    In next Wednesday’s workshop, we’ll discuss engaging COVID-19 data providers, featuring Liz Essley Whyte (Center for Public Integrity), Tom Meagher (The Marshall Project), and Erica Hensley (independent reporter from Mississippi). If you aren’t registered for the series yet, you can sign up here.

    The Bloomberg Vaccine Tracker

    In his presentation, Drew Armstrong provided a behind-the-scenes look at Bloomberg’s tracker and shared some advice on analyzing vaccine data more broadly. 

    “We attempt to capture every vaccine dose that’s reported for COVID-19, every single day, around the world,” he said. In addition to the tracker’s daily updates on vaccine doses distributed and administered, the site also includes information on vaccine contracts between companies and countries—allowing a window into future distribution.

    All of the data on the tracker comes from public sources, largely national and state public health departments that share figures via their own dashboards, press conferences, and social media. Like other aspects of pandemic data, these figures can be pretty messy. Every country, and even every state, may have its own definition of an “administered dose” or a “vaccinated individual”—and these definitions are evolving as the rollout progresses.

    Armstrong provided one example: Tennessee reports “number of people with 1 dose only” vs. “2 doses,” and moves people from the first category to the second after they receive that second dose. Maryland, on the other hand, reports total people who have received one and two doses; both totals are always growing. It’s difficult to make apples-to-apples comparisons when every jurisdiction is doing something different. If you can, Armstrong said, actually get on the phone with your local official and make sure you understand precisely what the terms on their vaccine reports mean. When the Johnson & Johnson vaccine (which only requires one dose) starts rolling out, this definitional landscape will only get more complicated.

    As a result of this messy data landscape, figures for the Bloomberg Vaccine Tracker are compiled manually by a huge team, including reporters from every bureau of the publication. “You have to really get your hands dirty with this data to understand it,” Armstrong said.

    Armstrong also provided four ways for reporters to measure vaccination success. I’m including his slide here because I think it provides a good look at the multifaceted nature of vaccine data analysis and communication; your state might be vaccinating residents at a quick pace, but if the most vulnerable members of your community have been left out, you can’t fully call that rollout a success.

    Slide from Drew Armstrong’s talk discussing the Bloomberg Vaccine Tracker.

    On the equity front: Armstrong announced that the Bloomberg tracker now includes a demographic vertical. This tracker currently includes data from 27 states and two cities which are reporting vaccinations by race and/or ethnicity—you can check it out here. Bloomberg’s team is planning to update this tracker weekly, adding more states as their data become available.

    Armstrong emphasized that he and his colleagues want their tracker to be a resource for other journalists, civic engagement, and other public health communication. “All of our DMs are open,” he said. (Or you can send feedback to the team through a public form.)

    He also noted that reporting on these data—or even @-ing your governor on Twitter and asking them why the numbers aren’t better—is a useful way of actually making the data better. By letting public officials know that we’re looking at these numbers and noticing the gaps, we can put the pressure on for changes to be made.

    Analyzing sources of race and ethnicity data

    In her presentation, Arielle Levin Becker shared some strategies and resources for navigating a new data source—with a focus on demographic data.

    “Data is incredibly important—and easy to misuse,” she said at the start of her talk. Vetting a source properly, she explained, can help you understand both how to properly use this source and how to address its limitations in your reporting.

    Vetting questions to consider:

    • Who’s compiling this source?
    • Who’s funding it?
    • How transparent are they about their methods? Can you identify how it was compiled, or even track the chain of their methodology?
    • Do they disclose the limitations of the data?

    Similarly to Armstrong, Levin Becker recommended reaching out to a source directly when you have questions. People who compile public data are often “very welcoming” about explaining their work, she said, and may be excited to help you better use their data.

    Once you get to the analysis stage, Levin Becker suggested asking another round of questions, such as, “Do the numbers in this source match other numbers from similar sources?” and “How could I explain these numbers in plain English?” One particularly important question, she said, is: “What’s the denominator?” Does this analysis apply to everyone in a state or to a particular subset, like the over-65 population? As we’ve discussed before, denominators can be a particular challenge for COVID-19 school data—without enrollment numbers or clear data definitions, case numbers associated with schools are difficult to interpret. 

    Levin Becker honed in on age adjustment, a process that’s commonly used in health data analysis to compare outcomes for different populations. It’s kind-of a complicated statistical process, she said, but the basic idea is, you weight your data by the age distribution of a population. White populations tend to skew older than Black and Hispanic/Latino populations, for example; to compare these groups in a more equivalent way, a researcher might calculate what their disease rates would be if the different populations had the same age distribution.

    Before the state of Connecticut started age-adjusting its COVID-19 death rates, Levin Becker said, the public health department was boasting that Hispanic/Latino residents of the state were less likely to die from the disease than white residents. But after doing an age adjustment, the state revealed that residents of color were actually at higher risk.

    Slide from Arielle Levin Becker’s talk, showing how age adjustment can reveal health disparities. Chart is from the CT health department.

    “The median age for a non-Hispanic white resident is 47 years,” Levin Becker said. “For a non-Hispanic Black resident, the median age is 34 years, and for a Hispanic resident, it’s 29 years.”

    To put COVID-19 race and ethnicity data in context, Levin Becker recommended looking at other health data—particularly on preexisting conditions that might constitute higher risks for severe COVID-19. The Kaiser Family Foundation, Behavioral Risk Factor Surveillance System, and CDC life expectancy data by ZIP code are three sources she suggested reporters dig into.

    Finally, of course, there are many instances in which the lack of data is the story. There’s been a big focus on race and ethnicity data for COVID-19 vaccinations, but we’re also still missing data on other pandemic impacts. For example, the federal government and the vast majority of states don’t report COVID-19 tests by race and ethnicity. In a lot of cases, Levin Becker said, healthcare providers simply aren’t required to record the race and ethnicity of their patients—“it hasn’t been prioritized in health systems.”

    When the COVID-19 pandemic is no longer an imminent crisis, she said, “keep poking at the questions of what’s being collected and how it’s used.” Continued advocacy by journalists and other communicators can keep the pressure on to improve our race and ethnicity healthcare data—and use it to reveal the disparities that must be fixed. 

    Related resources

    A few links shared in the chat during this session:

  • Vaccinations so far are perpetuating existing inequity

    Vaccinations so far are perpetuating existing inequity

    Two weeks ago, I wrote that only 19 states were reporting vaccinations by race and/or ethnicity. This demographic information is key to evaluating the vaccine rollout: both government officials and watchdogs should be able to see how well this process is serving vulnerable populations. Without good data, we can’t see the true picture—making it harder to advocate for a more equitable system.

    Demographic vaccine data has improved since then, but not by much. The federal government is still not reporting these data on a national level. 23 states are reporting some form of vaccinations by race and ethnicity—but the data are difficult to standardize, as every state is reporting slightly different demographic categories. Several states are reporting in percentages, rather than whole numbers, which makes the data less precise.

    And a lack of federal standards for these data means it’s easy for states to change things up: Indiana, which started reporting vaccinations by race/ethnicity early in January, is now only reporting vaccinations by age and gender. New York City also reported demographic data for vaccinations in December, then removed the figures after disparities were revealed, according to Gothamist. (NYC’s demographic data are back, as of this morning, but they still show white residents getting vaccinated at disproportionately high rates compared to the city’s population.)

    (For more detail on which states these are and how to navigate their vaccination data, see the COVID-19 Data Dispatch’s annotations.)

    Meanwhile, the data we have so far continue to show significant disparities. In 23 states with available data, white Americans are being vaccinated at higher rates than Black Americans, a recent analysis by Kaiser Health News’ Hannah Recht and Lauren Weber found. This analysis followed a similar study that I cited two weeks ago—Recht and Weber write that “disparities haven’t significantly changed” with two more weeks and several more states reporting.

    In all but six of the states Recht and Weber analysed, white residents had been vaccinated at double (or more) the rate of Black residents. In Pennsylvania, this rate rises to 4.2 times. Indiana reported white residents vaccinated at 2.6 times the rate of Black residents—before the state took these data off its dashboard. Polling from the Kaiser Family Foundation continues to show that Black Americans are more hesitant; 42% of those surveyed said they want to “wait and see” how the vaccines are working for others before getting a shot.

    This vaccination news builds on the continued, deep strain that COVID-19 has placed on Black communities. Alice Goldfarb provided an update this week in an analysis post for the COVID Tracking Project. While the piece maps out disparities in COVID-19 cases for Black, Hispanic or Latino, and Indigenous populations in every state, Goldfarb also provides a stark comparison for the toll this pandemic has taken:

    More Black Americans have died of COVID-19 since the pandemic began than there are names on the Vietnam Memorial. More Black or Latinx people have died than the number of people commemorated on the AIDS Memorial Quilt.

    The urgency of fixing our vaccine system is clear. And politicians are starting to take note: Massachusetts Representative Ayanna Pressley and Senators Elizabeth Warren and Edward Markey called for better demographic data in a letter to the Department of Health and Human Services this week. They urged the department to better work with states, local public health departments, and labs to collect more data and publish it publicly.

    In a statement to the Associated Press, Pressley says:

    That which gets measured gets done, and the first step towards ensuring we are able to effectively address these disparities and direct lifesaving resources to our hardest-hit communities is for our government to collect and publish anonymized demographic data, including race and ethnicity, of vaccine recipients.

    White Massachusetts residents are getting vaccinated at 1.4 times the rate of Black residents, according to KHN.

    Dr. Marcella Nunez-Smith, the chair of Biden’s new COVID-19 equity task force, similarly discussed the need for better data and equitable vaccination at briefings this week. She mentioned leveraging existing data sources, removing barriers to vaccination in underserved communities, sharing ideas between states, and generally making vaccines more accessible, along with a vaccine communications campaign. But she didn’t go into many specifics.

    The federal government may be able to make vaccine distribution more equitable, if it can provide the funding that state and local public health departments—along with health clinics, community centers, churches, and so many other possible vaccine providers—need right now. But one thing it can do is require race and ethnicity data, and make it standardized. We need that, like, a month ago.

    More vaccination data updates

    There were a couple of great features this week on problems with America’s vaccine data system(s), as well as updates to major sources. Here are the highlights:

    • STAT’s Nicholas St. Fleur wrote about the struggle to find a vaccine appointment, highlighting a viral Twitter thread from intensive care physician Dr. Arghavan Salles. Convoluted online systems are simply not working for seniors and many other vulnerable populations.
    • In another STAT piece, Mario Aguilar described vaccination data challenges in Utah as a microcosm of similar issues across the country. Even within this single state, he writes, some counties with robust IT already in place were able to adapt their tech for COVID-19 vaccination, while in others, exhausted healthcare workers must enter every data point by hand.
    • KHN’s Rachana Pradhan and Fred Schulte describe how a lack of standards for race and ethnicity data collection have led some states to leave this field optional, while others aren’t tracking it at all. Similar problems persist for occupation data, which should be crucial when we’re supposedly prioritizing essential workers for earlier vaccination!
    • Cat Ferguson at MIT Technology Review gives the full picture of Vaccine Administration Management System, or VAMS, a brand-new vaccine data system that the CDC commissioned for COVID-19 vaccination—and that is completely failing to do its job. Most states in the country have chosen not to use this free system, as it is difficult to use, arbitrarily cancels appointments, and confuses patients.
    • A team from POLITICO laid out Biden’s journey to locate 20 million vaccine doses. The White House briefings were “short on details,” these authors claim, because behind the scenes, the Biden team was still struggling to get their hands on basic information that should’ve been communicated during the transition. Once doses are delivered to states, the state public health systems are fully responsible for tracking these doses until they are officially recorded as “administered”; this makes it difficult for the federal government to track the overall vaccine rollout.
    • KFF has a new dashboard for its COVID-19 Vaccine Monitor, which is tracking public opinions of and responses to vaccines. The organization is also running a dashboard of state COVID-19 vaccine priorities, which makes it easy to compare strategies across states.
    • Vaccine Finder, a tool developed at Boston Children’s Hospital which makes it easy for Americans to find vaccine providers in their communities, is partnering with Google Maps to “bring wider awareness and access to COVID-19 vaccines,” according to John Brownstein, Chief Innovation Officer at the hospital.

    Related posts

    • Sources and updates, November 12
      Sources and updates for the week of November 12 include new vaccination data, a rapid test receiving FDA approval, treatment guidelines, and more.
    • How is the CDC tracking the latest round of COVID-19 vaccines?
      Following the end of the federal public health emergency in May, the CDC has lost its authority to collect vaccination data from all state and local health agencies that keep immunization records. As a result, the CDC is no longer providing comprehensive vaccination numbers on its COVID-19 dashboards. But we still have some information about this year’s vaccination campaign, thanks to continued CDC efforts as well as reporting by other health agencies and research organizations.
    • Sources and updates, October 8
      Sources and updates for the week of October 8 include new papers about booster shot uptake, at-home tests, and Long COVID symptoms.
    • COVID source shout-out: Novavax’s booster is now available
      This week, the FDA authorized Novavax’s updated COVID-19 vaccine. Here’s why some people are excited to get Novavax’s vaccine this fall, as opposed to Pfizer’s or Moderna’s.
  • Only 19 states report vaccinations by race/ethnicity

    Only 19 states report vaccinations by race/ethnicity

    Every week, I come into your inbox and I say, the vaccine rollout is going badly.  And you’re probably like, yeah, Betsy, I know, it’s on the news every single day.

    You probably don’t need me to tell you about the announcement this past Tuesday, from Health and Human Services Secretary Alex Azar, telling states to stop saving their second doses and start prioritizing all adults over the age of 65… or the Washington Post scoop this past Friday, revealing that states couldn’t actually vaccinate more people because the federal vaccine reserve was already used up. (I salute all the policy reporters following this madness. Seriously.)

    So instead, today, I’m focusing on a vaccination issue that hasn’t gotten as much press: who is actually getting vaccinated? On the national level, we largely can’t answer this question, thanks to a lack of demographic data.

    While the CDC’s vaccination tracker has seen some upgrades recently (such as the inclusion of people receiving two doses and downloadable data), it does not report any information on the race, ethnicity, age, gender, or occupation of those Americans who have gotten shots. And the data aren’t much better at the state level, according to recent analysis from the COVID Tracking Project

    The COVID Tracking Project analysis discusses 17 states which report race and/or ethnicity data for vaccine recipients. Since the post was published, two more states—Missouri and West Virginia—have started reporting such data. Still, just reporting these data isn’t sufficient. Alice Goldfarb, Kara Schechtman, Charlotte Minsky, and other Project volunteers who compiled detailed annotations on the vaccine metrics reported by each state found that, even when states do report demographic data, each state uses vastly different categories, making it difficult to compare or combine this state-level information into a useful national dataset.

    See the CDD’s updated annotations on both state and national vaccine data sources here.

    Using the limited data that are available, though, we can still see that the vaccination effort thus far is incredibly inequitable—despite government promises to prioritize vulnerable populations.

    White Americans are getting vaccinated at much higher rates than Black Americans, according to a Kaiser Health News analysis of state data published yesterday. Reporters Hannah Recht and Lauren Weber discuss access issues and mistrust of the healthcare system—tied to systematic racism against Black Americans seeking healthcare—as reasons why Black Americans may be left behind.

    But the disparities so far, at a stage of the vaccine rollout that has largely prioritized healthcare workers, means that both national and local public health agencies have a lot of work to do:

    “My concern now is if we don’t vaccinate the population that’s highest-risk, we’re going to see even more disproportional deaths in Black and brown communities,” said Dr. Fola May, a UCLA physician and health equity researcher. “It breaks my heart.”

    In New York—a state which finally released a vaccine dashboard today, but is not yet reporting demographic data—vaccination trends by hospital suggest a similar pattern. The hospitals with the highest shares of vaccinated workers are, by and large, private hospitals located in Manhattan. The hospitals with fewer vaccinated workers, on the other hand, include those located in Harlem, Brooklyn, and other working-class neighborhoods.

    Data are also lacking for long-term care facilities. The CDC reports total vaccine doses administered in these facilities (which include nursing homes, assisted living facilities, and other care homes). But a national total is unhelpful in analyzing where states have been most successful at getting vaccines to this high-priority population. A COVID Tracking Project analysis, published on Thursday, found vaccine data for LTCs in only seven states. South Carolina is the only state releasing detailed data on individual facilities.

    Meanwhile, CVS has published a state-by-state dataset of LTC vaccinations administered by this pharmacy chain. The COVID Tracking Project reports that Walgreens may release a similar dataset. It seems pretty wild that independent pharmacy chains are reporting more detailed vaccine data than the federal government itself—until you remember, well, how data reporting has gone this entire pandemic.

    Vaccination data, right now, are about as messy as testing data were back in spring 2020. Every state is doing its own thing, and the federal government has yet to provide sufficiently detailed information for meaningful analysis. Readers: I urge you to push for better vaccine demographic data, both in your own region and nationally.

    A few more vaccine data updates:

    • Sources and updates, November 12
      Sources and updates for the week of November 12 include new vaccination data, a rapid test receiving FDA approval, treatment guidelines, and more.
    • How is the CDC tracking the latest round of COVID-19 vaccines?
      Following the end of the federal public health emergency in May, the CDC has lost its authority to collect vaccination data from all state and local health agencies that keep immunization records. As a result, the CDC is no longer providing comprehensive vaccination numbers on its COVID-19 dashboards. But we still have some information about this year’s vaccination campaign, thanks to continued CDC efforts as well as reporting by other health agencies and research organizations.
    • Sources and updates, October 8
      Sources and updates for the week of October 8 include new papers about booster shot uptake, at-home tests, and Long COVID symptoms.
    • COVID source shout-out: Novavax’s booster is now available
      This week, the FDA authorized Novavax’s updated COVID-19 vaccine. Here’s why some people are excited to get Novavax’s vaccine this fall, as opposed to Pfizer’s or Moderna’s.
  • Vaccine confusion abounds—and this is the easy stage

    Vaccine confusion abounds—and this is the easy stage

    !function(){“use strict”;window.addEventListener(“message”,(function(a){if(void 0!==a.data[“datawrapper-height”])for(var e in a.data[“datawrapper-height”]){var t=document.getElementById(“datawrapper-chart-“+e)||document.querySelector(“iframe[src*=’”+e+”‘]”);t&&(t.style.height=a.data[“datawrapper-height”][e]+”px”)}}))}();

    It’s been one month since the Pfizer/BioNTech vaccine was authorized for use in the U.S. Since then, about 22 million Pfizer and Moderna doses have been distributed—and at least 6.7 million of those have actually made it into people’s arms, according to the CDC. (The CDC is not yet tracking second doses.)

    Despite the federal government’s intense push to get vaccines through safety trials, that “last mile” step—from the Pfizer and Moderna factories to people’s arms—has been under-planned and underfunded. In the past month, we’ve been shocked by news stories ranging from a Wisconsin medical employee “intentionally removing” doses from a refrigerator to a local journalist in Florida individually helping over 150 seniors register for vaccination appointments. 

    State public health departments, already overwhelmed from ten months of running every other aspect of pandemic response, needed more money and resources to simultaneously coordinate millions of vaccinations and communicate their importance. The needed money didn’t come until this month, and recommendations from the federal government have left a lot of room for interpretation—leaving state and local health agencies scrambling.

    And this first month was supposed to be the easy part! As The Atlantic’s Sarah Zhang explains, early U.S. vaccination efforts were aimed at easy-to-reach people: those in hospitals, nursing homes, and other long-term care facilities. In these locations, it’s easy to quickly identify the most vulnerable patients and get them registered for vaccination appointments. The next groups of eligible Americans will not be so easy to reach. Doctors’ offices, pharmacies, and many other businesses will need to figure out vaccine logistics while also ramping up campaigns to convince people to even get vaccinated in the first place.

    (For a plain-language explanation of this issue that you can send to confused friends and relatives, I highly recommend the latest episode of the Sawbones podcast with Dr. Sydnee McElroy and Justin McElroy.)

    When I updated my vaccine data annotations yesterday, I added notes on how the vaccine rollout is progressing in each state. For the 38 states (and D.C.) now reporting vaccinations, you’ll find two new fields: the state’s vaccination phase (1A, 1B, etc.; 31 states are reporting this) and any prominently featured information on how residents can get vaccinated, such as a registration portal or contact information for local public health departments (at least 12 states are doing this).

    Please note that, while most states do not yet have state-wide vaccine registration portals, many local public health departments are setting up such portals at the regional and county level. I highly recommend searching for your local public health agency to see what they have available. Also, New Mexico, which has a registration portal but no vaccine data dashboard, is not included in the annotations.

    State data availability (as of Jan. 9)

    • 39 jurisdictions are reporting some form of COVID-19 vaccination data on a dedicated page or dashboard
    • 16 states are reporting race and ethnicity of vaccinated residents
    • 20 states are reporting age of vaccinated residents
    • 17 states are reporting gender or sex of vaccinated residents
    • 20 states are reporting vaccinations by county or a similar local jurisdiction
    • 31 states are reporting their vaccination phase (1A, 1B, etc.)
    • 12 states are prominently featuring information on how residents can get vaccinated, such as a registration portal or contact information for local public health departments

    More vaccine data news

    • Jurisdictions with new vaccine dashboards or pages include: Arkansas, Arizona, California, Washington D.C., Kansas, Nebraska, and South Carolina.
    • The CDC’s vaccination data are now available for download, via a table beneath the interactive dashboard. The agency updated its state-by-state data every weekday this past week—an improvement from the past two holiday weeks. A time series isn’t yet available, though.
    • Bloomberg’s vaccine tracker now has time series for both individual states and several countries which have begun administering vaccines. The states currently leading the pack for vaccinations per capita in the U.S. are West Virginia, the Dakotas, and Maine.
    • KFF has updated its COVID-19 Vaccination Monitor with polling data on vaccine hesitancy in rural America. Compared to urban and suburban residents, the foundation found, rural residents are significantly more hesitant. 31% of the rural residents sampled said they would “definitely get” a vaccine, compared to over 40% in other categories. Rural residents are also more likely to say they’re “not worried” that they or someone in their family will get sick with COVID-19.
    • NPR’s Selena Simmons-Duffin and Pien Huang surveyed experts to determine several major ways the U.S. could “jump start its sluggish vaccine rollout.” These include: more money for state and local health departments, more vaccine types (hopefully some easier-to-transport brands), massive administration sites, more regular supplies from the federal government, and public awareness campaigns.
    • The Trump administration is speeding up at least one thing: a plan to help pharmacies administer COVID-19 vaccines. According to POLITICO’s Rachel Roubein, almost 40,000 pharmacies are involved in the federal program, including those part of the Costco, Rite Aid, and Walmart chains. Pharmacies which are already used to administering flu vaccines each year—and already have huge patient databases—are strong candidates for the next phase of vaccine rollout.  
    • After some classic infighting from Governor Andrew Cuomo and Mayor Bill de Blasio, New York state is moving to Phase 1B—meaning seniors and essential workers will start to see vaccinations. However, as City Councilmember Mark Levine pointed out on Twitter, the city has: “One website for H+H sites, another for DOHMH sites, another for Costco. For community clinics, 7 have their own different websites, 4 require calling, and 1 is by email.” (I want to get vaccinated at Costco, personally, if the opportunity arises.)
    • A Twitter thread from KFF Senior Vice President Jen Kates points out more of the methods states and counties are using to get residents signed up for vaccination appointments. They range from the expected online portals to SurveyMonkey and Eventbrite.

    Related posts

    • Sources and updates, November 12
      Sources and updates for the week of November 12 include new vaccination data, a rapid test receiving FDA approval, treatment guidelines, and more.
    • How is the CDC tracking the latest round of COVID-19 vaccines?
      Following the end of the federal public health emergency in May, the CDC has lost its authority to collect vaccination data from all state and local health agencies that keep immunization records. As a result, the CDC is no longer providing comprehensive vaccination numbers on its COVID-19 dashboards. But we still have some information about this year’s vaccination campaign, thanks to continued CDC efforts as well as reporting by other health agencies and research organizations.
    • Sources and updates, October 8
      Sources and updates for the week of October 8 include new papers about booster shot uptake, at-home tests, and Long COVID symptoms.
    • COVID source shout-out: Novavax’s booster is now available
      This week, the FDA authorized Novavax’s updated COVID-19 vaccine. Here’s why some people are excited to get Novavax’s vaccine this fall, as opposed to Pfizer’s or Moderna’s.
  • 15 states are reporting COVID-19 vaccination data—federal government lags behind

    15 states are reporting COVID-19 vaccination data—federal government lags behind

    !function(){“use strict”;window.addEventListener(“message”,(function(a){if(void 0!==a.data[“datawrapper-height”])for(var e in a.data[“datawrapper-height”]){var t=document.getElementById(“datawrapper-chart-“+e)||document.querySelector(“iframe[src*=’”+e+”‘]”);t&&(t.style.height=a.data[“datawrapper-height”][e]+”px”)}}))}();

    Back in September, I read the Interim COVID-19 Vaccination Playbook released by the Centers for Disease Control and Prevention—the first national plan for how vaccination was supposed to proceed. Here’s an excerpt from my newsletter issue covering this playbook:

    Once COVID-19 vaccination begins, the CDC will report national vaccination data on a dashboard similar to the agency’s existing flu vaccination dashboard. According to the playbook, this dashboard will include estimates of the critical populations that will be prioritized for vaccination, locations of CDC-approved vaccine providers and their available supplies, and counts of how many vaccines have been administered.

    This past week, the first COVID-19 vaccine doses were administered to frontline healthcare workers across the country. The FDA issued Emergency Use Authorization to a second vaccine. But I haven’t seen a vaccination dashboard from the CDC; the closest we’ve come so far is a dataset listing initial allocations of Pfizer doses for every state. This federal agency is lagging behind several states that are making their vaccination counts public, as well as journalists who have already begun to compile the limited information that’s available.

    Here’s how the reporting of vaccination data is supposed to work. When someone goes in to get their COVID-19 shot, the provider of that shot will enter their name and other personal information to a state registry called an Immunization Information System, or IIS. Vaccine providers that issue shots and send data may include hospitals, clinics, pharmacies, pop-up vaccination sites, and any other institution that is giving shots.

    Most states and several large cities, like New York City, have these immunization registries; New Hampshire is still getting its registry ready to track COVID-19 vaccines. The registries stay private, with data only available for the people who ship, administer, and manage vaccines. A data system called the IZ gateway will help different state immunization systems link up with each other and with the CDC, which has asked all states to formally agree to share their data with this federal agency. (The CDC has asked states to share a pretty extensive list of data points for each vaccine patient, including names and addresses, which some states are not willing to send.)

    The CDC has also developed a system to help vaccine providers manage supplies and patients, a public-facing website that will help Americans see where they can get vaccinated, and a new software that will pull all vaccine-related information into one place for Operation Warp Speed officials to use. Finally, an HHS data system called the Vaccine Adverse Event Reporting System will collect information on patient reactions to the vaccines, such as headaches and fatigue—both of which are expected reactions to the Pfizer and Moderna vaccines.

    For more detail on these data systems, see this article by USA TODAY’s Aleszu Bajak and Janet Loehrke, which I drew upon to write this part of the newsletter.

    Theoretically, the CDC should have precise counts of how many people have received vaccine doses in every state, as well as personal identifying information for all of those people. So far, however, it appears that many states are beginning to make these data public, while the federal government has yet to release national numbers.

    According to ongoing analysis by the COVID Tracking Project, 15 states are reporting some form of vaccination data as of December 19. Here’s the breakdown:

    • Five states have added a count of vaccine doses administered as a single metric on their dashboards: Alaska, Colorado, Idaho, Oklahoma, and Rhode Island.
    • Two states have added vaccination-specific pages to their dashboards: South Dakota and Utah.
    • Three states have built entirely new dashboards for vaccination: Michigan, Ohio, and Texas.
    • Florida is releasing daily vaccination reports.
    • Four states are reporting vaccine-related metrics (such as counts of approved providers and doses delivered) that don’t yet include actual counts of the doses administered: Minnesota, Pennsylvania, North Dakota, and Tennessee.
    • Five states are reporting some form of demographic data: Michigan reports vaccinations by age; Texas reports by county; Utah reports by local health jurisdiction; Ohio reports by age and county; South Dakota reports by age, gender, and county; and Florida reports by race, age, gender, and county.

    For links to all of these states’ dashboards and reports, see the COVID Tracking Project’s annotations.

    Florida is the only state to report vaccination counts broken down by race so far, though the state has not yet reported such counts for different ethnicities. Public health experts have widely agreed that people of color—especially Black Americans, Native Americans, and Hispanic/Latino Americans—should be prioritized in COVID-19 vaccination because these communities have been disproportionately impacted by the pandemic. But without knowing vaccination rates in these vulnerable communities, it will be impossible to determine whether they are receiving the medical treatment they deserve.

    A recent article by ProPublica’s Caroline Chen, Ryan Gabrielson, and Topher Sanders calls attention to the lack of standardization that currently exists for state collection of race and ethnicity data:

    In state vaccination registries, race and ethnicity fields are simply considered “nice to have,” explained Mitchel Rothholz, chief of governance and state affiliates for the American Pharmacists Association. While other fields are mandatory, such as the patient’s contact information and date of birth, leaving race and ethnicity blank “won’t keep a provider from submitting the data if they don’t have it.”

    In other words, if a Black woman gets the Moderna vaccine at a Walgreens in Brooklyn, she could feel uncomfortable disclosing her race on the pharmacy’s form—and little action would be taken to explain to her why such disclosure is important and how her information would be used. The “race” checkbox on her form would be left blank. She would likely go uncounted by researchers and journalists trying to hold the government accountable to its promises of equity.

    The federal government should be both more rigorous in requiring race and ethnicity data and more transparent in disclosing these data—but I’d take a simple, national count of how many people in America have received COVID-19 shots to start. Recent data releases from the HHS have made me pretty optimistic about the federal public health agency’s ability to be transparent (see: the next two sections of this issue.) But the lack of a federal dataset so far means that key COVID-19 information is once again scattered.

    In a Poynter webinar last week, Al Thompkins asked a panel of top infectious disease experts—including scientists on both the FDA’s and the CDC’s vaccine advisory panels—a simple question: Will the public be able to see counts of how many people are getting vaccinated? None of those experts had a clear answer. There may be a dashboard in the works behind the scenes of which the panelists hadn’t been informed, but their responses still did not inspire confidence.

    Of course, journalists are once again stepping in to cobble together vaccination counts from all the public sources they can find. Bloomberg has counted 211,000 Pfizer doses in the U.S., as of December 19, by compiling numbers from state websites, press conferences, and interviews. The New York Times has surveyed state public health departments. Benjy Renton continues to update a Tableau dashboard that compares planned Pfizer and Moderna shipments to state populations.

    And the Kaiser Family Foundation released its COVID-19 Vaccine Monitor, an ongoing project to track public perception of and experiences with vaccination. The latest survey from this monitor shows that 71% of Americans would “definitely or probably” get a vaccine for COVID-19 if it was determined to be safe and freely available.

    This week, as I’ve seen the vaccination numbers—and the photos of frontline healthcare workers getting these well-deserved shots—I’ve felt something strange. Something hopeful. For the first time since March, I’m looking at numbers that I actually want to see go up. Now, if we could just get more comprehensive numbers, and get them more standardized, and get them reported with a priority on racial justice…

  • Vaccine news: data and concerns on early distribution

    Vaccine news: data and concerns on early distribution

    Everyone in the science communication world is talking about COVID-19 vaccines right now. I’ve attended three vaccine webinars in the past week alone.

    We’re all gearing up for next Thursday, when the FDA’s Vaccines and Related Biological Products Advisory Committee will meet to discuss Emergency Use Authorization (EUA) for Pfizer and BioNTech’s vaccine. If the vaccine is authorized for distribution, doses will go out to every state within days. Meanwhile, Moderna’s vaccine continues to demonstrate promising results. Moderna has also applied for EUA; FDA’s committee will meet to discuss this candidate on December 17.

    Here are a few major data sources and issues that I’ll be watching as these vaccine candidates progress:

    • The CDC has recommended that the first available vaccine doses go to healthcare workers and residents of long-term care facilities (nursing homes, assisted living facilities, etc.) The agency did not specify how state and local governments should prioritize among these groups.
    • How many people are actually in those high-priority groups in each state? To answer that question, see the Vaccine Allocation Planner for COVID-19, a new data tool from the Surgo Foundation, Ariadne Labs, and other collaborators. For each state, the tool uses population estimates from the Census, the CDC, and other sources to show how many healthcare workers, first responders, teachers, people with severe health conditions, and other high-risk individuals will need to be vaccinated. The tool is automatically set to calculate each state’s available doses as a population-adjusted share of 10 million, but users can adjust it to see how different scenarios may play out.
    • How many vaccine doses are actually going to each state? To answer this question, see the new COVID-19 Vaccine Allocation Dashboard from Benjy Renton. Renton is compiling information from local news sources on dose distributions from Pfizer and Moderna’s early shipments. Remember that both of these vaccines require two doses per person. In Texas, for example, the first Pfizer shipment of 224,250 doses will allow about 11 in every 1,000 Texas to get vaccinated.
    • How will vaccination be tracked? The CDC has promised to set up a national dashboard similar to its flu registry, but until then, we must rely once again on state data. This CDC list of state immunization registries should be a useful starting point for any local reporters hoping to get a jump start on vaccine data. You’d better believe that I will be spending a lot of time with these registries in future issues.
    • The Kaiser Family Foundation is setting up a new dashboard to track public opinion on COVID-19 vaccines. This initiative, called the COVID Vaccine Monitor, will compile the results of regular focus groups and surveys on whether Americans plan to get vaccinated and why. The dashboard is not live yet, but you can learn more about it and hear past KFF findings in the foundation’s December 3 briefing. One notable statistic: 67% of Black adults are “not too confident” or “not at all confident” that vaccines will be distributed fairly, as of a KFF poll conducted in August-September.
    • For vaccine coverage outside the U.S., see this map of procurement data from the Launch & Scale Speedometer. This research group from the Duke Global Health Innovation Center has compiled the total vaccine doses purchased by over 30 nations. The dashboard also estimates the share of each nation’s population it could be able to cover with advanced vaccine purchases. Canada is highest on the scale at 601%; the nation’s extra doses will likely be donated to other countries.
    • STAT’s Helen Branswell has written a comprehensive feature on the vaccine-related challenges that lie ahead. Some of the big challenges: coordinating a speedy early rollout, overcoming vaccine distrust, distributing vaccine doses equitably, protecting vulnerable populations (such as pregnant women and children) on whom vaccine candidates have not yet been tested, and continuing to study additional vaccines once the first candidates to win EUA are rolled out.

    What questions do you have around COVID-19 vaccines?

    It’s time for our next brief reader survey, and this time, I want to hear your vaccine concerns. As this continues to be a major coverage topic for me, I’d like to be sure I’m prioritizing the needs of my readers in choosing specific vaccine-related issues and data sources to investigate.

    This is a one-question survey. A few reader responses (from those who indicate they’re comfortable with it) will be shared next week.

  • The vaccines are coming

    The vaccines are coming

    Graphic of questionable quality via the CDC’s COVID-19 Vaccination Program Interim Playbook.

    If the title of this week’s newsletter sounds ominous, that’s because this situation feels ominous. While many scientific experts have pushed back against President Trump’s claims that a vaccine for the novel coronavirus will be available this October, state public health agencies have been instructed to prepare for vaccine distribution starting in November or December.

    Of course, the possibility of a COVID-19 vaccine before the end of 2020 is promising. The sooner healthcare workers and other essential workers can be inoculated, the better protected our healthcare system will be against future outbreaks. (And eventually, maybe, regular people like me will be able to attend concerts and fly out of the country again.) But considering the Center for Disease Control and Prevention (CDC)’s many missteps in both distributing and tracking COVID-19 tests this spring, I have a wealth of concerns about this federal agency’s ability to implement a national vaccination program.

    I’m far from the only person thinking about this. The release of the CDC’s interim playbook for vaccine distribution this past Wednesday, along with President Trump’s public contradiction of the vaccination timeline described by CDC Director Dr. Robert Redfield, has sparked conversations on whether America could have a vaccine ready this fall and, if we do, what it would take to safely distribute this technology to the people who need it most.

    In this issue, I will offer my takeaways on what the CDC’s playbook means for COVID-19 vaccination data, and a few key elements that I would like to see prioritized when public health agencies begin reporting on vaccinations.

    Data takeaways from the CDC playbook

    I’m not going to try to summarize the whole playbook here, because a. other journalists have already done a great job of this, and b. it would take up the whole newsletter. Here, I’m focusing specifically on what the CDC has told us about what vaccination data will be collected and how they will be reported.

    • We do not yet know which vaccines will be available, nor do we know vaccine volumes, timing, efficacy, or storage and handling requirements. It seems clear, however, that we should prepare for not just one COVID-19 vaccine but several, used in conjunction based on which vaccines are most readily available for a particular jurisdiction.
    • Vaccination will occur in three stages (as pictured in the above graphic). First, limited doses will go to critical populations, such as healthcare workers, other essential workers, and the medically vulnerable. Second, more doses will go to the remainder of those critical populations, and vaccine availability will open up to the general public. Finally, anyone who wants a vaccine will be able to get one.
    • “Critical populations,” as described by the CDC, basically include all groups who have been demonstrably more vulnerable to either contracting the virus or having a more severe case of COVID-19. The list ranges from healthcare workers, to racial and ethnic minorities, to long-term care facility residents, to people experiencing homelessness, to people who are under- or uninsured.
    • The vaccine will be free to all recipients.
    • Vaccine providers will include hospitals and pharmacies in the first phase, then should be expanded to clinics, workplaces, schools, community organizations, congregate living facilities, and more.
    • Most of the COVID-19 vaccines that may come on the market will require two doses, separated by 21 or 28 days. For each recipient, both doses will need to come from the same manufacturer.
    • Along with the vaccines themselves, the CDC will send supply kits to vaccine providers. The kits will include medical equipment, PPE, and—most notably for me—vaccination report cards. Medical staff are instructed to fill out these cards with a patient’s vaccine manufacturer, the date of their first dose, and the date by which they will need to complete their second dose. Staff and data systems should be prepared for patients to receive their two doses at two different locations.
    • All vaccine providers will be required to report data to the CDC on a daily basis. When someone gets a vaccine, their information will need to be reported within 24 hours. Reports will go to the CDC’s Immunization Information System (IIS).
    • The CDC has a long list of data fields that must be reported for every vaccination patient. You can read the full list here; I was glad to see that demographic fields such as race, ethnicity, and gender are included.
    • The CDC has set up a data transferring system, called the Immunization Gateway (or IZ Gateway), which vaccine providers can use to send their daily data reports. Can is the operative word here; as long as providers are sending in daily reports, they are permitted to use other systems. (Context: the IZ Gateway is an all-new system which some local public health agencies see as redundant to their existing vaccine trackers, POLITICO reported earlier this week.)
    • One resource linked in the playbook is a Data Quality Blueprint for immunization information systems. The blueprint prioritizes making vaccination information available, complete, valid, and timely.
    • Vaccine providers are also required to report “adverse events following immunization” or poor patient outcomes that occur after a vaccine is administered. These outcomes can be directly connected to the vaccine or unrelated; tracking them helps vaccine manufacturers detect new adverse consequences and keep an eye on existing side effects. Vaccine providers are required to report these adverse events to the Vaccine Adverse Event Reporting System (VAERS), which, for some reason, is separate from the CDC’s primary IIS.
    • Once COVID-19 vaccination begins, the CDC will report national vaccination data on a dashboard similar to the agency’s existing flu vaccination dashboard. According to the playbook, this dashboard will include estimates of the critical populations that will be prioritized for vaccination, locations of CDC-approved vaccine providers and their available supplies, and counts of how many vaccines have been administered.

    I have to clarify, though: all of the guidelines set up in the CDC’s playbook reflect what should happen when vaccines are implemented. It remains to be seen whether already underfunded and understaffed public health agencies, hospitals, and health clinics will be able to store, handle, and distribute multiple vaccine types at once, to say nothing of adapting to another new federal data system.

    My COVID-19 vaccination data wishlist

    This second section is inspired by an opinion piece in STAT, in which physicians and public health experts Luciana Borio and Jesse L. Goodman outline three necessary conditions for effective vaccine distribution. They argue that confidence around FDA decisions, robust safety monitoring, and equitable distribution of vaccines are all key to getting this country inoculated.

    The piece got me thinking: what would be my necessary conditions for effective vaccine data reporting? Here’s what I came up with; it amounts to a wishlist for available data at the federal, state, and local levels.

    • Unified data definitions, established well before the first reported vaccination. Counts of people who are now inoculated should be reported in the same way in every state, county, and city. Counts of people who have received only one dose, as well as those who have experienced adverse effects, should similarly be reported consistently.
    • No lumping of different vaccine types. Several vaccines will likely come on the market around the same time, and each one will have its own storage needs, procedures, and potential effects. While cumulative counts of how many people in a community have been vaccinated may be useful to track overall inoculation, it will be important for public health researchers and reporters to see exactly which vaccine types are being used where, and in what quantities.
    • Demographic data. When the COVID Racial Data Tracker began collecting data in April, only 10 states were reporting some form of COVID-19 race and ethnicity data. North Dakota, the last state to begin reporting such data, did not do so until August. Now that the scale of COVID-19’s disproportionate impact on racial and ethnic minorities is well documented, such a delay in demographic data reporting for vaccination would be unacceptable. The CDC and local public health agencies will reportedly prioritize minority communities in vaccination, and they must report demographic data so that reporters like myself can hold them accountable to that priority.
    • Vaccination counts for congregate facilities. The CDC specifically acknowledges that congregate facilities, from nursing homes to university dorms to homeless shelters, must be vaccination priorities. Just as we need demographic data to keep track of how minority communities are receiving vaccines, we need data on congregate facilities. And such data should be consistently reported from the first phase of vaccination, not added to dashboards sporadically and unevenly, as data on long-term care facilities have been reported so far.
    • Easily accessible resources on where to get vaccinated. The CDC’s vaccination dashboard will reportedly include locations of CDC-approved vaccine providers. But will it include each provider’s open hours? Whether the provider requires advance appointments or allows walk-ins? Whether the provider has bilingual staff? How many vaccines are available daily or weekly at the site? To be complete, a database of vaccine providers needs to answer all the questions that an average American would have about the vaccination experience. And such a database needs to be publicized widely, from Dr. Redfield all the way to local mayors and school principals.