Tag: school reopening

  • Opening profile: Community over wifi in Garrett County, Maryland

    Opening profile: Community over wifi in Garrett County, Maryland

    By Betsy Ladyzhets

    Staff at Broad Ford Elementary School in Garrett County, Maryland. Photo via the district’s website.

    It’s difficult to get good internet access in Garrett County, Maryland. The county lies in the Appalachian Mountains, full of peaks and ridges, trees and rivers. This geography blocks signals and slows internet speeds, even for Garrett County residents who do have a router at home. And the county’s southern edge meets the National Radio Quiet Zone, where cell and internet service is restricted in order to preserve data collection for West Virginia’s Green Bank Telescope.

    Even Barbara Baker, superintendent of Garrett County Public Schools, has a hard time getting service: During her interview with the COVID-19 Data Dispatch, poor Zoom quality forced the conversation onto a phone call.

    “Working from home, teaching from home, and learning from home was a huge hurdle for us to overcome,” Baker said.

    Of course, such a wifi-challenged district is not cut out for virtual classes, making in-person school a priority. Unlike other districts in Maryland, Garrett County Public Schools was able to bring the majority of its students back to classrooms during the spring 2021 semester. The district built trust with its community by utilizing local partnerships, providing families with crucial supplies, setting up task forces to plan reopening, and communicating extensively with parents.

    Garrett County’s school district is the subject of the second profile in the COVID-19 Data Dispatch’s “Opening” series. Alongside four other school communities, we selected it because the majority of the district’s students returned to in-person learning during the 2020-2021 school year — and officials identified COVID-19 cases in under 5% of the student population. (According to the CDC, about 5% of school-aged children in the U.S. have contracted COVID-19 since the start of the pandemic.)

    Demographics for Garrett County, Maryland
    Census population estimates, July 2019

    • Population: 29,000
    • Race: 96.2% white, 1.2% Hispanic/Latino, 1.1% Black, 1.0% two or more races, 0.4% Asian
    • Education: 89.8% have high school degree, 20.9% have bachelor’s degree
    • Income: $52,600 is median household income, 12.8% in poverty
    • Computer: 84.6% have a computer, 76.9% have broadband internet
    • Free lunch: 47.8% of students eligible for free or reduced-price lunch1

    COVID-19 stats for Garrett County Public Schools

    • Total enrollment: 3,600 students2
    • In-person enrollment: 86% after reopening for a four-day week in March2
    • Total cases, 2020-2021 school year:
      • 5 cases in the fall (identified by the state in two elementary school outbreaks)3
      • 17 cases in the spring (15 rapid test positives, 2 PCR test positives); none identified by the state as outbreaks4

    1Source: National Center for Education Statistics
    2Source: Interview with Superintendent Barbara Baker
    3Source: Maryland COVID-19 School Outbreaks dataset
    4Source: Data from School Health Services Manager Rebecca Aiken


    Spring 2020: Combatting remote challenges, in-person preparation

    Due to wifi issues and a learning curve with the district’s online platform, in spring 2020, Garrett County families and educators struggled to access remote classes. But the district used this time to prepare for its eventual return by providing computers, tablets, and wifi hotspots resources to students and building trust for the next year.

    The district used a federal grant to purchase about 1,000 wifi hotspots, which were both distributed to students and set up in central locations to which families could easily drive. At a total of 650 square miles, Garrett County is relatively large, and with under 50 people per square mile, its residents are fairly spaced out. Administrators aimed to set up hotspots in enough locations that nobody would need to drive more than ten miles to access wifi.

    At the same time, district staff delivered meals to families. About half of Garrett County students are eligible for free lunch, according to the National Center for Education Statistics. Scott Germain, the district’s food services supervisor, quickly pivoted from cafeteria meals to meals on the road. His team brought food from the district’s twelve schools to churches, community centers, and other central locations so that families could avoid traveling more than a few miles.

    Like many other districts, Garrett County took advantage of federal grant money to improve ventilation and cleaning at school buildings. But unlike others, this district stands out for a unique, collaborative strategy used to plan its return to classrooms in fall 2020. 

    The district brought stakeholders together through “TIGER teams”, or “Targeted Immediate Group Execution and Response” teams. Each team was composed of people from varied backgrounds, all unified around a singular reopening-related goal, such as COVID-19 testing and learning connectivity. Teams typically included at least one parent, one community member, and one doctor, health department officer, or other relevant expert.

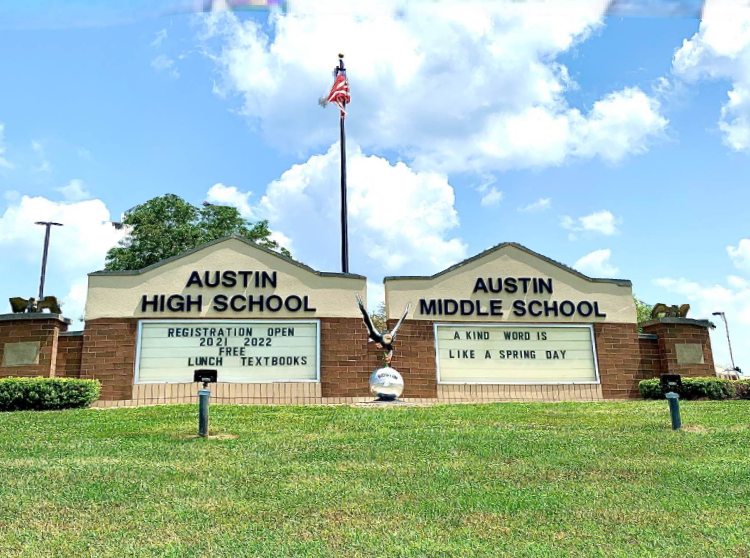
    Similarly to Austin, Indiana, partnerships between the school district and the local public health department proved crucial in reopening. While school buildings were closed in spring 2020, the district’s nursing staff worked with the Garrett County public health department to run testing sites.

    “We just became one agency, almost, for a while,” said School Health Services Manager Rebecca Aiken of the school’s nursing staff and the local health department. School nurses were able to expertly swab students who came to class with COVID-19 symptoms when classrooms opened up in the fall.

    Fall 2020: Hybrid, then back to virtual

    The fall 2020 semester started with a hybrid model, due to concerns about maintaining six-foot spacing between students in every classroom. Most students were coming in for two days in person, while Wednesday was reserved as a day where children worked remotely on their own, giving teachers extra prep time. A small number of students opted to stay all-remote and another small number, identified by the district as most likely to fall behind during remote learning, came in all four days. (Precise numbers are not available, but administrators estimate that 10% to 15% were in all four days during this time.)

    During the hybrid period, the state of Maryland identified two small outbreaks at Garrett County schools. The state defines a classroom outbreak as at least two confirmed COVID-19 cases among teachers, students, and staff within a two-week period; cases must be epidemiologically linked but not within the same household. Maryland data reveal two cases at Route 40 Elementary School and three at Yough Glades Elementary School, from October to December.

    Despite these relatively low case numbers, the hybrid model was short-lived: Rising cases in Maryland forced the district to return to virtual-only learning in November. Still, the district was better prepared this time. More students had computers and wifi, and teachers and families were familiar with the district’s online platform.

    That return to remote made administrators even more determined to bring students back in the spring. In January, Maryland governor Larry Hogan ordered all school systems to bring kids back to at least hybrid instruction by March 1; this order “gave a little bit of teeth” to Garrett County school leadership, Superintendent Baker said.

    Spring 2021: Communication and trust

    By March 1, Garrett County students were back in classrooms four days a week. Wednesday remained an asynchronous preparation day for teachers, most of whom still had a small number of remote-only students in their classes.

    Feedback from teachers informed that schedule, but the district also actively solicited — and responded to — feedback from parents. Administrators collected feedback through surveys, and principals made personal phone calls to check in on parents. Questions from parents were funneled into a detailed FAQ document on the district’s website; the document currently stands at 22 pages long and was, at times, updated multiple times a day.

    “[Parents knew] we were listening, that we knew that they had questions and that we were trying to answer them to the best of our ability,” Baker said.

    Garrett County Public Schools FAQ document. Screenshot retrieved on August 22.

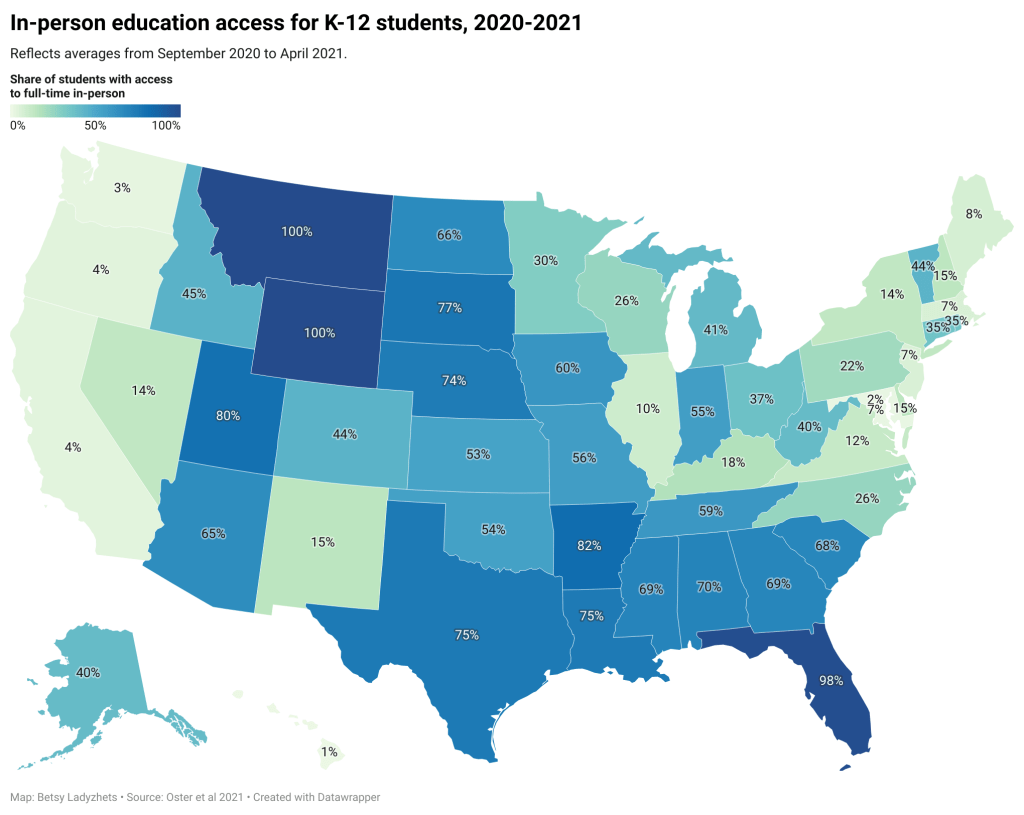
    This detailed attention to parent feedback — combined with the trust built up by providing technology, food, and other services — may be one reason why Garrett County bucks Maryland’s overall trend in bringing students back to classrooms. According to a study published in the Centers for Disease Control and Prevention’s Morbidity and Mortality Weekly Report, over three-quarters of Maryland K-12 students only had access to fully remote learning during the 2020-2021 school year. In Garrett County, though one day remained remote, 86% of students returned to almost-full-time in-person learning by the end of the spring semester.

    “I think it was a real testament to the fact that the families trusted that we would keep their children safe, that we would put the safety protocols into place,” Baker said.

    Indeed, between late March and early May this year, only 17 students and staffers tested positive for COVID-19 in the schools, well under one percent of the district population. These numbers do not reflect all cases in the district, according to Aiken, head of school health services, because some students were not tested through the school. She said that all of these students were infected outside the school setting — at part-time jobs, social gatherings, and other community functions — and quick contact tracing through the local health department helped prevent spread at schools themselves.

    On Sept. 7 this year, all Garrett County students will be back in the classroom, all five days a week. As the fall safety plan currently stands, masks are strongly recommended (though not required), but enhanced ventilation, three feet distancing, testing, and other protocols will continue. Additional precautions may be added before the school year starts, Chief Academic Officer Nicole Miller said in an email on August 18.

    Principals prepared for the transition by once again calling parents to have one-on-one conversations about their concerns, with a focus on the families who chose remote learning last spring. The health services team prepared with vaccination clinics for students and staff; the vast majority of school staff (92% as of late July) are vaccinated already, thanks in part to similar clinics in the spring. Administrators also continue to update their FAQ document, solicit feedback, and build trust with their community — building connections where wireless internet networks have failed.

    “We had the collaboration, and we had the connections, and we had the framework built before this happened,” Aiken said. “I think that’s what made [reopening] so successful.”


    The COVID-19 Data Dispatch’s “Opening” series is available for other publications to republish, free of charge. If you or your outlet is interested in publishing any part of this series, please contact betsy@coviddatadispatch.com.

    More from the Opening series

  • Opening profile: Public health collaboration in Austin, Indiana

    Opening profile: Public health collaboration in Austin, Indiana

    By Betsy Ladyzhets

    The middle and high school campus in Austin, Indiana. Photo from the Scott County School District 1 Facebook page.

    In 2015, Austin, Indiana was hit with a deadly epidemic: HIV/AIDS. This city, then over 4,000 people, saw over 200 HIV cases in about a year during its outbreak, which one health reporter called “the worst drug-fueled HIV outbreak ever to hit rural America.”

    So when the COVID-19 pandemic hit, the small city was prepared to respond. The school district and public health department took advantage of their existing relationship and community trust to plan for a safe school reopening that stands out as one of the most successful in the state, according to a COVID-19 Data Dispatch analysis.

    “The HIV outbreak actually brought a lot of people together,” said Brittany Combs, a Scott County public health nurse who worked with the district. “We all came to the same table and figured out what we needed to do to tackle the HIV outbreak. And so, for the pandemic, we all were already at the table.”

    This school district, Scott County School District 1, is the subject of the first profile in the COVID-19 Data Dispatch’s “Opening” series. Alongside four other school communities, it was selected because the majority of the district’s students returned to in-person learning during the 2020-2021 school year — and under 5% of the student population was identified as a COVID-19 case. (According to the CDC, about 5% of school-aged children in the U.S. have contracted COVID-19 since the start of the pandemic.)

    While Austin’s experience with HIV/AIDS is unique, the school district offers lessons for other communities. An open line of communication between Austin’s county public health agency, school administrators, and other local leaders fostered an environment of collaboration and trust. Plus, the administrators took advantage of teachers’ and parents’ knowledge of their students to make them an integral part of identifying COVID-19 cases and stopping outbreaks.

    Demographics for Austin, Indiana
    American Community Survey 2019 5-year estimates

    • Population: 3,700
    • Race: 97.8% white, 0.7% Native American, 0.8% other, 0.8% two or more races
    • Education: 75.8% have high school degree, 4.7% have associate’s degree, 2.0% have bachelor’s degree
    • Income: $34,200 is median household income, 27.4% in poverty
    • Computer: 80.6% have a computer, 65.9% have broadband internet1
    • Free lunch: 64.7% of students eligible for free or reduced-price lunch2

    COVID-19 stats for Scott County School District 1, 2020-2021

    • Total enrollment: 1,200 students2
    • In-person enrollment: About 80% at the start of the year, 85% at the end3
    • Total cases, 2020-2021 school year: 47 in students, 25 in staff4
      • 13 elementary school students (Austin Elementary School)
      • 19 middle school students (Austin Middle School)
      • 15 high school students (Austin High School)

    1Source: County-level statistic
    2Source: National Center for Education Statistics
    3Source: Interview with Superintendent Trevor Jones
    4Source: Data from Head School Nurse Deana Broadus. Numbers include students who did not attend in-person classes while sick, but whose cases were reported to the district.


    Public health collaboration

    In planning for reopening the school district after spring 2020 closures, the public health department had “constant meetings with the school,” Combs said. The existing relationship between the school and public health experts streamlined these meetings. And thanks to past outreach efforts around HIV and opioids, the public health department already had relationships with Austin families.

    “I like to think that the health department already has a lot of trust because we were in the news a lot, we were forefront a lot, so they kinda know who we are,” Combs said. “Hopefully, the majority of the county really trusted in what we said.”

    Families were also likely to collaborate with the school district because they wanted their kids back in classrooms, according to Superintendent Trevor Jones. He referenced Austin’s high poverty level (27.4%, compared to a national average of 10.5%) and explained that the majority of students get free breakfast and lunch. Combined with the community’s past drug abuse issues, he said, there was ample motivation among parents and teachers alike to protect students from the isolation of remote learning.

    “The safest place our kids can be is here at school,” Jones said.

    While the schools had some basic safety measures in place, such as six-foot spacing, masks required everywhere except at spaced-out desks, and regular handwashing, this community trust paid off most in identifying students with COVID-19 symptoms. Deana Broadus, head school nurse at the district, said that teachers and parents acted as a first line of defense in identifying symptoms. At the beginning of the school day, teachers took students’ temperatures and asked them about other symptoms.

    “As the school year went on, teachers [get to] know their kids,” Broadus said. “They can kind of tell, oh, she doesn’t look that well today, go see the nurse.”

    Broadus and the other school nurses also got to know their students by following up on symptom questionnaires and developing medical histories. Some students would erroneously mark every symptom on the checklist, she said: “You get to know who’s trying to go home.” In other cases, the symptom checks inspired the nurses to keep better track of seasonal allergies, recurring stomach aches, and other chronic conditions that were previously reported by parents but not thoroughly documented by the school.

    Parents took part in the informal COVID-19 surveillance, too. “Parents would call in and report certain symptoms,” Broadus said. “[Students] either needed a doctor’s note or a negative COVID test to return to school.”

    The procedure was similar if a student was sent home. While the district initially quarantined full classes following a positive case, the strategy shifted to close-contact identification: figuring out which students had sat next to an infected child. Broadus said that the chief concern she heard from parents calling in to report a case was often ensuring that no more children than necessary would need to miss in-person class, though students who missed class could still follow along online.

    Keep sick students home

    Through collaboration with the public health department — which took charge of contact tracing for parents, staff and other non-students — Broadus found that the vast majority of school cases came from outside the buildings. 

    “Usually what we found was that a parent or someone else that the child lived with was sick, and then subsequently the student got sick,” she said. And among those students, cases were typically identified quickly enough that the virus didn’t spread to others.

    One of the Austin district’s major lessons from the past school year was the importance of telling families to keep their kids home if they were sick. In the past, students and staff alike tended to “push through it” and still come in if they didn’t feel well, Broadus said. Now, the policy is to stay home from school or work if you have any symptoms, not just those matching COVID-19. To reinforce this, Jones said, the district is removing rewards for perfect attendance and similar bonuses for staff. The schools are also continuing to emphasize handwashing and other good hygiene habits.

    Still, the district did not avoid cases entirely. A total of 47 students contracted COVID-19 over the course of the school year, including 13 students at Austin Elementary School, 19 at Austin Middle School, and 15 at Austin High School — or about 4% of the district’s total enrollment. According to Broadus, the district identified the most cases (17 total) during November and December 2020, at the peak of the fall COVID-19 surge. The district added additional COVID-19 safety precautions at this time, such as limiting spectators at sporting events.

    Delta poses new challenges

    This fall, Austin’s school district is facing further challenges amplified by the country’s Delta surge. School started in-person on August 3; unlike the previous year, masks were optional. Several student cases in the first week of school led the district to switch to all-virtual classes for two weeks, Superintendent Jones said in an email on August 10.

    When students return after this virtual period, COVID-19 symptom monitoring will continue — though the district is phasing out formal checklists that proved to be less helpful than parent and teacher intuition. The six-feet distancing rule has shrunk to three feet. Ventilation has also improved, thanks to grant money from the federal government for which many districts were able to apply.

    Austin will continue to rely on its community to identify cases and stay safe in the new school year. “I feel like it wasn’t just one thing that we were doing,” Broadus said. “Everyone was working together.”


    The COVID-19 Data Dispatch’s “Opening” series is available for other publications to republish, free of charge. If you or your outlet is interested in publishing any part of this series, please contact betsy@coviddatadispatch.com.

    Update, Sept. 7, 2021: After two weeks of all-virtual classes in August 2021 prompted by high case numbers, the Austin school district returned to the COVID-19 safety protocols followed in the previous school year. Masks are once again required whenever students are not stationary at distanced desks, and desk spacing is back at six feet where possible. “We made some adjustments to our COVID procedures that have minimized the number of students in quarantine,” Superintendent Jones said in an email on Sept. 7.

    More K-12 schools reporting

  • Opening: Five school districts that kept their communities safe

    Opening: Five school districts that kept their communities safe

    It’s impossible to overstate how controversial school reopening has become in the U.S. this past year. After a spring of universal Zoom school, the country diverged: some administrators, parents, and scientists were determined to get kids back in classrooms, while others prioritized COVID-19 safety above all else.

    Reopening debates have dominated headlines. In August 2020, images of maskless crowds in Georgia’s Cherokee County School District went viral on social media — and the school quarantined hundreds of students just one week after the semester started. That same month In New York City, teachers brought handmade coffins and a guillotine to a protest against Mayor Bill de Blasio’s reopening plan. Chicago’s schools remained closed through the fall, and the teachers union narrowly avoided a strike during reopening negotiations in early 2021. And districts like Brookline, a liberal Massachusetts suburb, saw parents who are health experts feud with teachers over social distancing, vaccinations, and more.

    The divided communities made the news — but not all U.S. schools were fighting grounds. In fact, many districts managed to bring the majority of their students back into classrooms without breeding a dreaded COVID-19 outbreak.

    Here, at the COVID-19 Data Dispatch, we’re sharing stories from five such communities. The series will be published in installments: one profile a week for the next five weeks, followed by a conclusion with overall insights and lessons for fall 2021.

    This project fits into a school of reporting called “solutions journalism.” Rather than focusing on uncovering society’s problems, this type of journalism seeks to identify and uplift responses to these problems. In other words, instead of asking, “Why was it so hard to reopen schools in the U.S?”, the CDD is asking, “Which schools did reopen, and what made them successful?” The Solutions Journalism Network — which, as you may guess from the name, is a nonprofit that supports solutions journalism — provided the CDD with a grant to pursue this project, as well as trainings and other guidance.

    Identifying districts that reopened

    Before introducing you to the five districts that we profiled, let’s talk methodology, also known as how these districts were selected for the project. As we’ve discussed at length here at the CDD, there’s a lack of good data on COVID-19 cases in schools. The country is approaching a fourth pandemic semester, but the federal government still does not provide comprehensive information on how many students are attending public school in person or how many of them have contracted the virus. And while the majority of states provide some data on this topic, these data are scattered and unstandardized — and some states have even gotten worse at their reporting since the 2020-2021 school year ended. 

    So, to identify success stories for this project, we relied on two main sources. First, we used a database which tracks in-person attendance change at school districts across the country, covering approximately 94% of districts across 98% of U.S. counties. These data come from SafeGraph, a company that aggregates location data from cell phones; this database was also used in a March 2021 Nature paper on disparities in school closures. Using the SafeGraph data, we could see which districts had high in-person traffic numbers in spring 2021 compared to shutdowns during spring 2020, indicating that the majority of students returned.

    It’s important to establish here that the aim of this data analysis was not to identify the districts that had the biggest in-person comebacks or to do any kind of comprehensive ranking. Instead, we looked for outliers: districts that had a larger attendance change than the schools around them.

    This geography-based method was important because the 2020-2021 school year looked very different from one state to the next. For example, in New York City, just over one-third of public school families attended school in-person before June 2021, per the New York Times. Meanwhile, in Texas, the majority of schools had at least 70% of students back in-person by spring 2021, according to data from the state department of health.

    !function(){“use strict”;window.addEventListener(“message”,(function(e){if(void 0!==e.data[“datawrapper-height”]){var t=document.querySelectorAll(“iframe”);for(var a in e.data[“datawrapper-height”])for(var r=0;r<t.length;r++){if(t[r].contentWindow===e.source)t[r].style.height=e.data["datawrapper-height"][a]+"px"}}}))}();

    You can see the variation in the map above, based on a study published in the Centers for Disease Control and Prevention’s Morbidity and Mortality Weekly Report earlier this summer. According to this analysis, every single student in Montana and Wyoming had access to in-person learning five days a week, between September 2020 and April 2021, while in Maryland, just 2.3% of students had that access during the same period.

    Comparing COVID-19 case numbers

    After using the SafeGraph dataset to identify outliers in a given state, we used data from state public health departments to identify districts’ COVID-19 case numbers. This step restricted the analysis to states that provided a.) COVID-19 case data by individual district and b.) data for the entire school year. Few states meet both of these criteria. It’s no coincidence that New York and Texas — also the only two states providing in-person enrollment numbers — are both represented among the five focus districts of this project.

    You can find more information on state K-12 data reporting at the CDD’s annotations page here.

    !function(){“use strict”;window.addEventListener(“message”,(function(e){if(void 0!==e.data[“datawrapper-height”]){var t=document.querySelectorAll(“iframe”);for(var a in e.data[“datawrapper-height”])for(var r=0;r<t.length;r++){if(t[r].contentWindow===e.source)t[r].style.height=e.data["datawrapper-height"][a]+"px"}}}))}(); !function(){“use strict”;window.addEventListener(“message”,(function(e){if(void 0!==e.data[“datawrapper-height”]){var t=document.querySelectorAll(“iframe”);for(var a in e.data[“datawrapper-height”])for(var r=0;r<t.length;r++){if(t[r].contentWindow===e.source)t[r].style.height=e.data["datawrapper-height"][a]+"px"}}}))}();

    Over the next few weeks, you’ll learn about how schools from rural Indiana to New York City faced the challenge of bringing kids back to classrooms while keeping their communities safe. Some took advantage of novel COVID-19 technologies, such as tests and ventilation updates. But others utilized less technical strategies such as personalized communication with parents and close collaboration with local public health officials.

    As the Delta variant intensifies reopening challenges for this coming fall, the stories of these five communities tell us that virus cases can be kept down during in-person learning if administrators, teachers, and families all work together.

    These schools are:

    • Scott County School District 1 in Austin, Indiana
    • Garrett County Public Schools in Garrett County, Maryland
    • Andrews Independent School District in Andrews, Texas
    • Brooklyn Arts and Science Elementary School in Brooklyn, New York
    • Port Orford-Langlois School District 2CJ in Curry County, Oregon

    The COVID-19 Data Dispatch’s “Opening” series is available for other publications to republish, free of charge. If you or your outlet is interested in publishing any part of this series, please contact betsy@coviddatadispatch.com.

    Past K-12 schools reporting

    • COVID-19 school data remain sporadic
      On November 18, New York City mayor Bill de Blasio announced that the city’s schools would close until further notice. The NYC schools discrepancy is indicative of an American education system that is still not collecting adequate data on how COVID-19 is impacting classrooms—much less using these data in a consistent manner.
  • Teachers can get vaccinated in every state, but we don’t know how many are

    As of this past Monday, K-12 teachers in every state are now eligible for vaccination. Teachers were already prioritized in most of the country, but Biden directed the remaining states to adjust their priority lists last week. The federal government also pulled teachers into the federal pharmacy program, previously used for long-term care facilities.

    This is great news, of course—teachers should get vaccinated ASAP so that they can safely return to their classrooms, allowing schools to reopen in person with much lower risk. Vaccinations have become a stipulation for reopening, in fact, in some states like Oregon, even though the CDC has said this should not be a requirement.

    But there’s one big problem: we have no idea how many teachers have actually been inoculated. Sarah wrote about why we need occupational data on vaccinations a few weeks ago:

    For example, NYC has included “in-person college instructors” in eligibility for the vaccine since January 11. Wouldn’t it be nice to know just how many in-person professors have gotten vaccinated? It’d sure be helpful if Barnard ever decides to do in-person classes again. Or what about taxi drivers? Again in NYC, because that’s where I live, they became eligible for vaccination on February 2. From a personal standpoint, I’d like to know if I could send my taxi driver to the hospital if my mask slips.

    The data situation hasn’t improved since February. New York’s report of vaccine coverage among state hospital workers is still the closest thing we have to occupation reporting. A recent article from EdWeek sheds some light on the issue, citing privacy concerns and a lack of data from vaccine administration sites themselves:

    Some state agencies and districts have said privacy concerns prevent them from tracking or publishing teacher vaccination data. Others say vaccine administration sites are not tracking recipients’ occupations and they are not in position to survey employees themselves.

    It appears that state and local public health departments were even less prepared to track occupations of vaccine patients than they were to track those patients’ race and ethnicity. But without these numbers, it may take even longer for students to return to classrooms, as evidenced by this quote from Megan Collins, co-director of the Johns Hopkins Consortium for School-Based Health Solutions:

    “We’re seeing a substantial disconnect. There are states not prioritizing teachers for vaccine that are fully open for in-person instruction, and others that are prioritizing teachers for vaccines, but aren’t open at all,” Collins said. “If states are going to use teacher vaccinations as a part of the process for safely returning to classrooms, it’s very important then to be able to communicate that information so people know that teachers are actually getting vaccines.”

    Biden’s administration has also given schools more money for testing, allocating $650 million in grants to help public schools get access to tests, testing supplies, and logistical assistance. But of course, school testing isn’t being tracked either. New York continues to be the only state that reports detailed data in this area; see our K-12 school data annotations for more info.

    Related posts

    • COVID-19 school data remain sporadic
      On November 18, New York City mayor Bill de Blasio announced that the city’s schools would close until further notice. The NYC schools discrepancy is indicative of an American education system that is still not collecting adequate data on how COVID-19 is impacting classrooms—much less using these data in a consistent manner.
  • New schools guidance fails to call for data reporting

    New schools guidance fails to call for data reporting

    This past week, the Centers for Disease Control and Prevention (CDC) released a long-awaited guidance on school reopening.

    While the CDC isn’t able to actually regulate what schools do, many state and local leaders look to the agency for advice on how to best follow the available scientific evidence. And, if you’ve been following the reopening debate, you know that there are a lot of differing opinions on how to best follow the available scientific evidence. Pro-opening advocates hoped to see the CDC strongly insist that schools go in-person, perhaps with limited cleaning and allowing less than six feet of distancing. Pro-closure advocates hoped to see the agency insist that teachers needed to be vaccinated before they could go back to their classrooms.

    Rather than strictly advocating for either closed or open classrooms, however, the guidance takes a moderate route. It emphasizes three strategies already familiar to school leaders: layering different COVID-19 protection methods (masks, distancing, ventilation, and so on); looking at COVID-19 cases in the surrounding community to determine whether it’s safe for you to open; and having multiple opening “phases” available depending on community safety. Frequent testing and vaccinations of school staff are included as “additional” options, which the CDC suggests schools should employ if they have the resources.

    New York Times reporter Apoorva Mandavilli, who has covered the epidemiological questions around reopening, wrote a Twitter thread that further explains why this is a moderate route:

    My big question of this guidance, though, was: what does this mean for data? As we’ve written in the CDD before, the Biden administration has the opportunity to correct a longstanding failure of its predecessor. Under Biden, national public health leadership could require that all public schools report their case counts, testing numbers, and enrollment numbers to the federal government—and publish these figures in a systematic way. But the new CDC guidance largely retains the status quo for school COVID-19 data.

    “Every COVID-19 testing site is required to report to the appropriate state or local health officials all diagnostic and screening tests performed,” the guidance says. This requirement has been in place since last spring. Similarly, the CDC says that school administrators should notify parents, teachers, and staff when cases are reported—again, such internal reporting systems are already in place.

    But there’s no mention of making these data public. The CDC is not promising a national school data dashboard, or even requiring state and local public health departments to put their data up on a portal with the rest of their COVID-19 figures.

    You’d think that state and local agencies wouldn’t need such a push, over a year into the pandemic. But, as we’ve reported in the CDD before, the vast majority of states currently fail to publish K-12 COVID-19 data in a way that makes it possible to actually track transmission rates in schools.

    While 34 states and D.C. regularly report counts of COVID-19 cases that have occurred in schools, 16 states report incomplete data—or no data at all. And for the states that do report case counts, most don’t report enrollment numbers, making it difficult to discern whether the virus is impacting a single family or running rampant in a school. (Four cases in a school with 4,000 kids in classrooms, for example, is vastly different from four cases in a school with 100 kids in classrooms.)

    New York continues to be the model state for K-12 data, as it’s one of only four to report enrollment numbers and the only state to report school-specific testing numbers. As the CDC seems to consider systematic school testing “optional,” it seems likely that this will continue.

    We can see that most counties in the U.S. have high enough community transmission rates—or, COVID-19 cases in the general public—that the CDC’s new guidance would categorize them as being in the “red zone,” a.k.a. too dangerous for schools to be open. But without case numbers for schools themselves, reported in a standard way, it’s hard to know whether the CDC’s assessment is accurate.

    School data continues to be a massive gap in America’s pandemic tracking. Readers, I urge you to see what data are available for your state, county, and district—and push your local officials to be more transparent. 

    Dashboard by Benjy Renton.

    Related posts

    • COVID-19 school data remain sporadic
      On November 18, New York City mayor Bill de Blasio announced that the city’s schools would close until further notice. The NYC schools discrepancy is indicative of an American education system that is still not collecting adequate data on how COVID-19 is impacting classrooms—much less using these data in a consistent manner.
  • Experts say schools could reopen, but data are still scarce

    The medical journal JAMA released an article written by three CDC officials about opening schools. The conclusion was that it appears that reopening schools safely is possible—but before we turn everyone loose, there are a lot of caveats. And critically, protective measures that need to be taken are not limited to the schools themselves. 

    When experts say that schools can be reopened safely, it means that so far, schools haven’t been driving community transmission the way other public spaces remaining open have. In a case study comparing 154 students who had been infected with SARS-CoV-2 and 243 who had not, schools posed much less of an infection risk than other social activities. The paper also cited two case studies, one from North Carolina and one from Wisconsin, where cases in general were fairly uncommon, and the vast majority of the recorded cases came from cases acquired from the community, not the schools. 

    It’s clearly inaccurate to say that COVID-19 simply hasn’t hit schools. Indeed, if it hadn’t, we wouldn’t need our school trackers. And while many US school outbreaks have mostly been small, it’s not impossible a future outbreak could be anything but. The JAMA paper cites an outbreak in Israel where out of 1161 students and 151 staff members tested, 153 and 25 cases were found in students and staff, respectively, within two weeks of reopening. “Crowded classrooms…, exemption from face mask use, and continuous air conditioning that recycled interior air in closed rooms” were cited as contributing to the outbreak. Additionally, school-related activities such as extracurriculars and athletics could also pose a higher risk.

    For longtime readers of this newsletter or even for anyone who’s kept up with the news, the path to reopening schools may sound familiar. Measures taken need to include universal mask use, a robust screening program, physical distancing, and hybrid models of education to reduce classroom density (including online options). But, critically, the article also stresses that measures need to be taken in the surrounding community to reduce spread, singling out indoor dining in particular. Indeed, schools are not isolated islands; the health of students returning for school depends on if a community can control the spread. Schools themselves may not be driving much community spread, but if COVID-19 is running uncontrolled in the community, it’s still not going to be safe to hold in-person classes. 

    While it is exciting that schools reopening may be on the horizon, safe schools are nowhere near promised if governments and administrations aren’t willing to take necessary measures to control community spread. Closing restaurants and gyms is politically unpopular in many places. The economic incentives to keep indoor dining and to open movie theaters are hard to ignore. It may be a choice – open your schools and keep tight restrictions everywhere else, or loosen restrictions on dining and gyms and keep schools online. It’s not an easy choice. But, as the JAMA article points out, “Committing today to policies that prevent SARS-CoV-2 transmission in communities and in schools will help ensure the future social and academic welfare of all students and their education.”

    Two days after the JAMA article was published, NYT columnist David Brooks published a column decrying teachers unions and insisting that schools reopen, citing financial concerns for students in the future and current mental health problems. He pointed out that typically, white students have had greater access to in-person learning than black and brown students, going on to say: “I guess I would ask you, do Black lives matter to you only when they serve your political purpose? If not, shouldn’t we all be marching to get Black and brown children back safely into schools right now?”

    The response was swift, with many pointing out that the pandemic has disproportionately affected black and brown communities in terms of infection and death rates, and that they are more likely to live in underfunded communities where it might be a lot harder to keep students and staff safe. and that teachers maybe shouldn’t be blamed for not wanting to go back to work when there is still uncontrolled spread across the country. This Twitter thread sums up a lot of the backlash. 

    Indeed, even if schools do open up, as we talked about in our January 17 issue, we’re still having a lot of problems tracking cases. There still isn’t a federal dataset; however, there is reason to hope that we’ll get some better federal data soon after Biden included a call for data to inform safe K-12 school reopening and data on the pandemic’s impact on teachers and students in his executive order on school reopening(See the CDD’s K-12 school data annotations here.)

    We do know that black and brown children have been disproportionately affected by the pandemic; Hispanic/Latino and Black children account for 38.2% of cases in their age group while Hispanic/Latino and Black people account for only 31.4% of Americans. If schools do reopen in person, it’s clear that actions need to be taken to address structural inequity that would prevent them from doing so safely.

    Related posts

    • COVID-19 school data remain sporadic
      On November 18, New York City mayor Bill de Blasio announced that the city’s schools would close until further notice. The NYC schools discrepancy is indicative of an American education system that is still not collecting adequate data on how COVID-19 is impacting classrooms—much less using these data in a consistent manner.
  • Schools are reopening (again), but we still can’t track them

    Schools are reopening (again), but we still can’t track them

    !function(){“use strict”;window.addEventListener(“message”,(function(a){if(void 0!==a.data[“datawrapper-height”])for(var e in a.data[“datawrapper-height”]){var t=document.getElementById(“datawrapper-chart-“+e)||document.querySelector(“iframe[src*=’”+e+”‘]”);t&&(t.style.height=a.data[“datawrapper-height”][e]+”px”)}}))}();

    K-12 schools across the country are open for the spring semester, even as America faces serious outbreaks in almost every state and a more contagious strain—more contagious for both children and adults—begins to spread. At the national level, we are still overwhelmingly unable to track how the virus is spreading in these settings.

    Perhaps the most newsworthy opening this week was in Chicago, where students returned to classrooms for the first time since last March. Chicago’s teachers union has waged an ongoing battle with Mayor Lori Lightfoot and district CEO Janice Jackson, whom teachers claim have not resolved ongoing safety issues in school buildings. The district is screening staff through optional rapid tests once a month; about 1,200 tests have been reported so far, including three positive results. Four Chicago students and 34 other staff members reported COVID-19 cases this week.

    Meanwhile, President-elect Joe Biden announced a $175 billion plan aimed at getting students back to in-person learning. The plan includes $35 billion for higher education and $130 billion for public K-12 schools, with a focus on increasing testing, PPE for students and teachers, ventilation, and other safety measures for which educators have been calling since last spring.

    Biden hopes to open “the majority of K-8 schools,” according to Education Week’s Evie Blad. A recent report by the CDC suggests that in-person learning for these younger students, when implemented safely, is not likely to seed an outbreak in the wider community. (College-aged students in the 18-24 range are more likely to cause such outbreaks.)

    The report says: “CDC recommends that K–12 schools be the last settings to close after all other mitigation measures have been employed and the first to reopen when they can do so safely.”

    But, as Blad points out, it will be difficult to track the impact that more school reopening would have on broader communities, as data on COVID-19 cases in schools are still limited and fractured. There is still no federal dataset on COVID-19 in American public schools. State datasets are fully unstandardized; and most states only report case counts, making it difficult to actually analyze how school outbreaks compare across schools.

    As of our most recent K-12 state annotation update, only Delaware, New York, and Texas are providing enrollment numbers, and only New York is providing testing numbers.  (Thank you to intern Sarah Braner for doing the update this week!)

    In last week’s recommended reading section, I featured an op ed in Nature by school data leader Emily Oster calling on President-elect Biden to develop a unified, national system for tracking COVID-19 in schools. I wanted to highlight it again this week because I absolutely agree with Oster here. As important as her and others’ compilation efforts have been in filling the school data gap, no outside dashboard can replace the work of the federal government:

    We need to be able to identify the virus spreading in schools and work out what went wrong. The data we do have suggest that outbreaks in schools are not common, but they do happen. We need a way to find them systematically.

    As far as I can tell, there is no mention of data-gathering in Biden’s K-12 COVID-19 plan.

    And here’s one more school-related metric we should be tracking: teachers are starting to get vaccinated. According to a recent Kaiser Family Foundation analysis of state vaccination priority groups, 31 states have put K-12 and childcare personnel in their Phase 1 group. In Utah, teachers and childcare workers are even included in Phase 1A. California and New York, two of the biggest states, started vaccinating teachers this past week.

    (If you want a heartwarming read this long weekend, I recommend this piece from THE CITY that profiles NYC teachers and other essential workers getting vaccinated in the middle of the night.)

    But most states are barely reporting basic demographic data for their vaccinations, much less telling the public the occupations of those who have gotten shots. Without knowing how many teachers have been vaccinated, it will be difficult to factor these inoculations into reopening decisions—or determine how vaccination impacts future school outbreaks.

  • Data on schools reopening lag the actual reopening of schools

    Data on schools reopening lag the actual reopening of schools

    Reported COVID-19 cases in K-12 schools, compiled by Alisha Morris and other volunteers. Screenshot via Jon W.’s Tableau dashboard.

    As I wrote in my coverage of the congressional subcommittee hearing on national COVID-19 response a few weeks ago, everyone wants to reopen the schools.

    Politicians on both sides of the aisle, along with public health leaders such as the CDC’s Dr. Robert Redfield and NIAID’s Dr. Anthony Fauci, agree that returning to in-person learning is crucial for public health. Many children rely on food and health resources provided by schools. Parents rely on childcare. Without in-person schools, it is difficult for teachers and other mandated reporters to identify cases of child abuse. And all school students, from kindergarteners to college kids, are facing the mental health deterioration that comes from limited social interaction with their peers.

    But in deciding whether and how to return to in-person learning, school districts around the country are facing the same challenge that states faced early in the pandemic: they’re on their own. Some districts may have guidance from local government; in New York, for example, schools are allowed to reopen if they are located in an area with a under 5% of COVID-19 tests returning positive results. Every county in the state meets this guideline, and the state as a whole has had a positivity rate under 1% for weeks.

    Still, low community transmission does not indicate that a state is necessarily safe for reopening. Teachers in New York City have protested the city’s plan for school reopening, citing poor ventilation, no plan for regular testing, and other health concerns. Teachers in Detroit, outside of Phoenix, and other districts across the country are considering strikes. Earlier this week, the White House formally declared that teachers are essential workers—meaning they could continue working after exposure to COVID-19—which Randi Weingarten, president of the American Federation of Teachers, called a move to “threaten, bully, and coerce” teachers back into their unsafe classrooms. Meanwhile, many colleges and universities are planning to bring students from out of state into the communities around their campuses.

    As conversations on school reopening heighten at both national and local levels, a data journalist like myself has to ask: what data do we have on the topic? Is it possible to track how school reopening is impacting COVID-19 outbreaks, or vice versa?

    The answer is, as with any national question about COVID-19, the data are spotty. It’s possible to track cases and deaths at the county level, but no source comprehensively tracks testing at a level more local than the state. It is impossible to compare percent positivity rates—that crucial metric many districts are using to determine whether they can safely reopen—both broadly and precisely across the country.

    The best a data journalist can do is represented in this New York Times analysis. The Times pulled together county-level data from local public health departments and evaluated whether schools in each county could safely open based on new cases per 100,000 people and test positivity rates. Test positivity rates are difficult to standardize across states, however, because different states report their tests in different units. And, if you look closely at this story’s interactive map, you’ll find that some states—such as Ohio, New Hampshire, and Utah—are not reporting testing data at the county level at all.

    Still, some research projects and volunteer efforts are cropping up to document COVID-19 in schools as best they can. I will outline the data sources I’ve found here, and I invite readers to send me any similar sources that I’ve missed so that I can feature them in future issues.

    How schools are reopening

    • COVID-19 Testing in US Colleges: Sina Booeshaghi and Lior Pachter, two researchers from CalTech, put together a database documenting testing plans at over 500 colleges and universities throughout the U.S. The database is open for updates; anyone who would like to suggest an edit or contribute testing information on a new school can contact the researchers, whose emails are listed in the spreadsheet. Booeshaghi and Pachter wrote a paper on their findings, which is available in preprint form on medRxiv (it has not yet been reviewed by other scientists).
    • The College Crisis Initiative: Davidson College’s College Crisis Initiative (or C2i) maps out fall 2020 plans for about 3,000 colleges and universities. Clicking on a college in the interactive map leads users to see a brief description of the school’s opening policy, along with a link to the school’s website. Corrections may be submitted via a Google form.
    • District Budget Decisions: Edunomics Lab at Georgetown University has compiled a database of choices school districts are making about how to change their budgets and hiring during the COVID-19 pandemic. The database includes 302 districts at the time I send this newsletter; district choices are categorized as budget trimming, salary reductions, benefits adjustment, furloughs, and layoffs.

    Reporting COVID-19 in schools and districts

    • COVID-19 in Iowa: Iowa’s state dashboard includes a page which specifically allows users to check the test positivity rates in the state’s school districts. Click a school district in the table on the left, and the table on the right will automatically filter to show how testing is progressing in the counties encompassed by this district. So far, Iowa is the only state to make such data available in an accessible manner; other states should follow its lead.
    • NYT COVID-19 cases in colleges: Journalists at the New York Times surveyed public and private four-year colleges in late July. The analysis found at least 6,600 cases tied to 270 colleges since March. This dataset is not being actively updated, but it is an informative indicator of the schools that faced outbreaks in the spring and summer.
    • Individual school dashboards: Any large college or university that chooses to reopen, even in a partial capacity, must inform its students of COVID-19’s progress on campus. Some schools are communicating through regular emails, while others have put together school-specific dashboards for students, professors, and staff. Two examples of school dashboards can be found at Boston University and West Virginia University; at other schools, such as Georgia Tech, students have spun up their own dashboards based on school reports.

    Reopening gone wrong

    • K-12 school closures, quarantines, and/or deaths: Weeks ago, Alisha Morris, a theater teacher in Kansas, started compiling news reports on instances of COVID-19 causing schools to stall or alter reopening plans. Morris’ project grew into a national spreadsheet with hundreds of COVID-19 school case reports spanning every U.S. state. She now manages the sheet with other volunteers, and the sheet’s “Home” tab advertises a new site coming soon. You can explore the dataset through a Tableau dashboard created by one volunteer.

    Datasets under development

    • FinMango and Florida COVID Action collaboration: FinMango, a global nonprofit which has pivoted to help COVID-19 researchers, has partnered with Florida COVID Action, a data project led by whistleblower Rebekah Jones, to track COVID-19 cases in K-12 schools. The project, called the COVID Monitor, has already been compiling reports from media and members of the public since July. It includes about 1,300 schools with confirmed or reported COVID-19 cases so far, 200 of which are in the project’s home state of Florida.
    • ProPublica school reopening survey: A new initiative from ProPublica asks students, parents, educators, and staff to report on their schools’ reopening plans. Readers who might prefer to share information with ProPublica through more private means can get in touch on Signal or visit the publication’s tips page.
    • Nature university reopening survey: Similarly to ProPublica, Nature News is surveying its readers on their reopening experience. This survey specifically calls on research scientists to share how they will be teaching and if they agree with the approach their university has taken on reopening. Respondents who wish for more privacy can use Signal or WhatsApp.