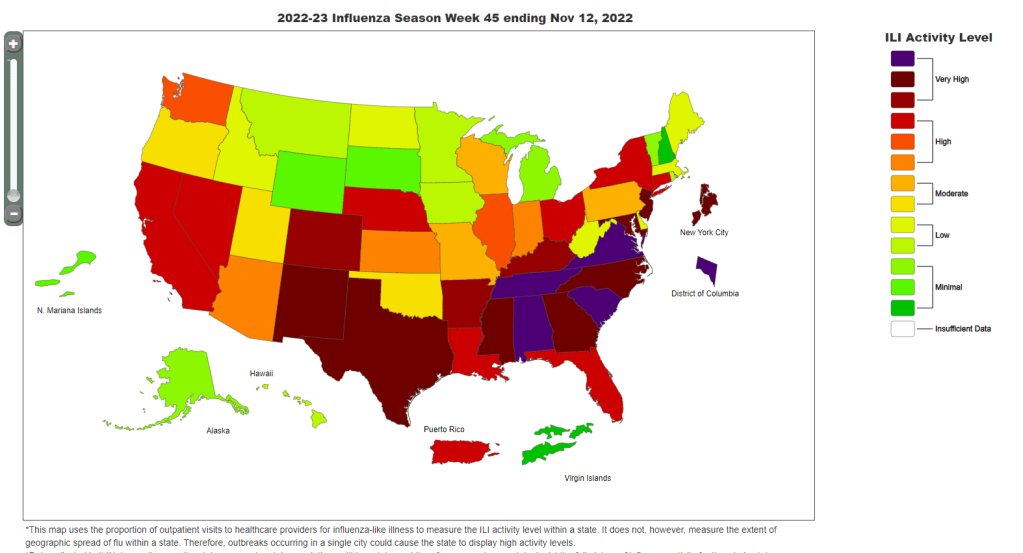
Data from the CDC indicate that much of the country is seeing high flu levels. Chart as of November 12.
In the past week (November 10 through 16), the U.S. reported about 280,000 new COVID-19 cases, according to the CDC. This amounts to:
An average of 40,000 new cases each day
86 total new cases for every 100,000 Americans
3% fewer new cases than last week (November 3-9)
In the past week, the U.S. also reported about 24,000 new COVID-19 patients admitted to hospitals. This amounts to:
An average of 3,400 new admissions each day
7.3 total admissions for every 100,000 Americans
1% fewer new admissions than last week
Additionally, the U.S. reported:
2,200 new COVID-19 deaths (320 per day)
50% of new cases are caused by Omicron BQ.1 and BQ.1.1; 8% by BF.7; 5% by BN.1; 2% by BA.2.75 and BA.2.75.2 (as of November 19)
An average of 400,000 vaccinations per day
Nationwide, reported COVID-19 cases and new hospital admissions are still in a plateau; both metrics declined very slightly this week after rising slightly last week (declining by 3% and 1%, respectively).
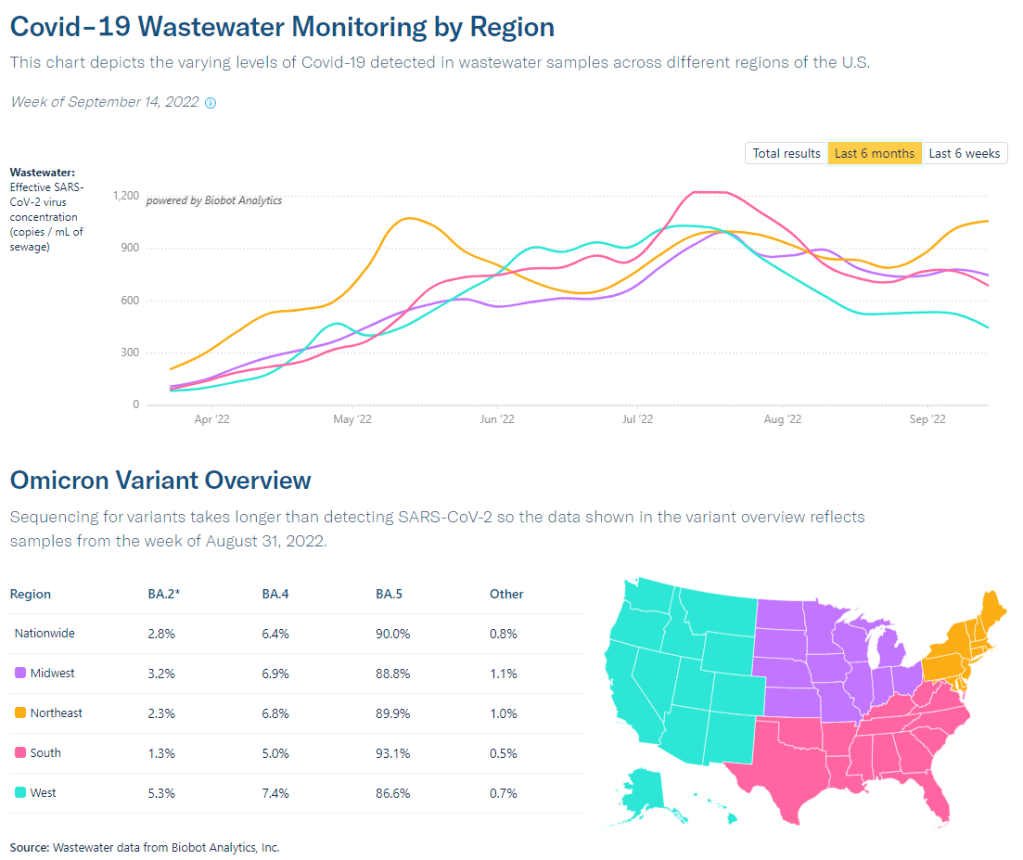
While we have yet to see as clear of a fall/winter surge as we did in the last two years, infection levels are still quite high. Evidence for this comes from wastewater data, which doesn’t rely on people getting PCR tests; trends from Biobot suggest that viral transmission is at a similar level to late October/early November of last year, when Delta was still the dominant variant.
Biobot’s data also indicate that the West coast region is now seeing a notable uptick in COVID-19 spread, taking over from the Northeast (which has been a regional hotspot since September). Wastewater testing sites in cities like Los Angeles is reporting significant transmission spikes in the last couple of weeks.
The West coast, like the Northeast, has been a hotspot for newer Omicron subvariants BQ.1 and BQ.1.1, according to CDC estimates. Nationwide, the BQ lineage caused about half of new cases in the last week—solidly outcompeting its parent lineage, BA.5. And there are several other Omicron subvariants spreading, including two lineages from BA.2, BF.7 and BN.1.
With all these new variants circulating and colder weather throughout the country, why haven’t we seen a significant jump in COVID-19 spread? It’s possible that the U.S. has enough prior immunity from vaccinations and past infections to prevent a big surge, White House COVID-19 coordinator Ashish Jha said at the STAT Summit last week.
I hope Jha is right, but I personally remain skeptical. Way too few people have received the new booster shots that protect against Omicron variants, while we’re heading into several weeks of holiday travel and gatherings—with fewer COVID-19 protections than in the last two years.
At the same time, the U.S. is dealing with flu and RSV surges. About a dozen states, plus New York City and Washington, D.C., reported “very high” levels of influenza-like activity in the week ending November 12, according to the CDC. And the country’s RSV wave continues at high intensity, though it might be reaching its peak.
These two respiratory diseases may be less severe than COVID-19 at an individual level (especially accounting for the burden of Long COVID), but they can still put intense pressure on healthcare systems—especially those focused on treating children. Wearing a mask, avoiding indoor crowds, improving ventilation, and other measures can protect against all three diseases.
In the program—which is a collaboration between the agency’s Travelers Health Branch, biotech company Ginkgo Bioworks, and airport wellness company XpresSpa Group—travelers at four major airports can volunteer to be swabbed right after they get off the plane. The travelers’ test results are pooled by country of origin, meaning that analysts at Ginkgo combine their samples and PCR-test them together.
In addition to test positivity, Ginkgo also sequences the samples to identify variants spreading around the world. The program has included about 60,000 people between November 2021 and September 2022, according to the CDC. It’s now expanding to add more airports, with the CDC and Ginkgo working together to select international flights that should be targeted for testing.
Earlier this week, I talked to bioinformatics experts Andy Rothstein and Casandra Philipson, who work on the CDC travel surveillance program at Concentric (Ginkgo’s COVID-19 testing initiative), to learn more about how the program works. Swati Sureka from Ginkgo’s communications team also took part in the interview.
Here are a few key insights I learned from the conversation:
Travelers who volunteer to be tested don’t actually receive individual results back from Ginkgo, due to the company’s pool testing method. But they receive free at-home tests that can provide individual results.
Despite a relatively small sample size, the surveillance program tends to match global coronavirus variant trends from GISAID (a global repository of variant sequences).
The CDC uses data from this program as a complementary surveillance system, in coordination with the agency’s domestic variant surveillance, wastewater testing, and other systems.
Along with expansions to more airports, the Concentric scientists are working on testing wastewater from airplanes as another way to pull COVID-19 data from international travelers.
The experts named BQ.1 and BQ.1.1 as the most concerning variants they’re following right now, though the program has also picked up XBB.
This interview has been lightly edited and condensed for clarity.
Betsy Ladyzhets: I wanted to start by asking about the backstory behind the traveler-based genomic surveillance program. I’ve read a bit about it, but I’m curious to hear from you guys about how it got started and choices that have been made as you’ve expanded the program.
Andy Rothstein: Gingko has long recognized that biosecurity is an integral component to the growing bio-economy, even before COVID. But when spring 2020 came around, Ginko as an organization rapidly responded with a large commitment to the sequencing effort across the country… That really showed that there was an opportunity to grow a biosecurity business unit within Gingko, which became Concentric.
We built a K through 12 testing program, where we implemented this novel approach of pooled testing. We could have kindergarteners basically swabbing their noses in the classroom, everyone could put it one tube, it simplified the process, and we were able to get those results out quickly. But we really recognized that this is just one interface that can be a part of the biosecurity infrastructure.
We saw that travelers were this really important sentinel for bringing in new things like variants or tracking lineages. And we could combine the pooled testing approach with our sequencing capability at Ginkgo. Then, we got in contact with XpresSpa [now XpresCheck], which was pivoting their business model as well, because no one was going in the airports for manicures and massages. We approached them, as well as the CDC branch that deals with travel histories, quarantining, and things like that. We came to them to launch a pilot program in September 2021 as a proof of concept to say like, “Is this an interface that could provide valuable insights for public health and the CDC?”
We didn’t really know whether or not the pilot would work out. But we were one of the first to detect Omicron coming into the country in November [2021]. The program has now expanded, as of August 2022, into a two year program. And we’ve consistently been able to show that there’s real value in early warning, early detection through this novel interface.
Casandra Philipson: Gingko is an organism engineering company, we know that we’re going to be living with engineered organisms in the future. I think, because of that our founders have always had this prerogative to be able to have an early warning system or anomaly detection system for threats, whether or not they’re natural or manmade. And we have a lot of really smart people who had previous experience, in, like, Department of Defense surveillance exercises in the past. So I think there was an interest in early warning signals.
It’s also hard to be able to do surveillance in other countries, at least at that early, pandemic phase. And so this was a really easy way to have access to things that were coming in from other countries, that we otherwise wouldn’t have had access to.
BL: Yeah, that makes a lot of sense. I’m curious, building off of that, how is the CDC using the data that comes out of this program? Is it mostly about new variants? Or are there other things they’re kind of doing with it?
AR: CDC has a lot of complimentary surveillance systems ongoing, especially for SARS-CoV-2, that they’ve built up, whether it be clinical or whether it be wastewater. This is a novel interface for them to be detecting new things coming into the country. And so we really help source and, I guess, consolidate what is coming into the country and whether or not it’s a bad thing, or part of the existing evolution of SARS-CoV-2.
We work in tandem with them weekly, to not only optimize this program, but also give insights into the data that’s coming out. The [travel surveillance page of the] COVID Data Tracker has been a good culmination of all of this work that we’ve been doing. We can broadcast that publicly and show, almost side-by-side, here’s what’s happening in United States; here’s what’s happening, potentially coming into the United States.
BL: I did want to ask more about that new page on the COVID tracker, because I’m curious what you would want the average viewer to take from those charts. What should folks be getting out of both the test positivity rate and the variants?
AR: The first part is this test positivity rate. What we’ve seen is that, as testing declines in countries around the world, whether that’d be the appetite for testing or the funding for testing, we have a new sentinel to see what, potentially, the positivity looks like around the world. There’s been a number of times that we, in our program, have matched positivity rates in a country of origin [for a group of travelers]. Then as testing stopped [in that country], we still are picking up a positivity rate. For the public that is looking at this chart, it’s an opportunity to see into the window: What’s the global picture of what’s coming into this country?
Positivity is the first lens of data. The next is that we actually sequence, and we are understanding what is the breakdown or the frequencies of different variants coming into the country. You can see how what’s happening on [the CDC’s U.S. variant surveillance page] is lining up with the frequencies in our program. And because we’re finding new things, we end up sort-of being ahead of the curve in terms of what those frequencies might end up being in the United States.
BL: So you’re talking about comparing the CDC’s variant proportions estimates versus the travel estimates.
AR: Yeah, exactly. And the wastewater estimates… Not everybody is necessarily going and seeking testing when they’re sick with COVID, they might be doing an at-home test. So we’re using all of those [data systems] in a complementary sense to find, like, what’s a holistic picture of the SARS-CoV-2 coming in and outside of the United States?
BL: I also wanted to ask about, so like, if I’m a traveler coming into the U.S. at one of these airports where you have this program, how is it advertised? And what do people learn about it when they decide to volunteer to get tested?
AR: We have these pop-up testing booths, in collaboration with XpresCheck. They’re our on-the-ground infrastructure to basically be recruiting folks coming off of international flights. All the international flights go into one bottleneck where you’re going to leave the terminal, and you have an opportunity to see this booth that has some information about like, testing for public health, with the CDC logo—basically recruiting folks to come in. Folks that volunteer, they swab their noses and then we are pooling [tests] by those countries. We also have been giving them free, individual tests to take home.
We’re not collecting or giving back individual testing data to [the volunteers]. But we are showing that this is a part of the public health program. What we’ve found, through survey results, is that participation has really been increased by the fact that people feel like they’re being a part of this public health program and they want to help. We have great recruiters on the ground.
BL: So people don’t get their individual results, but you said they get an at-home test that they can use?
AR: Yeah. And then they can get their individual results [from that test]… They don’t get the pooled result.
BL: Are the data that you’re getting from this program linked to any other data? Because I know one big concern with variants is like, is a new variant going to be more severe? Is it going to be more likely for people to be hospitalized? So is there any capacity to link the tests that you’re doing with, say, hospitalization records?
AR: I think it’s a great idea, a great direction. Right now, we haven’t been linking those clinical data… We can try to look at the data within our program, and then contextualize it [using other sources] on what might be happening, in the United States or in origin countries.
But we’ve also been really excited about expanding our passive detection through wastewater. We’ve done an R&D project where we were looking at wastewater testing off of aircraft. So, that’s another complimentary data set off of the aircraft itself to help get a more holistic picture—not everyone is going to be using the bathroom [on the plane], but not everyone is going to be volunteering in this program.
BL: Testing the wastewater off the airplane seems like a great idea, I would not have thought of that.
AR: Yeah, we’re really excited about the opportunity to do something along those lines, since folks aren’t always going to volunteer to swab their nose.
We’re pooled testing by country, so we know that folks are coming from specific places. We can also—they can volunteer to give us any past travel history, so that we can try to link those data on our own. But there’s no systematic way to link [our results] to clinical data.
CP: Our sweet spot is microbes and viruses. So we actually don’t collect individual data that would allow us to associate an individual with their health record at all. I just wanted to emphasize that.
BL: That makes sense. I know that [linking datasets] is something that is very challenging to do, even with established health systems. I was just curious.
Swati Sureka: I can add one thing, just in terms of the knock-on benefits of the program. Say we do get early warning of an emerging variant that could potentially be of concern, that we don’t know on the global stage yet. We work directly with the CDC on getting them access to those [test] samples so that they can do direct viral characterization. Because, with emerging variants, it’s hard to get your hands on samples of it to be able to conduct research on how the virus behaves. I think that’s one of the side benefits, being able to actually pull those samples and share them directly with the CDC.
BL: Are there any variants that you’re all particularly watching right now? Like, I know, there’s been a lot of news about XBB, that’s spreading in East Asia. From your perspective, what are you seeing as concerning hotspots at the moment?
AR: Yeah. This is a big part of what our team does: as this data comes in, understanding what might be the trends happening globally. We have repeatedly shown that we can do early warning, [our data are] some of the first to identify a variant of concern. We can look and say, like, there’s certain mutations that we know, either from past variants or in predictive space, that [indicate this new variant is] going to be a problem for immune escape.
Variants that I think we’ve been really keeping an eye on and telling our CDC partners about are BQ.1 and BQ.1.1, which have been split out by CDC in the last couple of weeks. Our program was one of the first to identify and actually designate this BQ.1 variant. So we saw, early on, that it had characteristics because of its mutational profile [allowing it to] take hold. We continue to watch that.
The United States has been, pretty much, a few weeks to a month behind trends that we see in Western Europe. So I think it’s been pretty clear that BQ.1 is going to be something to watch for, as it sort of expands in its frequency… We also see XBB in our program, we’ve seen it as well. I think it’s going to be an interesting new chapter of SARS-CoV-2 evolution where we have potentially co-circulating variants of concern that have different dynamics in different parts of the world.
BL: Yeah, it’s very interesting… One other thing I wanted to ask you about is sample size. It seems like, from the data on the CDC dashboard, that you’re working with a small number of airports and a limited sample, compared to the number of international travelers coming into the U.S. So how do you think about analyzing that, and potentially expanding the sample?
AR: Definitely part of our plan is to ramp up the number of samples that we can get, as well as the number of airports that we might be operating out of.
But I think it’s just remarkable to talk about this program, when you see such a small sample size, and we’re still able to find new things and match GISAID, or global variant frequencies. It highlights, even with a small sample size, that the way that we’ve designed the program and the way our CDC counterparts think about where we’re going to be, what flights are we going to be choosing—that has been really, really successful so far. You always want more samples in science, but I think we’re working with what we have, and we’re excited to be expanding.
BL: That makes sense. So you’re able to say, “We want to send people to these flights, because this country has concerting variants right now,” that kind of thing?
AR: Yeah. Our CDC counterparts are tapped into both the CDC-wide conversations about variants and the global, WHO conversations about variants. So they’ll give us indications when there might be something to think about. And, again, this program is super nimble in its ability to pivot. When we think we want to focus on certain regions of the world, [we can recruit from specific flights].
It’s nice to be working in airports that have these direct flights and these long-haul flights. But thinking about how we prioritize is definitely—the CDC folks are thinking about this, and we sort-of help support them.
BL: The last main thing I wanted to ask about is, obviously in the U.S. and globally, we’re seeing so much less PCR testing now than we had at earlier points in the pandemic. How are you and—to any extent that you can talk about it—how are partners at the CDC thinking about making sure that we’re collecting a lot of samples from diverse settings, and looking in different places, looking at wastewater, and just continuing to keep track of what variants are circulating?
AR: I think back to, finding novel places to sample things. Like, the fact that we’ve invested and tried to build capability to do aircraft wastewater testing is just adding a complementary [data layer]. We’re going to have this layered interface or layered system where we might have some PCR tests, we might have wastewater, we might have sequencing, we might not have sequencing.
We’re figuring out, how do we just keep adding and keep building on this biosecurity infrastructure. I mean, the worst thing that could happen from this is we build all this and then no one uses it again, until something pops up. We’re really invested in finding new and novel ways to sample and to detect, and eventually sequence if we can get more robust data, like on variants.
BL: That makes sense. I wonder to what extent it can one day be useful for other viruses, too. I know we’re in a bad flu moment right now, or at least the beginnings of maybe a more intense flu season this year. And I know experts always talk about, like, “Can we read the tea leaves from the Southern hemisphere?” So that makes me think, “Okay, could we actually sample people who are coming in? And see if they have the flu, and not just COVID?” Or other things of that nature?
CP: This is something that keeps me up at night. Without being too forward-looking, absolutely, I would say, there are some commercial products out there right now—like from Illumina, which is a massive sequencing behemoth, they’ve just released some new sequencers on their end. They have this panel of, like, 66 viruses that you can detect in one panel. I think we’re gonna see more of that from many different types of partners who are looking at surveillance.
Moving beyond SARS-CoV-2, could samples be used for that? We’ve seen lots of publications that definitely prove that’s true. I think it’s right on cue, hopefully, with where we’re all headed.
BL: Yeah, I hope so. Well, those were all my main questions. Is there anything else you all think would be important for me to know about the program?
Swati Sureka: Stepping back, seeing how this [program] has played out over the past year, I’ve just been floored by, like, tens of thousands of people who have mobilized and participated and given samples in service of public health. For me, as a person who works in the communications space, I think we often hear a lot of these narratives of like, “People aren’t gonna do anything” or take any measures that they’re not forced to do.
People are inherently self-interested in all of these narratives that we hear. And it’s been really impressive to watch the participation that we’ve seen from travelers who want to help public health and want to help stop the spread, want to help pick up new variants. I don’t want to lose that thread of things.
BL: Totally. I can just envision, if you’re coming off a long flight, you just want to get through customs and get home. Taking a few extra minutes to get swabbed is not nothing.
AR: Yeah. And you could be doing that and say, “Oh, it doesn’t matter.” But we’re consistently seeing how helpful this data is, to inform all these complementary systems for building a biosecurity infrastructure. It’s really important data as we move forward.
BL: Yeah. When folks sign up, do you give them a link to the dashboard?
AR: Now we do. Now we can, right, it’s now live. It’s been really nice to have that public-facing thing, so that folks know where their efforts are going towards.
Genomic surveillance from international travelers: A new CDC dashboard page provides data from the agency’s program sequencing COVID-19 test samples from people arriving in the U.S. on international flights, aiming to identify and track new variants. This program—a partnership between the agency, Ginkgo Bioworks, and XpresSpa Group—started during the Delta wave in 2021 with flights from India, but has since expanded to include over 1,000 volunteers a week at four major airports. The CDC’s new page reports test positivity for travelers’ samples and variants detected through sequencing.
Implications of commercializing COVID-19 vaccines, treatments, tests: Researchers at the Kaiser Family Foundation analyzed how the federal government’s decreasing support for key COVID-19 products (vaccines, treatments, and tests) could impact Americans’ access. The government’s supply of these products has been depleted through 2022, and researchers anticipate the national Public Health Emergency will end in early 2023. As a result, Americans will soon likely need to rely on commercial products, leading to major challenges for low-income and uninsured people. (I wrote more about data implications of the PHE ending here.)
Disparities in flu hospitalizations and vaccinations: Much COVID-19 coverage, including in this publication, has focused on inequitable vaccine uptake. In early 2021, more white Americans were getting vaccinated than minority groups, potentially contributing to higher rates of severe disease in those groups through the second year of the pandemic. A new CDC study in the agency’s Morbidity and Mortality Weekly Report (MMWR) finds that a similar trend has occurred for flu over the last ten years: Black, Hispanic, and Native Americans had lower flu vaccine coverage than white Americans from 2009-10 through 2021-22 seasons, and the same groups had higher flu hospitalization rates. The study suggests equitable vaccination is a problem that goes beyond the pandemic.
Vaccine coverage among healthcare workers: Another CDC MMWR study that caught my attention this week provides results from a survey of healthcare workers, conducted in spring 2022. Among about 3,700 workers who responded to the survey, about four in five reported receiving a flu shot and two in three reported receiving a COVID-19 booster (during the 2021-22 flu season). Workers with vaccine mandates at their jobs had higher coverage than these averages, while long-term care workers had lower coverage. The results indicate more effort is needed to protect healthcare workers and their patients.
HospitalFinances.org is revamped, newly available: In 2018, the Association of Health Care Journalists (AHCJ) first launched HospitalFinances.org, a database of financial information on nonprofit hospitals pulling from 990 tax forms. The site has been offline for the past year due to a hosting issue, but is now back thanks to researchers at the University of Missouri (which hosts AHCJ). While this resource isn’t specifically COVID-related, it could be useful to reporters investigating hospitals in their areas.
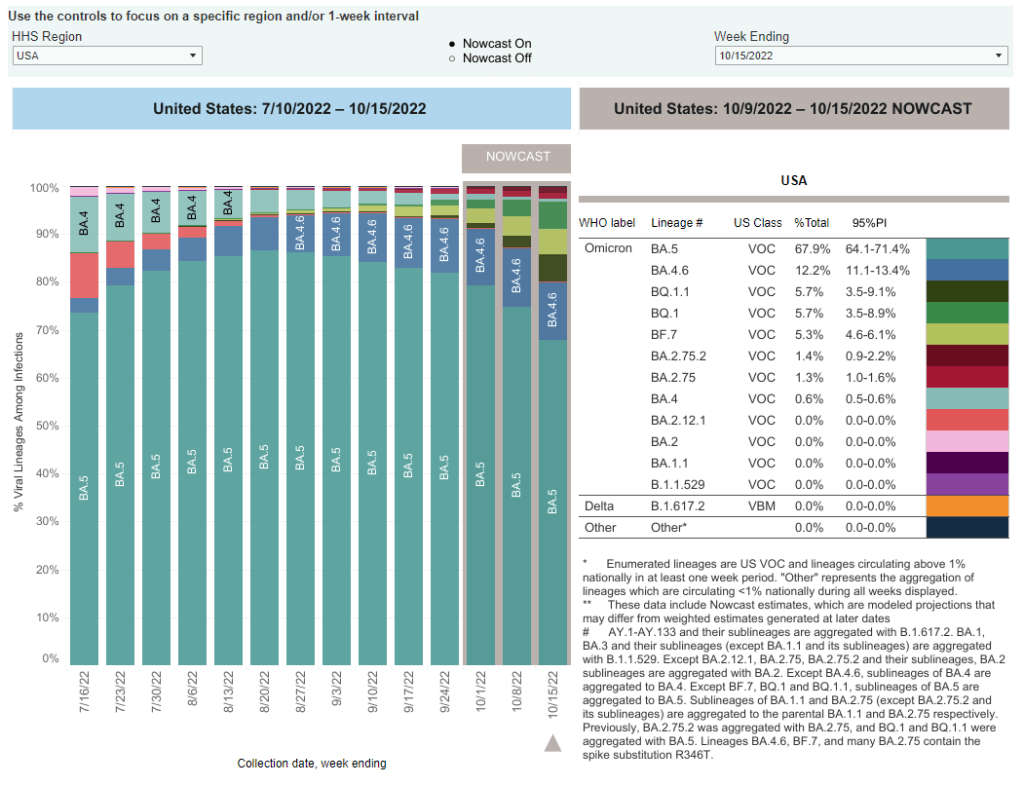
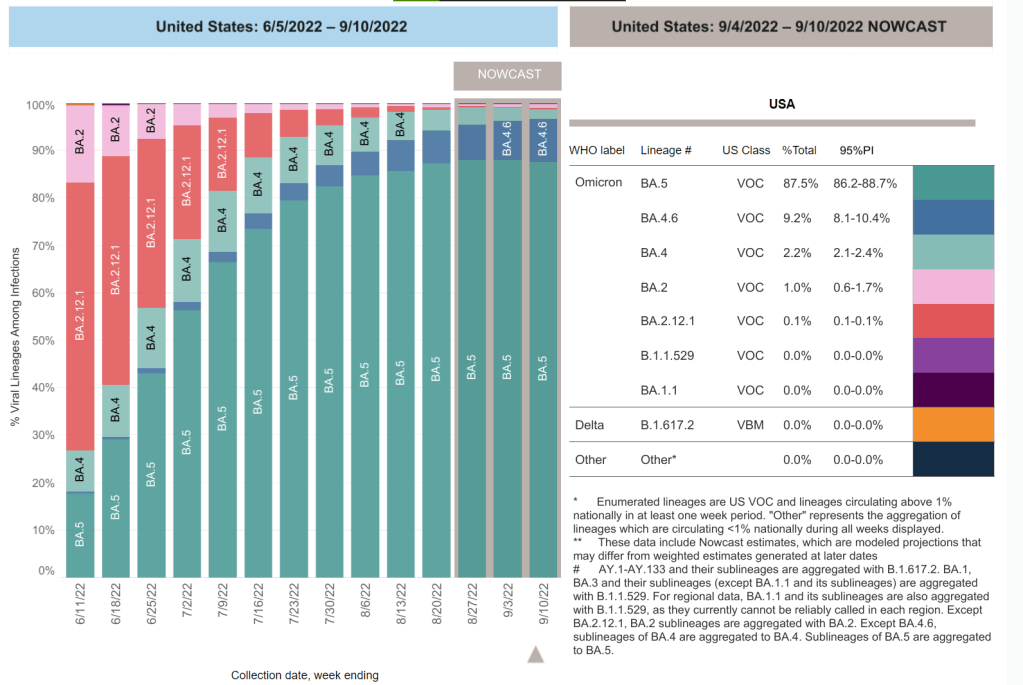
When the CDC updated its variant prevalence estimates this week, the agency added new versions of Omicron to the dashboard. In the U.S., COVID-19 cases are now driven by: BA.5, BA.4.6, BQ.1, BQ.1.1, BF.7, BA.2.75, and BA.2.75.2. And possibly more subvariants that we aren’t tracking yet.
As evolutionary biology expert T. Ryan Gregory pointed out on Twitter recently, Omicron’s evolution is “off the chart.”
Well, Omicron variant evolution is officially off the chart in terms of number of mutations. pic.twitter.com/8bVXX1n2jN
Or, to parody Smash Mouth: the Omicron variants start coming and they don’t stop coming and they don’t stop coming and they don’t stop coming…
Let’s go over the veritable alphabet soup of variants we’re dealing with right now, as well as one newer variant identified in east Asia that experts are closely watching.
BA.5, BA.4, BA.4.6
BA.5 is currently the dominant Omicron lineage in the U.S., causing about two-thirds of new COVID-19 cases in the week ending October 15. Along with BA.4, BA.5 split off from the original Omicron lineage and was first identified by South African scientists over the summer.
As these two subvariants spread around the world, it quickly became clear that they could spread faster than other versions of Omicron and reinfect people who’d previously gotten sick with those prior lineages. For more details, see this post from June. BA.5 later pulled out from BA.4 as the most competitive lineage.
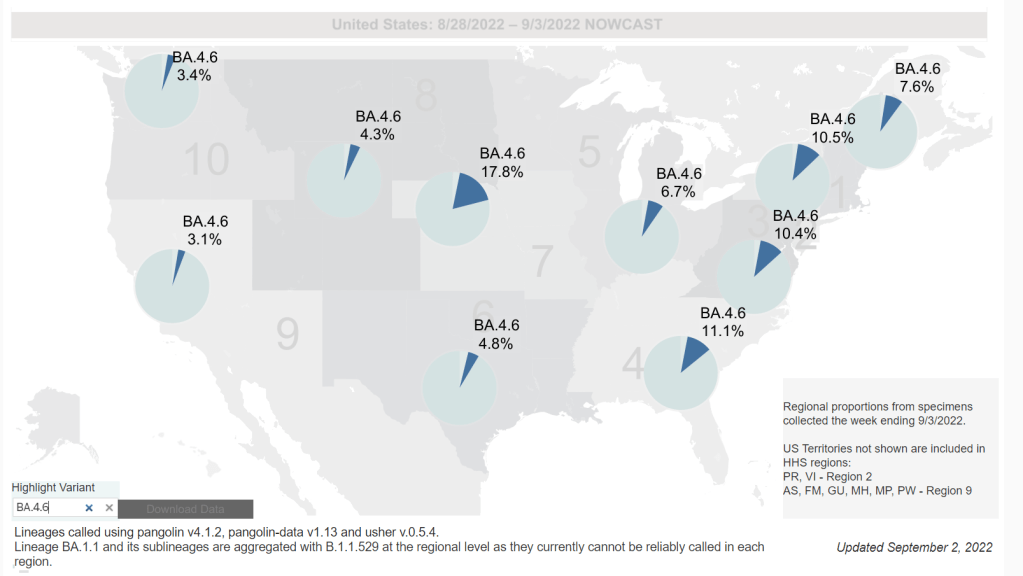
BA.4.6 evolved out of BA.4. It appears to have a small advantage over BA.5, but can’t really compete with the newer subvariants we’re seeing now; according to the CDC’s estimates, it’s been causing around 10% to 12% of new cases nationwide for the last few weeks (without much growth).
BQ.1 and BQ.1.1
BQ.1 and its descendant BQ.1.1 are the two newest subvariants to show up in the CDC’s prevalence estimates, both causing about 5.7% of new cases nationwide in the last week. They actually evolved out of BA.5: BQ.1 is shorthand for a much longer, more unwieldy variant name that nobody wants to type out on Twitter.
In the U.S., BQ.1 and BQ.1.1 are starting to outcompete their parent lineage, BA.5. They’ve grown from causing less than 1% of new cases to over 10% of new cases in the last month. These subvariants are also now outcompeting other strains in the U.K. and other European countries.
As CBS News’s Alexander Tin explains, health experts are concerned that COVID-19 treatments like monoclonal antibodies might work less well against BQ.1 and BQ.1.1. We don’t have clear data on this yet, but pharmaceutical companies will test out the newer variants in the weeks to come. The Omicron bivalent boosters, at least, are expected to continue working against this lineage.
BF.7
BF.7 is another offshoot of BA.5 (again, this is shorthand for a longer name). I dedicated a post to it in late September, and the subvariant’s position hasn’t changed significantly since then: it seems to be a bit more transmissible than BA.5, but not so much that it is quickly outcompeting the parent lineage. BF.7 caused about 5% of new cases nationwide in the last week.
Similarly to BQ.1 and BQ.1.1, there are some concerns that COVID-19 treatments will be less effective against BF.7 than other versions of Omicron based on the subvariant’s spike protein mutations, but we do not have clinical data at this point.
BA.2.75 and BA.2.75.2
BA.2.75, as you might guess from the notation, evolved out of BA.2—the same original Omicron lineage that produced BA.2.12.1 and drove surges in places like New York City over the summer. It has also remained present at fairly low levels across the U.S. recently, causing just 1.3% of new cases in the last week, according to the CDC’s estimates.
But BA.2.75 now has its own offshoot, called BA.2.75.2, that appears to be a bit more competitive. The CDC recently started splitting BA.2.75.2 out of its parent lineage in its prevalence estimates, showing that it’s growing a bit faster (from 0.4% to 1.4% in the last month). Of course, this growth rate pales in comparison to what we’re seeing from the BA.5 sublineages described above.
XBB
XBB is the latest international subvariant of concern, identified this week in several east Asian countries. It has spread particularly quickly in Singapore, as described in this article by David Axe at the Daily Beast.
Like BA.2.75, XBB descended from Omicron BA.2—though it’s gone through more rounds of spike protein mutation; this is why experts are calling it XBB, rather than a long string attached to BA.2. Data so far indicate its growth advantage over BA.5 is similar to what we’re seeing from BQ.1.1. XBB has also raised concerns about treatment and vaccine efficacy, since the bivalent boosters were developed from BA.4 and BA.5.
The CDC and other health agencies have yet to identify XBB in the U.S.; experts are closely watching how this new subvariant might be able to compete with our current variations on BA.5.
BQ.1* and XBB have different geographic foci BQ.1* is mostly in Africa, Europe and North America XBB in South (East) Asia 3 countries with similar levels worth watching for comparison and potential co-circulation are: – Japan – Australia – South Koreahttps://t.co/YHzvfLgGOh 1/ pic.twitter.com/BiHKquBGxV
Overall, both in the U.S. and around the world, we’re seeing a lot of competition between these subvariants. All of them have small growth advantages over BA.5—which is currently dominant in the U.S.—but none are so different that they’re completely pulling ahead.
As I wrote last weekend, many experts are anticipating a surge this fall and winter, driven by both new subvariants and less-cautious beavior. We likely won’t see a huge spike at the level of last winter’s massive Omicron surge, but this season will still have plenty of infections (and reinfections).
We will need more data on how all these newer variants respond to vaccines and treatments, especially the antiviral Paxlovid. But it’s at least promising that many of the circulating variants right now evolved from BA.5, against which our bivalent boosters were specifically designed. It’s a great time to get that booster!
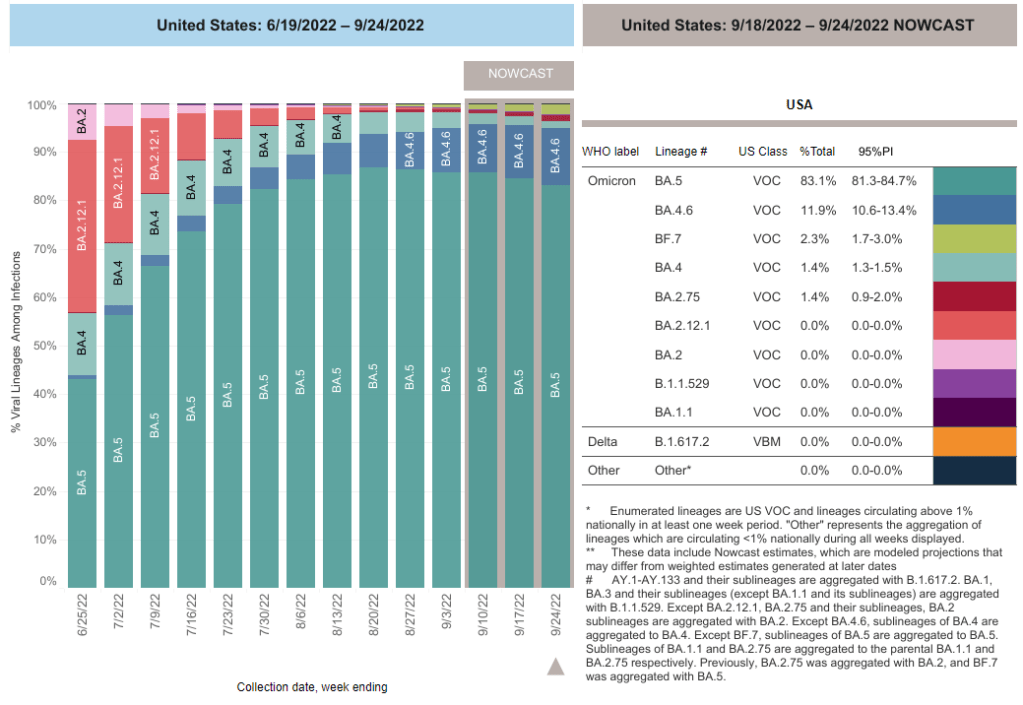
BF.7 (shown here in light green) is among the Omicron subvariants starting to push out BA.5. Chart via the CDC.
Omicron BF.7, an offshoot of BA.5, is the latest subvariant to raise red flags among experts tracking COVID-19 in the U.S.
This week, BF.7 passed BA.2.75, another worrying lineage, in the CDC’s prevalence estimates: the CDC found that it caused about 2.3% of new cases nationwide in the week ending September 24. It’s most prevalent in the Northeast right now: in New England, it caused almost 4% of new cases last week, the CDC estimates.
BF.7 has an additional spike protein mutation compared to BA.5, CDC spokesperson Jasmine Reed told CBS News last week. The agency is concerned that this “genetic change” could lead to Evusheld, an antibody drug used by immunocompromised people, becoming less effective. It could also contribute to a new wave of reinfections, as we’ve seen with other Omicron subvariants in the last few months.
“The same growth advantage in multiple countries makes it reasonable to think that BF.7 is gaining a foothold,” and that it’s potentially more transmissible than parent BA.5, Ray said. Children of variants “don’t grow relative to their parent unless they have an advantage.”
We have relatively little data on BF.7 so far, but it’s worth monitoring closely in the coming weeks.
Wastewater trends in the past couple of weeks are looking a bit messy, with a potential new surge in the Northeast and plateaus in other regions. Chart via Biobot, retrieved on September 18.
In the past week (September 10 through 16), the U.S. reported about 420,000 new COVID-19 cases, according to the CDC. This amounts to:
An average of 60,000 new cases each day
128 total new cases for every 100,000 Americans
16% fewer new cases than last week (September 3-9)
In the past week, the U.S. also reported about 31,000 new COVID-19 patients admitted to hospitals. This amounts to:
An average of 4,400 new admissions each day
9.3 total admissions for every 100,000 Americans
6% fewer new admissions than last week
Additionally, the U.S. reported:
2,500 new COVID-19 deaths (0.8 for every 100,000 people)
85% of new cases are caused by Omicron BA.5; 10% by BA.4.6; 1% by BA.2.75 (as of September 17)
An average of 25,000 vaccinations per day (per Bloomberg)
Officially-reported COVID-19 cases are still on the decline nationwide this week, as are newly hospitalized patients (a more reliable metric). About 4,400 people with COVID-19 were admitted to hospitals across the country, compared to over 6,000 a day in late July.
These declines may be short-lived, as reopened schools and increased indoor gatherings contribute to new outbreaks this fall. Last week, I warned that Biobot’s wastewater data showed a slight uptick in coronavirus levels across the country; this week’s update shows a continued increase in the Northeast while other regions are in plateaus.
Will the Northeast be the first region to experience a new surge again? It seems feasible, based on data from both Biobot and the CDC—though this region also has better wastewater surveillance coverage than other parts of the country, ABC News reporter Arielle Mitropoulos points out. Boston, one long-running wastewater surveillance location, is reporting high coronavirus concentrations at a level not observed since earlier in the summer.
Nationwide, BA.5 continues to be the dominant variant, causing about 85% of new cases in the week ending September 17 per CDC estimates. But it’s facing competition from newer Omicron subvariants, including BA.4.6 (10% of new cases this week), BA.2.75 (1.3% of cases), and BF.7 (1.7% of cases). As of this week, the CDC is now reporting BA.2.75 and BF.7 separately rather than combining them with other lineages.
BA.2.75, also called Centaurus, is a subvariant from BA.2 that evolved some additional mutations. BF.7 actually evolved from BA.5; its longer name is BA.5.2.1.X. There hasn’t been much reporting yet on BF.7, but it appears to be present in the Northeast—particularly in New England—at higher levels than in other regions. (Possibly another driver of a new surge in this area.)
In addition to BA.4.6, which has now inched past 10%@CDCgov now tracking BF.7 (1.7%) and BA.2.75 (1.3%) variants in its "Nowcast"this week
Overall, while COVID-19 spread in the U.S. is occurring less right now than it did earlier in the summer, the risk of encountering this virus is still pretty high across the country. According to the CDC’s “Community Transmission Level” guidance (pre-February), more than 90% of U.S. counties should require masks indoors.
Instead, we have no masking requirements, increasingly-limited testing, and a booster shot campaign that many Americans do not even know is happening. Between 300 and 400 Americans still die of COVID-19 every day—a number that should be unacceptable—and I fear this number will only go up as we head into winter.
BUMPING THIS because last night I heard from a friend who literally didn't know the new boosters are available to everyone! https://t.co/6tHiaX85UN
BA.2.75, a newer subvariant that evolved from BA.2, has been driving increased coronavirus transmission in some other countries recently. You might also see it referred to as “Centaurus” on social media. This lineage has yet to be identified in large numbers in the U.S., but I was inspired by a recent reader question to share what we’ve learned about it since my previous post in July.
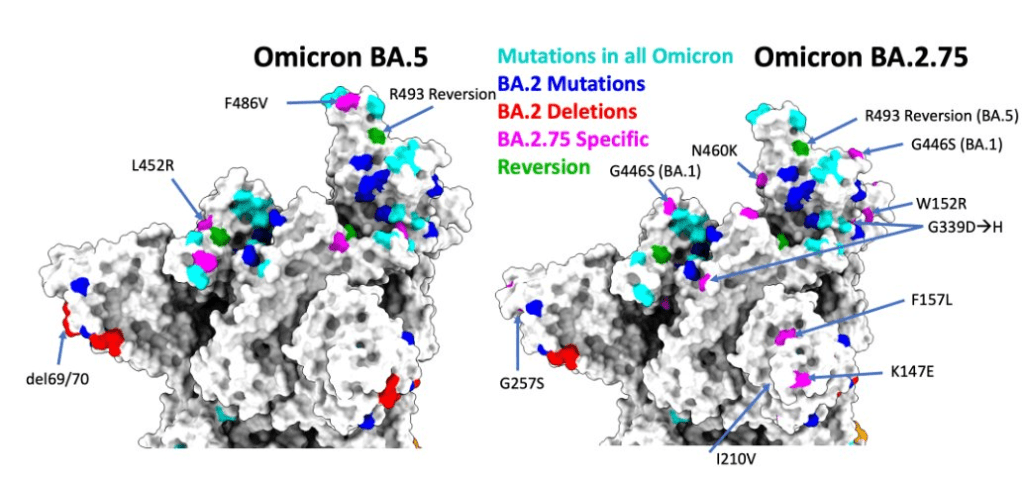
Scientists are concerned about BA.2.75 because it has several new mutations that are distinct from BA.2, most of those in the spike protein (where the virus binds to human cells). And some preliminary research, including recent studies in the Lancet Infectious Diseases and in the New England Journal of Medicine, have found that BA.2.75 is less susceptible to neutralizing antibodies from prior infections or treatments than past variants.
This could mean people who previously caught BA.2 or other versions of Omicron could be susceptible to BA.2.75, reports Hannah Flynn in Medical News Today. Of course, more research and data are needed on the new variant. But BA.2.75 has been driving new surges in India, Nepal, and other countries—another signal that it’s worth watching.
As I noted in today’s National Numbers post, the CDC is not yet reporting BA.2.75 prevalence estimates separately from other versions of BA.2. But it has reported an increase in BA.2 overall in recent weeks, from 0.6% of new cases in the week ending August 27 to 1% in the week ending September 10. This is probably BA.2.75, given that older versions of BA.2 haven’t been competitive in the U.S. for a few months.
Helix, a COVID-19 testing company that works with the CDC and other agencies on variant surveillance, is tracking BA.2.75 separately from BA.2 on its dashboard. According to Helix’s data, original BA.2 has stayed at very low prevalence in recent weeks while BA.2.75 has risen to 1% of cases sequenced.
It’s currently unclear—as it was in July—to what extent BA.2.75 might be able to compete with BA.5 or BA.4.6, which are the main subvariants of concern spreading across the U.S. right now. But if BA.2.75 does become dominant, it will be helpful that the newly-authorized booster shots include genetic material from the original, Wuhan variant, not just BA.4 and BA.5.
Omicron BA.4.6, a newer version of BA.4, is currently more prevalent in the Midwest than other regions of the country. Chart via the CDC, retrieved September 4.
Slow rise of BA.4.6 is worth watching: As I mentioned in today’s National Numbers post, a newer subvariant labeled BA.4.6 is gaining ground over other versions of Omicron in the U.S. BA.4.6 evolved from BA.4, and has an additional mutation in the virus’ spike protein that enables it to bypass protection from prior infections. It’s unclear whether BA.4.6 will be able to fully outcompete BA.5, which is currently causing the vast majority of U.S. COVID-19 cases—these two strains are similar enough that the competition may go slowly. So far, the subvariant has been more prevalent in the Midwest than other regions of the country, according to CDC data. Also worth watching: BA.2.75, a subvariant that is dominating some European countries but hasn’t shown up significantly in the U.S. yet.
Up to 4 million people may be out of work due to Long COVID: Last week, policy research organization the Brookings Institute published a new report discussing the massive impacts Long COVID is having on America’s labor force. The report utilizes recent data from the Household Pulse Survey (released in June) estimating Long COVID prevalence, in conjunction with research on how many long-haulers might be out of work due to their condition. The results: between two and four million Americans potentially lost their jobs (or are working significantly less) due to Long COVID, costing at least $170 billion a year in lost wages. Even the low ends of these estimates are staggering.
U.S. life expectancy declined again in 2021: Americans born in 2021 may expect to live for 76 years on average, according to the CDC’s National Vital Statistics System. This is the lowest life expectancy has been since 1996. CDC researchers attribute the sharp decline in the last two years to the pandemic and drug overdose deaths. Disparities in life expectancy have also increased: Native Americans born in 2021 may expect to live only 65 years on average and Black Americans may expect to live 71 years, compared to 76 years for white Americans.
Biobot expands wastewater surveillance for opioid tracking: In the last couple of months, we’ve seen wastewater used to track monkeypox and polio, in addition to COVID-19—suggesting the technology’s capacity for broader public health surveillance. This week, leading wastewater company Biobot announced a new initiative to track opioid use and other high-risk substance use through a similar platform to its current COVID-19 efforts. Tracking the opioid crisis was actually the original focus for Biobot’s founders pre-pandemic, so it’s notable to see the company expanding in this direction now.
As official COVID-19 case data become less and less reliable, wastewater surveillance can help provide a picture of where and how much the virus is spreading. This week, I put together a new COVID-19 Data Dispatch resource page that outlines major national, state, and local wastewater dashboards across the U.S.
Of course, wastewater surveillance is not capable of completely replacing clinical data. Wastewater testing is still pretty spotty across the country (though almost all states are now represented on the CDC’s dashboard), while scientists and public health officials are still working to determine how best to interpret and use these data; see my April FiveThirtyEight article for more on these challenges. There are also equity concerns around which communities have access to wastewater surveillance, as discussed in this recent paper from Colleen Naughton et al.
Still, if you live in a place where wastewater data are publicly available, I highly recommend keeping an eye on these numbers. Trends in wastewater data tend to closely match—or preempt—trends in case data, and wastewater testing includes everyone in a sewershed regardless of their access to (or interest in) getting a PCR test. This is one of the best COVID-19 indicators we have right now.
In the U.S., there are currently two main national wastewater dashboards:
CDC’s National Wastewater Surveillance System (NWSS) dashboard: This dashboard presents data from about 800 sewershed sites across the country, including both those managed by state and local health departments and those tested through the CDC’s contract with Biobot. Different data providers have different testing and analysis methods, which can make it difficult to interpret the information here on a national scale. But, if your state or county is represented on the dashboard, you can click into an individual site to see coronavirus trends. Historical data are available for download here.
Biobot Network dashboard: In addition to the company’s contract with the CDC, Biobot also tests wastewater at hundreds of sites across the country though its free Biobot Network, as well as through paid contracts with individual health departments and wastewater treatment plants. Biobot presents data from these non-CDC sites on its dashboard, updated weekly. One advantage of the Biobot dashboard over the CDC’s is that all Biobot sites are tested and analyzed with a uniform methodology, making the data easier to interpret. Data are available for download here.
My resource page also links out to COVIDPoops19, a dashboard summarizing wastewater monitoring efforts around the world. Run by researchers at the University of California Merced, this project links out to almost 150 public and academic wastewater sites. If you’re looking for wastewater surveillance in your area, this dashboard may be a good place to check.
At the smaller level, my page includes 17 statewide wastewater dashboards, seven at the local level (dedicated to a specific city or metropolitan area), and four at the regional level (representing multiple counties in a state).
While many more states are doing wastewater surveillance, the majority of state health departments have not yet developed their own dashboards—redirecting residents to the CDC NWSS site. Personally, I think some state-specific dashboards are much easier to navigate and interpret than the CDC’s, and would like to see more states produce their own. But I understand the resource limitations here.
Here are a few state and local dashboards I’d like to highlight:
Boston, Massachusetts: The Massachusetts Water Resources Authority’s dashboard is one of the oldest in the U.S., launched in spring 2020 through a partnership with Biobot. It’s fairly simple (presenting static images, not interactive dashboards), and easy to interpret, with charts showing long-term and short-term trends.
Colorado: Colorado’s dashboard follows a common format for presenting wastewater surveillance data: users are presented with a map of wastewater service areas, and can click into a specific area to see coronavirus trends for that sewershed. This state is also planning to expand wastewater testing to schools and other specific buildings, according to local reporting.
Maine: Maine’s wastewater “dashboard” is really a collection of PDF reports, posted for individual counties at regular intervals. The PDFs come directly from Biobot, which is running the state’s surveillance through a contract with the Maine CDC; I find it interesting to see the report format Biobot is using for its clients.
New York State: Researchers at Syracuse University, the State University of New York (SUNY), state departments of health and environmental conservation, and others collaborate on this wastewater surveillance project, which includes 54 counties and 90 treatment plants. Notably, the project does not include the five boroughs of New York City; the city has its own wastewater surveillance effort, but does not have its own dashboard. (NYC sites haven’t been updated on the CDC dashboard since April.)
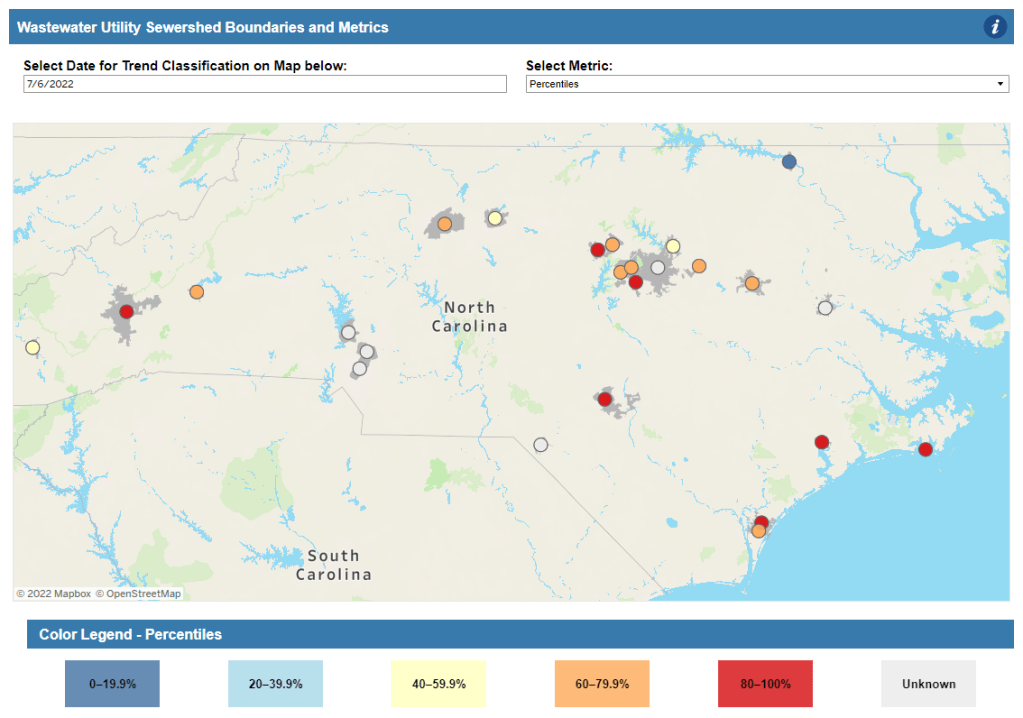
North Carolina: Similarly to Colorado’s, North Carolina’s wastewater dashboard allows users to click into specific sites for coronavirus trends. This dashboard also provides reported case trends for comparison and information about concentration percentiles, similar to the metrics used by the CDC. It also gives users a lot of information about where the data come from—good for transparency!
Twin Cities, Minnesota: The Metropolitan Council, a local agency in the Twin Cities, Minnesota metro area, has monitored COVID-19 in wastewater since early in the pandemic; I shared an interview with a lead scientist there in April. Recently, the Met Council added variant information to its dashboard, showing which versions of the virus are currently driving spread (BA.5 is taking the lead right now).
I know (from looking at the COVIDPoops19 dashboard) that my new resource page includes a small sample of academic and local wastewater sites; I chose to focus on those at the state level and for larger metro areas due to my own capacity. But if there’s another dashboard that you’d like to see added to the page, please reach out and let me know! I’ll try to keep it updated on a monthly cadence.
As if BA.4 and BA.5 aren’t already enough to worry about: some COVID-19 experts are sounding the alarm about BA.2.75, a new version of Omicron that evolved out of BA.2.
This subvariant was first identified in India in late May, and has now been reported in the U.K., Germany, and several other countries, according to the World Health Organization. Scientists are concerned because it has new spike protein mutations that could heighten its ability to bypass immunity from past infections or vaccinations—including, potentially, from BA.4 or BA.5.
— World Health Organization (WHO) (@WHO) July 5, 2022
At least three BA.2.75 cases have been reported in the U.S. so far, according to a Friday press release from the surveillance company Helix. Two of these cases were on the West Coast, in Washington and California. These cases are currently lumped in with other versions of BA.2 on the CDC dashboard.
The information on BA.2.75 is fairly preliminary at this point; the WHO is monitoring it as an additional lineage of Omicron, not a separate variant of concern, and watching for new data. It’s unclear how competitive it might be with BA.5, now dominant in the U.S., but is worth keeping an eye on. As Dr. Katelyn Jetelina points out in a recent issue of Your Local Epidemiologist, the spread of BA.2.75 could further complicate fall booster shot plans.