The CDC and its partners are sequencing far fewer coronavirus samples than they have at prior periods of the pandemic, making it harder to spot new variants of concern.
In the past week (April 30 through May 6), the U.S. reported about 9,500 new COVID-19 patients admitted to hospitals, according to the CDC. This amounts to:
An average of 1,400 new admissions each day
2.9 total admissions for every 100,000 Americans
7% fewer new admissions than last week (April 22-29)
Additionally, the U.S. reported:
A 14% lower concentration of SARS-CoV-2 in wastewater than last week (as of May 10, per Biobot’s dashboard)
64% of new cases are caused by Omicron XBB.1.5; 13% by XBB.1.9; 14% by XBB.1.16 (as of May 13)
An average of 70,000 vaccinations per day
COVID-19 spread continues to trend down in the U.S., though our data for tracking this disease is now worse than ever thanks to the end of the federal public health emergency. If newer Omicron variants cause a surge this summer, those increases will be hard to spot.
As a result of the PHE’s conclusion this week, the CDC is no longer collecting national case counts or testing data. Instead, the agency now recommends using hospitalization data to monitor how hard COVID-19 is hitting your community—even though this metric typically lags behind actual infection patterns—while variant data and wastewater surveillance may provide warnings about new surges.
My national updates will take a similar approach. This week, hospital admissions continue their national plateau, with a decrease of about 7% from the week ending April 29 to the week ending May 6. The CDC’s national map show that admissions are low across the country, with 99% of counties reporting fewer than 10 new admissions per 100,000 residents.
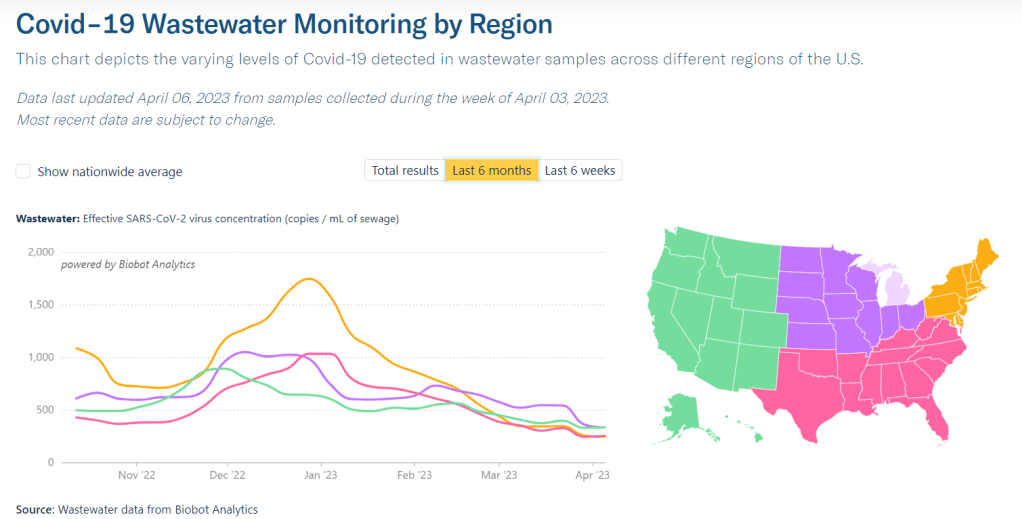
Wastewater surveillance also suggests that, while there’s still a lot of COVID-19 in the U.S., disease spread is still on a plateau or slight decline in most of the country. Biobot’s data show a minor national downturn in recent weeks; trends are similar across the four major regions, though the decline is a bit steeper on the West Coast.
The variant picture also hasn’t changed much: XBB.1.5 caused about two-thirds of new cases in the last two weeks, according to the CDC’s estimates. XBB.1.6 caused about 14% and XBB.1.9 caused 13%; these newer versions of Omicron are gaining ground, but fairly slowly. Regionally, XBB.1.6 is most prevalent in the Northeast and on the West Coast, while XBB.1.9 is most prevalent in the Midwest.
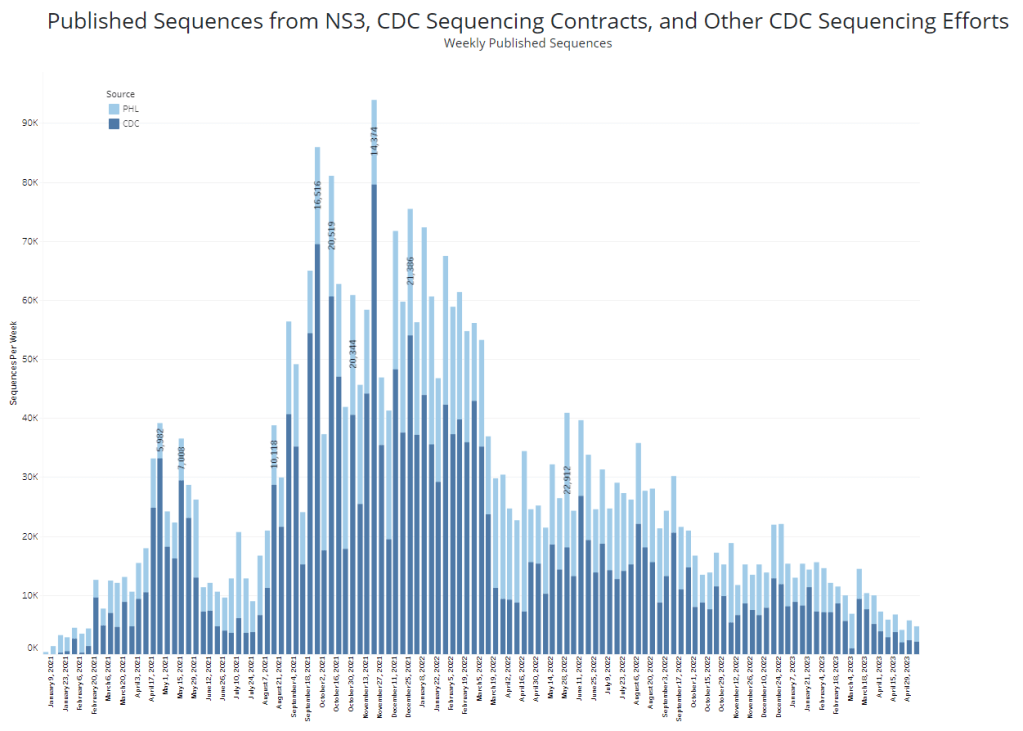
It’s worth noting, though, that the CDC has switched its variant reporting from weekly to every other week, as fewer patient specimens are going through sequencing for variant identification. The agency and its surveillance partners are sequencing around 5,000 samples every week, compared to over 80,000 a week at the height of the first Omicron surge.
Limited sequencing efforts will make it harder for the CDC to quickly identify (and respond to) new variants of concern. The same challenge is happening around the world, as PCR tests become less broadly available. Sequencing coronavirus samples from wastewater may help, but that’s only happening in a small subset of sewage testing sites right now.
One last bit of good news: vaccine administration numbers are up in the last couple of weeks, as seniors and other eligible high-risk people get their second bivalent boosters. About 70,000 people received vaccines each day this week, compared to around half that number a few weeks ago. If you’re eligible for a second booster, this is a good time to make an appointment!
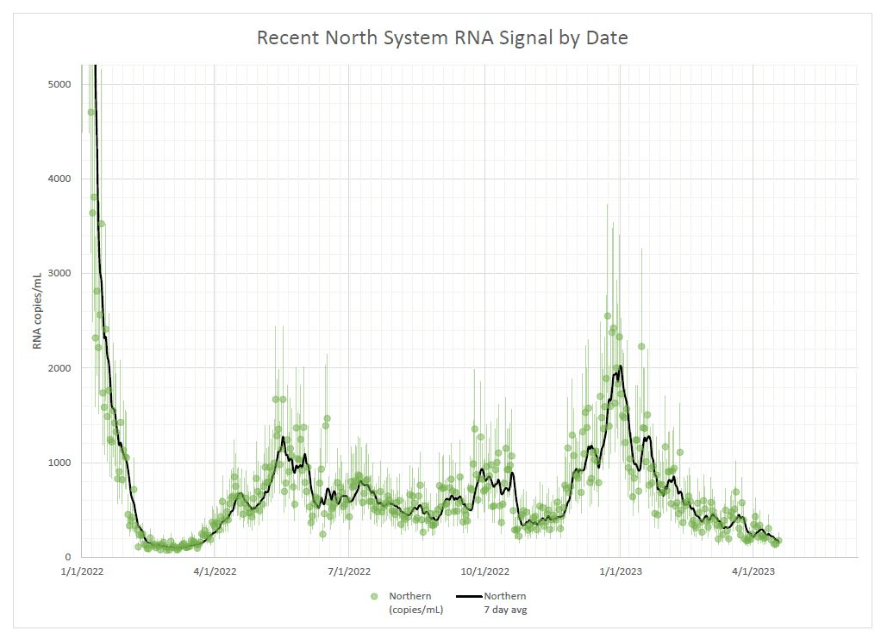
Coronavirus concentrations are trending down in Boston’s wastewater, a promising signal.
In the past week (April 13 through 19), the U.S. officially reported about 94,000 new COVID-19 cases, according to the CDC. This amounts to:
An average of 13,000 new cases each day
7% fewer new cases than last week (April 6-12)
In the past week, the U.S. also reported about 12,000 new COVID-19 patients admitted to hospitals. This amounts to:
An average of 1,700 new admissions each day
3.7 total admissions for every 100,000 Americans
8% fewer new admissions than last week
Additionally, the U.S. reported:
1,200 new COVID-19 deaths (170 per day)
74% of new cases are caused by Omicron XBB.1.5; 11% by XBB.1.9; 10% by XBB.1.16 (as of April 22)
An average of 35,000 vaccinations per day
Across the U.S., COVID-19 spread continues at a moderately high plateau as newer versions of Omicron compete with XBB.1.5. Officially-reported cases and new hospitalizations declined by 7% and 8% respectively, compared to the prior week.
Wastewater surveillance data from Biobotand from the CDC similarly show that COVID-19 spread is at a plateau. Nationally, coronavirus concentrations in sewage are higher than they were at this point in 2021 (when the initial vaccine rollout was in full swing), but lower than at this point in 2022 (when BA.2 had started spreading widely).
Of course, it’s important to flag that official case counts are becoming even more unreliable these days, as PCR testing becomes increasingly difficult to access and state health departments no longer prioritize timely reporting to the CDC. According to CDC, five states didn’t report COVID-19 cases and deaths last week: Arkansas, Florida, Iowa, Mississippi, and Pennsylvania. (Iowa has permanently stopped reporting.)
These case reporting issues are likely to continue—and perhaps accelerate—when the federal public health emergency ends next month. I’m thinking about how to adjust these National Numbers reports when that happens; that will likely involve foregrounding wastewater data and hospitalizations rather than cases.
Regionally, Biobot’s surveillance shows a slight uptick in coronavirus spread on the West Coast and declines in the other major regions. Some counties in California have reported recent increases in wastewater, according to Biobot and WastewaterSCAN, but it’s currently tough to tell if this is a sustained surge or isolated outbreaks.
The West Coast and Midwest continue to be hotspots for newer versions of Omicron, according to the CDC’s estimates, with XBB.1.9 still most prevalent by far in the region including Iowa, Kansas, Missouri, and Nebraska. Nationwide, the CDC estimates that XBB.1.9 caused about 11% of new cases in the last week and that XBB.1.16 caused 10% of new cases.
XBB.1.16 (also called “Arcturus”) was recently classified as a variant of interest by the World Health Organization because it can spread significantly faster than other Omicron lineages. The variant is likely to “spread globally and contribute to an increase in case incidence,” according to the WHO.
While I’m wary of the new variants, I have been heartened to see coronavirus levels in wastewater remain mostly at plateaus—or even decline—in many places across the U.S. In Boston, for example, coronavirus levels have been on a downward trend since early 2023. I hope to see this trend continue.
In the past week (March 30 through April 5), the U.S. officially reported about 120,000 new COVID-19 cases, according to the CDC. This amounts to:
An average of 17,000 new cases each day
37 total new cases for every 100,000 Americans
12% fewer new cases than last week (March 23-29)
In the past week, the U.S. also reported about 15,000 new COVID-19 patients admitted to hospitals. This amounts to:
An average of 2,100 new admissions each day
4.5 total admissions for every 100,000 Americans
12% fewer new admissions than last week
Additionally, the U.S. reported:
1,800 new COVID-19 deaths (250 per day)
88% of new cases are caused by Omicron XBB.1.5; 5% by XBB.1.9.1; 2% by XBB.1.5.1; 0.4% by CH.1.1 (as of April 8)
An average of 40,000 vaccinations per day
COVID-19 spread in the U.S. remains at a high plateau, according to reported cases, hospitalizations, and wastewater surveillance. Experts are watching new variants that mutated from XBB as potential drivers of more transmission this spring.
While the case numbers may seem low, remember that cases are now severely undercounted—potentially by up to 20 times. So, when the CDC reported about 37 new cases per 100,000 people last week, the true number could be closer to 700 new cases per 100,000. It’s becoming harder and harder to get a PCR test, as sites shut down and the federal health emergency’s end approaches, which will further drive undercounting.
Wastewater data, on the other hand, continue to show that coronavirus levels in the U.S. are significantly higher than they were at this time in 2022 and 2021. Last week, I wrote that Biobot’s dashboard showed a slight increase in COVID-19 spread across the country; after this week’s data updates, that appears to have been a blip, with the company’s national surveillance again showing a plateau.
Biobot’s regional data also indicates that COVID-19 spread has remained relatively consistent in the last few weeks. The Northeast and Midwest have slightly higher coronavirus levels than the South and West, but there aren’t significant differences between these regions.
As I wrote last week, new subvariant XBB.1.9.1 remains more prevalent in the Midwest, particularly the region including Iowa, Kansas, Missouri, and Nebraska (where it caused about 18% of new cases in the last week, per CDC estimates). Some wastewater testing sites in these states have reported increases recently, but there isn’t a consistent increase across the board.
Nationally, the CDC estimates that XBB.1.9.1 caused about 5% of new cases nationwide in the week ending April 8, compared to 88% caused by XBB.1.5. XBB.1.9.1 has been growing relatively slowly, so it may be a few more weeks before we see it either outcompete XBB.1.5 or die out at low levels. Experts are also watching XBB.1.16, which drove a surge in India recently but has not shown up in large numbers in the U.S. yet.
Will the U.S. see a new surge this spring? It seems possible, thanks to Omicron’s continued evolution and our lack of collective safety measures. But continued declines in data reporting will make it harder to see this surge than it’s ever been.
In this environment, wastewater surveillance is growing more and more valuable. It’s also probably a good idea to keep taking some basic precautions (like masking in public indoor spaces, or regularly testing) no matter how low the reported cases get in your community.
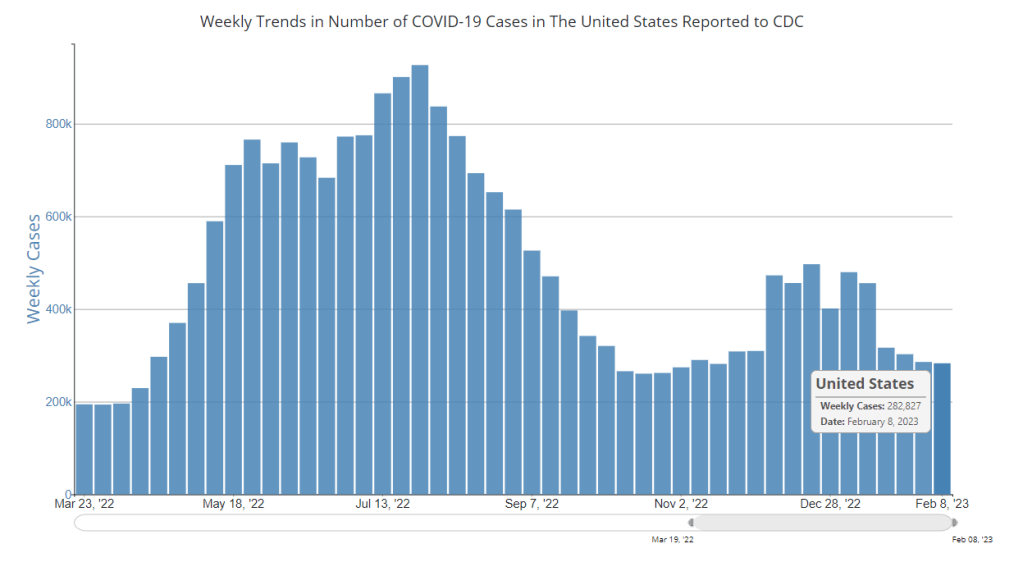
National COVID-19 cases have reached a plateau. Note that the cases reported to the CDC are a significant undercount of actual infections.
In the past week (February 2 through 8), the U.S. officially reported about 280,000 new COVID-19 cases, according to the CDC. This amounts to:
An average of 40,000 new cases each day
86 total new cases for every 100,000 Americans
1% fewer new cases than last week (January 26-February 1)
In the past week, the U.S. also reported about 26,000 new COVID-19 patients admitted to hospitals. This amounts to:
An average of 3,700 new admissions each day
7.8 total admissions for every 100,000 Americans
6% fewer new admissions than last week
Additionally, the U.S. reported:
3,200 new COVID-19 deaths (450 per day)
75% of new cases are caused by Omicron XBB.1.5; 20% by BQ.1 and BQ.1.1; 1% by CH.1.1 (as of February 11)
An average of 80,000 vaccinations per day
Nationwide, COVID-19 spread appears to be in a plateau: not substantially increasing, but not substantially decreasing, either. Officially-reported cases dropped by only 1% this week compared to the week prior, while wastewater data shows that the coronavirus concentration in our sewage hasn’t changed significantly for the last month.
Hospitalizations continue to decline for flu and RSV as well as COVID-19, according to the CDC’s data from emergency departments. But the COVID-19 decline has slowed, remaining consistent at a higher level than the flu and RSV declines. About 3,700 people were newly hospitalized for COVID-19 every day last week.
At the regional level, COVID-19 spread is still declining (from a relatively higher winter peak) in the Northeast, and is solidly in a plateau in the South and West, per Biobot’s regional data. The Midwest reported a slight uptick this past week, continuing a trend that I noted in last weekend’s National Numbers.
Some of the highest case, wastewater, and hospitalization increases reported right now are coming from the upper Midwest: Montana, North Dakota, South Dakota, and Idaho. COVID-19 spread is also trending up in Alabama, Kansas, New Hampshire, and West Virginia, along with other states in the Midwest and South, per the latest Community Profile Report.
Omicron XBB.1.5, the latest and most contagious version of the virus, is spreading across these regions and may be contributing to increased cases. According to the CDC’s latest estimates, XBB.1.5 now accounts for more than half of new cases in every region of the country, and about 75% of new cases nationwide.
No other variants are trending up right now; XBB.1.5 has solidly outcompeted the rest of the “variant soup” in the U.S. Experts will doubtless be watching for this subvariant to further evolve, while we also look out for any new variants from other parts of the world.
Meanwhile, the daily average of new COVID-19 vaccinations in the U.S. has dropped under 100,000 for the first time since the country’s vaccination campaign started in winter 2020. New booster doses continue to be heavily underutilized.
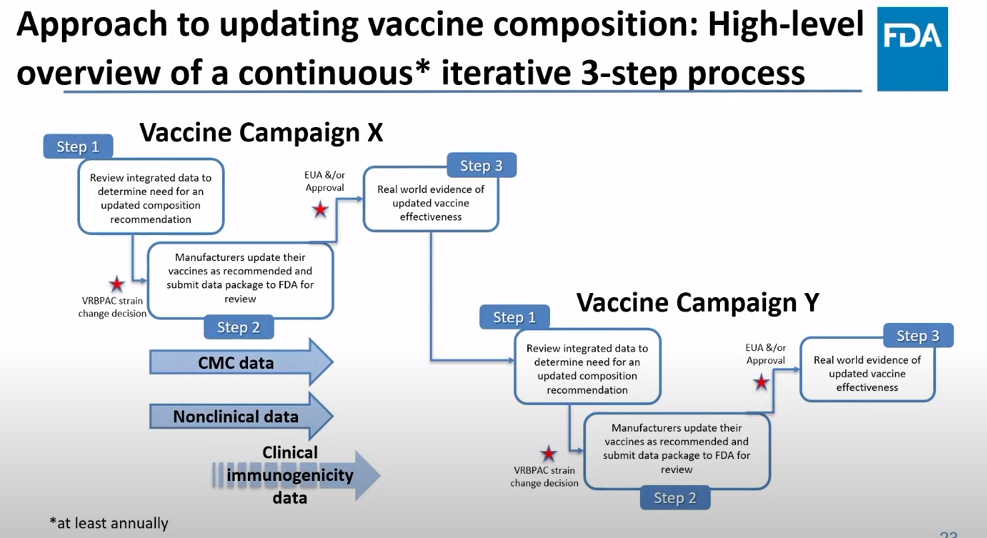
The FDA recommends that the U.S. shifts to annual COVID-19 vaccines, with a variety of data sources feeding into decision-making. Screenshot from the VRBPAC meeting on January 26, 2023.
On Thursday, the FDA’s Vaccines and Related Biological Products Advisory Committee (or VRBPAC) met to discuss the future of COVID-19 vaccines. While the committee readily agreed that our current, Omicron-specific shots are working well and should be used more broadly, it had a hard time answering other questions about future vaccine regimens—largely due to a lack of good data.
Now, the lack of good U.S. data on vaccine effectiveness is not a new problem. I personally have been writing about thissince fall 2021, to the point that I feel like a broken record for bringing it up again. To summarize: the U.S. has a fractured health system in which every state tracks vaccinations differently, with a lot of local public health departments and private companies in the mix, too. As a result, it’s challenging for researchers to determine exactly who is getting COVID-19 after vaccination and how the virus is impacting them.
This lack of detailed vaccine effectiveness data was a problem in fall 2021, when federal officials decided on an initial round of booster shots. And it’s still a problem in winter 2023, as the same officials attempt to plot out a future in which COVID-19 is another disease that we deal with on an annual basis.
But this week’s VRBPAC meeting revealed some other areas of data that are also lacking as we try to answer questions about future vaccines. Here’s my summary of five primary data gaps that came up at the meeting, and some suggestions for potential solutions.
Detailed vaccine effectiveness data
The biggest data gap, of course, is our lack of answers to the question: Who is getting sick with COVID-19 after vaccination? And related questions: How sick did they get? Which variants did they get sick with? What preexisting conditions or comorbidities did they have?
Our lack of standardized medical data in the U.S. makes it tough to answer these questions at the population level. Analyzing variants is particularly tricky, given that variant surveillance in the U.S. tends to be entirely anonymized—with no connections between the genomic sequencing of random PCR tests and the health outcomes (or vaccination statuses) of those patients. And analyzing preexisting conditions can be crucial as officials try to decide which groups of people need extra boosters, but these conditions often are not collected in standard databases or linked to COVID-19 records.
As a result, U.S. officials tend to rely on other countries with more comprehensive, standardized data systems for information on how well the vaccines work. We also have to rely on the pharmaceutical companies producing these vaccines, which often don’t openly share their data—they tend to present clinical trial results in press releases, over peer-reviewed studies. Companies also tend to do trials that align better with their own financial interests, rather than looking at the full scope of vaccine effectiveness.
Even in this week’s VRBPAC meeting, scientists from Moderna presented results from a clinical trial—conducted in the U.K.—that tested the company’s bivalent boosters against the original (non-Omicron) boosters.
Better tracking of variants
The primary reason why our COVID-19 vaccines require updates in the first place is the coronavirus’ continued evolution. Every new lineage of Omicron that rises to prevalence is either a bit better at spreading quickly, a bit better at evading immunity from prior infection or vaccination, or both. To successfully tweak our vaccines in the future, scientists will need to know which variants are out there and how dangerous they are.
Right now, variant tracking largely relies on PCR testing, as researchers randomly select some swab samples to sequence. But with fewer and fewer people getting PCR tests, the sample pool is dwindling. As a result, to stay ahead of new variants, the U.S. needs to diversify its surveillance options. That will likely include more variant sequencing from wastewater (as a population-level COVID-19 sample), more sequencing at hospitals and healthcare centers, and more travel surveillance focused on international variant patterns.
Variant surveillance will also need to inform how suited U.S.-developed COVID-19 vaccines are for the rest of the world. Right now, the pharmaceutical companies that have produced the most effective vaccines (i.e. Pfizer and Moderna) are American—so American regulators are essentially dictating vaccine policy for the world, even though their priority is the U.S. FDA official Jerry Weir said as much at the meeting. U.S. hegemony over COVID-19 vaccines will continue to be a complex, fraught topic going forward.
Tracking different types of immunity
At the VRBPAC meeting, Moderna, Pfizer, and Novavax all presented data on how well their vaccines work against currently-dominant coronavirus variants. While they included some clinical data (case rates, hospitalization rates), the presentations mostly focused on one metric: antibody titers. To calculate if a vaccine works against a certain variant, the easiest strategy is measuring the antibodies produced after a vaccinated blood sample is exposed to that variant.
While this is the easiest strategy, it’s far from the only way to examine how well a vaccine works. Members of the VRBPAC committee frequently asked the pharmaceutical companies for those other metrics: T cells, B cells, and more ways of measuring the immune system’s response to COVID-19. But the companies had little response to these questions. Even FDA and NIH officials at the meeting admitted that they still didn’t have a good understanding of how, exactly, our current vaccines impact our immune systems, beyond generating antibodies.
To better evaluate future vaccines, scientists will need to get better at measuring other aspects of our immune responses. That includes future mRNA vaccines as well as next-generation vaccines in the works right now, such as nasal vaccines (recently authorized in China and India) and vaccines designed to protect against all variants (currently in development at Duke University and other institutions).
I also think it’s worth noting that, as Katelyn Jetelina writes in her coverage of the VRBPAC meeting at Your Local Epidemiologist, the FDA could require pharmaceutical companies to study the immune system more holistically when they submit further vaccine updates for authorization. “The FDA could require sponsors to do detailed investigations, e.g. assessing lymph nodes, bone marrow, and breakthroughs,” she writes. “This would help us understand immunity better, so we can make better recommendations. It’s not clear why they aren’t pushing for this.”
Improving vaccine safety tracking
Two years after the first COVID-19 vaccines were authorized, we now know that the vaccines are overwhelmingly safe and effective. Most people have mild side effects following their shots, like sore arms and fatigue, but the benefits of getting vaccinated far outweigh the risks. However, some discussion at the VRBPAC meeting indicated that federal agencies could do a better job of tracking rare (yet important) serious side effects.
For example, a safety presentation from the Kaiser Permanente Vaccine Study Center suggested that there might be a small increase in stroke risk for older adults who get vaccinated. The risk has only appeared in one vaccine safety database so far and appears to be minimal, per the FDA, but it’s still worth closer examination.
In addition, as Helen Branswell and Matthew Herper discuss in the STAT News liveblog, the VRBPAC meeting didn’t present much new data about vaccine safety risks for children, such as myocarditis among boys and young men. Plus, we have limited data so far on whether vaccination may contribute to autoimmune conditions or Long COVID-like symptoms, a problem that has shown up in some studies and anecdotal reports.
If public health officials are going to continue encouraging Americans to get COVID-19 shots once a year (or more), they will need to thoroughly address concerns about these potential side effects. This is particularly true for young children, a group that’s been vaccinated at fairly low numbers so far.
Navigating COVID-19’s interactions with other vaccines
At the VRBPAC meeting, FDA officials suggested a potential future in which most Americans get one COVID-19 vaccine per year, on a similar timeline to the annual flu shot. Variant strains might be selected in the spring or summer, with vaccines developed and produced in time for a fall vaccination campaign. Some at-risk groups (older adults, people with compromised immune systems, etc.) might get two doses each year.
To make this possible, the VRBPAC committee members suggested that we’ll need to track how COVID-19 vaccines intersect with other vaccines. For example, if an older adult receives their flu shot and COVID-19 shot in the same doctor’s visit, does that dampen how well one or the other vaccine works? Does it increase the risks of severe side effects? We don’t know, at this point.
Another major area of future study will be how COVID-19 vaccines may fit into regular, childhood immunization schedules for young kids. Similarly to the COVID-19 plus flu question, scientists will need to track any potential interactions between COVID-19 shots and other regular shots—along with answering questions about how many shots are needed, timing between shots, and more.
One day, I’m sure, we will have a regular COVID-19 vaccination schedule in the U.S. that runs parallel to our flu vaccination schedule. But it will take time, discussions, and a lot more data to get there.
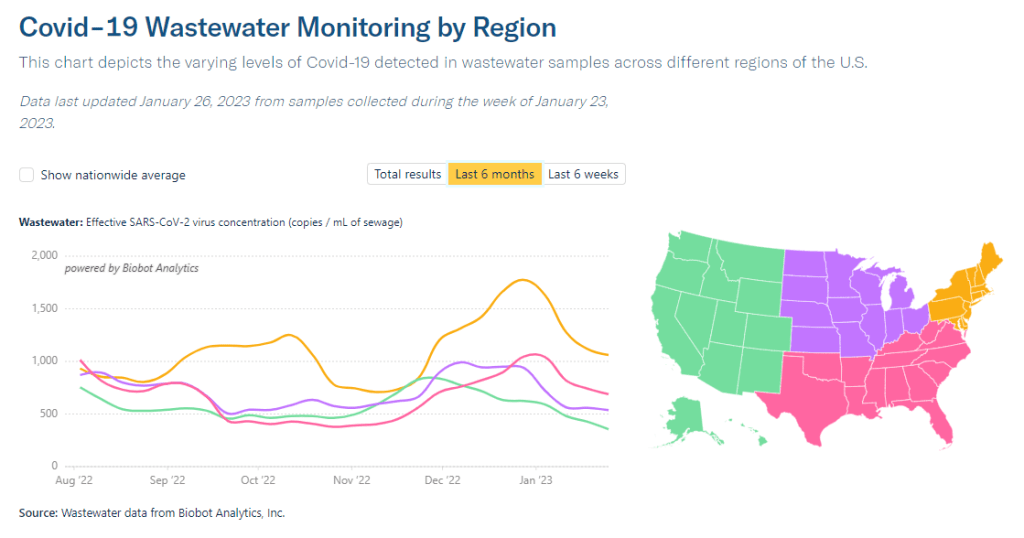
Biobot’s regional data suggest that most of the country is seeing declining COVID-19 spread, but we’re heading into high plateaus.
In the past week (January 19 through 25), the U.S. officially reported about 300,000 new COVID-19 cases, according to the CDC. This amounts to:
An average of 42,000 new cases each day
90 total new cases for every 100,000 Americans
11% fewer new cases than last week (January 12-18)
In the past week, the U.S. also reported about 30,000 new COVID-19 patients admitted to hospitals. This amounts to:
An average of 4,200 new admissions each day
9.0 total admissions for every 100,000 Americans
14% fewer new admissions than last week
Additionally, the U.S. reported:
3,800 new COVID-19 deaths (540 per day)
61% of new cases are caused by Omicron XBB.1.5; 31% by BQ.1 and BQ.1.1; 2% by CH.1.1 (as of January 28)
An average of 100,000 vaccinations per day
At the national level, COVID-19 spread appears to be approaching another plateau. New cases and hospitalizations (as reported by the CDC) are still in decline, but their descent is slowing: reported cases dropped by 11% this week, compared to 24% last week.
Wastewater surveillance presents the same trends. National data from Biobot suggest that COVID-19 transmission is leveling out in a similar place to where we were in October and November 2022, before the holiday surge drove up spread.
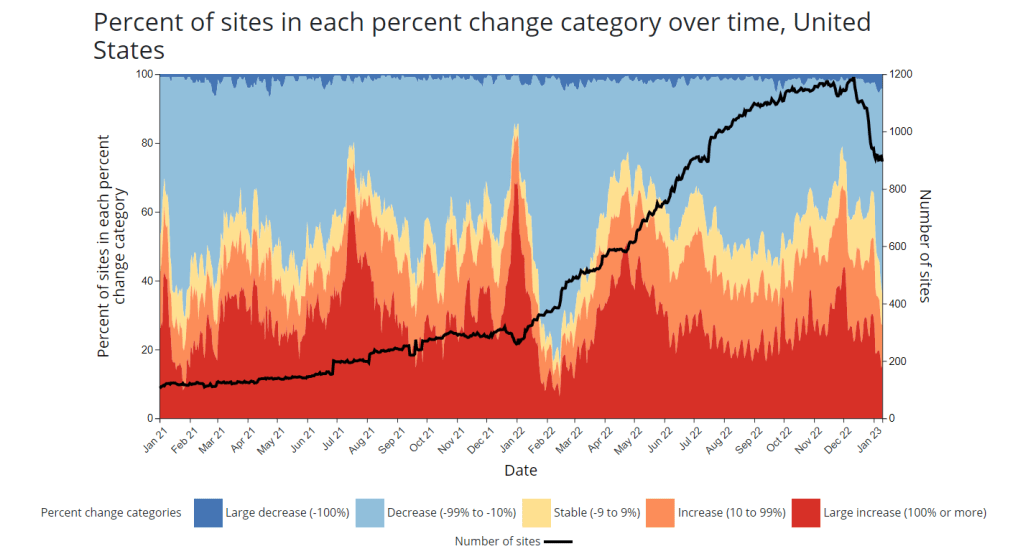
Biobot’s regional data show a slowing decline in the Northeast, plateaus in the Midwest and South, and a somewhat-more-pronounced decline in the West. And wastewater surveillance data from the CDC shows that COVID-19 spread is going up in some places, down in others: out of about 1,000 sites reporting data in the last two weeks, 48% reported decreases in coronavirus levels while 40% reported increases.
Unlike in recent weeks where every state has reported declines in COVID-19 cases and hospitalizations, a few places are now reporting definitive upticks, according to the latest Community Profile Report. These states include Alaska, Vermont, Maine, South Dakota, North Dakota, Nevada, Oklahoma, Minnesota, and Indiana.
Why might some states report COVID-19 upticks just after we emerged from a surge over the holidays? One explanation could be the XBB.1.5 variant, which continues to outcompete other Omicron lineages. XBB.1.5 now comprises about 60% of new cases nationwide (according to the CDC’s estimates); while it is most dominant in the Northeast, it’s growing—and likely reinfecting people—in other regions.
The CDC’s latest variant estimates also now include Omicron CH.1.1, which has been connected to rising cases in the U.K. and New Zealand in recent months. Per the CDC, CH.1.1 has been present in the U.S. at low levels (like, 1% or less) for a few weeks now, without posing a major challenge to XBB.1.5. But it is still a variant worth keeping an eye on.
As flu and RSV cases continue to trend down, the U.S. is confronted with the final weeks of a respiratory disease-heavy winter that was pretty rough on our healthcare system—but fell short of the mind-boggling case numbers that we saw in the prior two winters. Yes, we didn’t see a repeat of “the first Omicron wave”; but still, millions of people got sick, thousands died. Many will likely experience Long COVID as a consequence of their infections this winter.
It’s the fourth year of the pandemic. I’ve written this statement in a few pitches and planning documents recently, and was struck by how it feels simultaneously unbelievable—wasn’t March 2020, like, yesterday?—and not believable enough—haven’t we been doing this pandemic thing for an eternity already?
As someone who’s been reporting on COVID-19 since the beginning, a new year is a good opportunity to parse out that feels-like-eternity. So this week, I reflected on the major trends and topics I hope to cover in 2023—both building on my work from prior years and taking it in new directions.
(Note: I actually planned to do this post last week, but then XBB.1.5 took higher priority. Hence its arrival two weeks into the new year.)
Expansions of wastewater, and other new forms of disease surveillance
As 2022 brought on the decline of large-scale PCR testing, wastewater surveillance has proven itself as a way to more accurately track COVID-19 at the population level—even as some health departments remain wary of its utility. We also saw the technology’s use for tracking monkeypox, polio, and other conditions: the WastewaterSCAN project, for example, now reports on six different diseases.
This year, I expect that wastewater researchers and public agencies will continue expanding their use of this surveillance technology. That will likely mean more diseases as well as more specific testing locations, in addition to entire sewersheds. For example, we’re already seeing wastewater testing on airplanes. I’m also interested in following other, newer methods for tracking diseases, such as air quality monitors and wearable devices.
At the same time, these surveillance technologies will continue to face challenges around standardization and public buy-in. The CDC’s big contract with Biobot expires this month, and I’ve already noticed a decline in sites with recent data on the agency’s dashboard—will CDC officials and local agencies step in to fill gaps, or will wastewater testing become even more sporadic?
New variants, and how we track them
For scientists who track the coronavirus’ continued evolution, 2022 was the year of Omicron. We didn’t see all-new virus lineages sweeping the world; instead, Omicron just kept mutating, and mutating, and mutating. It seems likely that this pattern will continue in 2023, but experts need to continue watching the mutation landscape and preparing for anything truly concerning.
With declining PCR testing, public agencies and companies that track variants have fewer samples to sequence. (This led to challenges for the CDC team tracking XBB.1.5 over the holidays.) As a result, I believe 2023 will see increased creativity in how we keep an eye on these variants—whether that’s sequencing wastewater samples, taking samples directly from healthcare settings, increased focus on travel surveillance, or other methods.
Public health experts—and journalists like myself—also need to rethink how we communicate about variants. It’s no longer true that every new, somewhat-more-contagious variant warrants alarm bells: variants can take off in some countries or regions while having relatively little impact in others, thanks to differences in prior immunity, seasonality, behavior, etc. But new variants still contribute to continued reinfections, severe symptoms, Long COVID, and other impacts of COVID-19. Grid’s Jonathan Lambert recently wrote a helpful article exploring these communication challenges.
Long COVID and related chronic diseases
As regular readers likely know, Long COVID has been an increased topic of interest for me over the last two years. I’ve covered everything from disability benefits to mental health challenges, and am now leading a major project at MuckRock that will focus on government accountability for the Long COVID crisis.
Long COVID is the epidemic following the pandemic. Millions of Americans are disabled by this condition, whether they’ve been pushed out of work or are managing milder lingering symptoms. Some people are approaching their three-year anniversary of first getting sick, yet they’ve received a fraction of the government response that acute COVID-19 got. Major research projects are going in the wrong directions, while major media publications often publish articles with incorrect science.
For me, seeing poor Long COVID coverage elsewhere is great motivation to continue reporting on this topic myself, at MuckRock and other outlets. I’m also planning to spend more time reading about (and hopefully covering) other chronic diseases that are co-diagnosed with Long COVID, like ME/CFS and dysautonomia.
Ending the federal public health emergency.
Last year, we saw many state and local health agencies transition from treating COVID-19 as a health emergency to treating it as an endemic disease, like the many others that they respond to on a routine basis. This transition often accompanied changes in data reporting, such as shifts from daily to weekly COVID-19 updates.
This year, the federal government will likely do the same thing. POLITICO reported this week that the Biden administration is renewing the federal public health emergency in January, but will likely allow it to expire in the spring or summer. The Department of Health and Human Services has committed to telling state leaders about this expiration 60 days before it happens.
I previously wrote about what the end of the federal emergency could mean for COVID-19 data: changes will include less authority for the CDC, less funding for state and local health departments, and vaccines and treatments controlled by private markets rather than the federal government. I anticipate following up on this reporting when the emergency actually ends.
Transforming the U.S. public health system
Finally, I intend to follow how public health agencies learn from—or fail to learn from—the pandemic. COVID-19 exposed so many cracks in America’s public health system, from out-of-date electronic records systems to communication and trust issues. The pandemic should be a wakeup call for agencies to get their act together, before a new crisis hits.
But will that actually happen? Rachel Cohrs has a great piece in STAT this week about the challenges that systemic public health reform faces, including a lack of funding from Congress and disagreements among experts on what changes are necessary. Still, the window for change is open right now, and it may not be at this point in 2024.
XBB.1.5 caused about 28% of new cases in the week ending January 7 (confidence interval: 14% to 47%), according to the CDC’s estimates.
You’ve probably seen it in the news this week: XBB.1.5 is the latest Omicron subvariant to spread rapidly through the U.S.
It is, of course, more transmissible and more capable of evading immunity from past infections than other versions of Omicron that have gone before it, as this lineage continues mutating. Scientists are still learning about XBB.1.5; it emerged from the U.S. during the holiday season, which has posed surveillance challenges. But we know enough to say that this variant is bad news for an already overstretched healthcare system.
Here’s a brief FAQ post on XBB.1.5.
Where did XBB.1.5 come from?
XBB, the parent of this latest lineage, emerged in Asia in October 2022. It evolved from Omicron BA.2 via recombination, which basically means two different BA.2 subvariants fused—likely while the same person was infected with both—and formed this new strain. (See my variants post from October for more details on XBB.)
XBB started spreading and mutating in the U.S. a few weeks later, leading to XBB.1.5. This subvariant was first identified in New York State in mid-December, though it could have evolved elsewhere in the northeast (since New York has better variant surveillance than some other states). Eric Topol’s newsletter has more details about XBB evolution.
New variant to watch
XBB.1.5 really taking off in New York, where it appears to have evolved
BQ.1* in NY has been almost flat since dominance in Nov
What are XBB.1.5’s advantages compared to other variants?
It spreads faster, likely because it is more capable of evading immune system protections from past infection or vaccination than other Omicron subvariants. In the U.S., CDC data suggests that XBB.1.5 is starting to outcompete other lineages in the “Omicron variant soup” we currently have circulating.
BQ.1.1 and XBB (original) were already known to be the best-evolved subvariants in this area before XBB.1.5 came along, according to this December 2022 paper in Cell. XBB.1.5 has taken this immune escape further, as it evolved a mutation called F486P that’s tied to this property.
“It’s crazy infectious,” Paula Cannon, a virologist at the University of Southern California, told USA TODAY reporter Karen Weintraub. Cannon added that protections that have worked against other coronavirus strains for the last three years will likely be less effective against XBB.1.5 and other new variants.
What questions are scientists currently working to answer about XBB.1.5?
One major question that arises with any new subvariant is severity: will XBB.1.5 have a higher capacity to cause severe symptoms than other coronavirus lineages? (We now know, for example, that Delta was more severe compared to prior variants.)
The World Health Organization is currently working on a report about XBB.1.5’s severity, according to POLITICO. Scientists and public health officials will also study whether current COVID-19 treatments work against this subvariant. Antiviral treatments Paxlovid and Mulnopiravir likely won’t be impacted, but Omicron’s continued evolution has put a lot of restrictions on monoclonal antibodies.
Another important question will be how well our updated booster shots work against XBB.1.5. The shots used in the U.S. were primed for BA.4 and BA.5, while XBB is derived (albeit indirectly) from BA.2, so our shots are not the best match. Still, antibody neutralization studies have shown that the shots provide protection against XBB, meaning some impact on XBB.1.5 is likely. This is a great time to get your booster if you haven’t yet.
What impact is XBB.1.5 currently having in the U.S.?
The subvariant caused about 28% of new cases in the week ending January 7, according to CDC estimates. These estimates have a fairly wide confidence interval, though, meaning that XBB.1.5’s true prevalence could be between 14% and 47%; the CDC will improve these estimates in the coming weeks as it collects more XBB.1.5 samples.
But we know with more confidence that XBB.1.5 has already taken over in the Northeast. It’s causing the vast majority of cases in HHS Region 1 (New England) and Region 2 (New York and New Jersey). Other mid-Atlantic states are catching up.
Some experts have noted that New York and other Northeast states are currently reporting rising COVID-19 hospitalizations, which could be a sign that XBB.1.5 causes more severe disease. It’s currently unclear how much the increased hospitalizations may be attributed to XBB.1.5’s presence, though, as the entire country is seeing this trend already in the wake of the holidays.
Sam Scarpino, a disease surveillance expert at Northeastern University, has a helpful Twitter thread explaining this issue. “It’s clear that XBB.1.5 is correlated [to] an increase in hospitalizations in many highly vaccinated states,” he writes. “I suspect it will hit harder in states with lower bivalent booster rates.”
1/ For those concerned about #XBB15 and hospitalizations, I think the evidence is more mixed than many are admitting.
While it's true hospitalizations are up in states like MA where XBB.1.5 is common, they are up across the entire US, even in states w/ little-to-no #XBB15! pic.twitter.com/LVrYqjn44K
Why has XBB.1.5’s prevalence been harder to pin down than other subvariants?
Many of the news articles you might have read this week about XBB.1.5 cited that the subvariant’s prevalence more than doubled in about one week, according to CDC estimates. But then the CDC’s estimates were revised down this week, suggesting that XBB.1.5 actually caused 18% of new cases in the last week of December—not 41%.
Why did the estimate change so dramatically? Well, it actually didn’t: as the CDC itself pointed out in its Weekly Review newsletter this Friday, the 41% estimate had a big confidence interval (23% to 61%), so the revision down to 18% was not far outside the existing realm of possibility. The CDC revises its variant estimates constantly as new data come in; this might be a bigger shift than we’re used to seeing, but it’s still pretty unsurprising.
The CDC’s variant forecasting team is also facing a couple of challenges unique to XBB.1.5 right now. First, this is a homegrown, U.S.-derived variant, so they don’t have a wealth of international sequences to analyze in preparation for a U.S. surge. And second, XBB.1.5 arose during the holidays, when a lot of COVID-19 testing and sequencing organizations were taking time off. The CDC is currently working with very limited data, but it will continue to revise estimates—and make them more accurate—as more test results come in.
For more info on the CDC’s process here, I recommend this Twitter thread from epidemiologist Duncan MacCannell:
The variant surveillance dashboard on the CDC COVID Data Tracker was just updated to include projections up to 1/7/2022; this is a weekly update that posts like clockwork every Friday. https://t.co/rnE66MCoHSpic.twitter.com/WGtfHix8va
How will XBB.1.5 impact the next phase of the pandemic?
Scientists will be closely watching to see how quickly XBB.1.5 spreads in other parts of the U.S., as well as how it performs in other countries that recently had surges of other Omicron subvariants.
Overall, the data we have about this subvariant so far suggest that it’s not distinct enough from other versions of Omicron to drive a massive new surge on the level of Omicron BA.1 last winter. But it’s still arriving in the wake of holiday travel and gatherings—and in a country that has largely abandoned public health measures that stop the virus from spreading.
In New York, for example, XBB.1.5 might not be the main cause of rising hospitalizations. Yet it is undoubtedly making more people sick with COVID-19, at a time when this region also faces continued healthcare pressure from flu and RSV. And an impending nurses’ strike won’t help the situation either, to put it mildly.
I think this Twitter thread from T. Ryan Gregory, an evolutionary biology expert who tracks coronavirus variants, is helpful at putting XBB.1.5 into context. This latest lineage follows other versions of Omicron that have kept the U.S. and other countries at relatively high levels of COVID-19 transmission throughout the last year. While our current moment may not look as dire as January 2022, we are currently seeing COVID-19 go up from an already-unsustainable baseline.
“BA.1 was the highest peak,” he writes, referring to 2022 in Canada and the U.K., “but the area under the curve of the others was as bad or worse.”
That said, I don't think "not as bad as the first Omicron wave" should be the standard. As noted, Canada, the UK, etc. had their deadliest year in 2022 through multiple Omicron waves. BA.1 was the highest peak, but the area under the curve of the others was as bad or worse. pic.twitter.com/5JwU857oHo
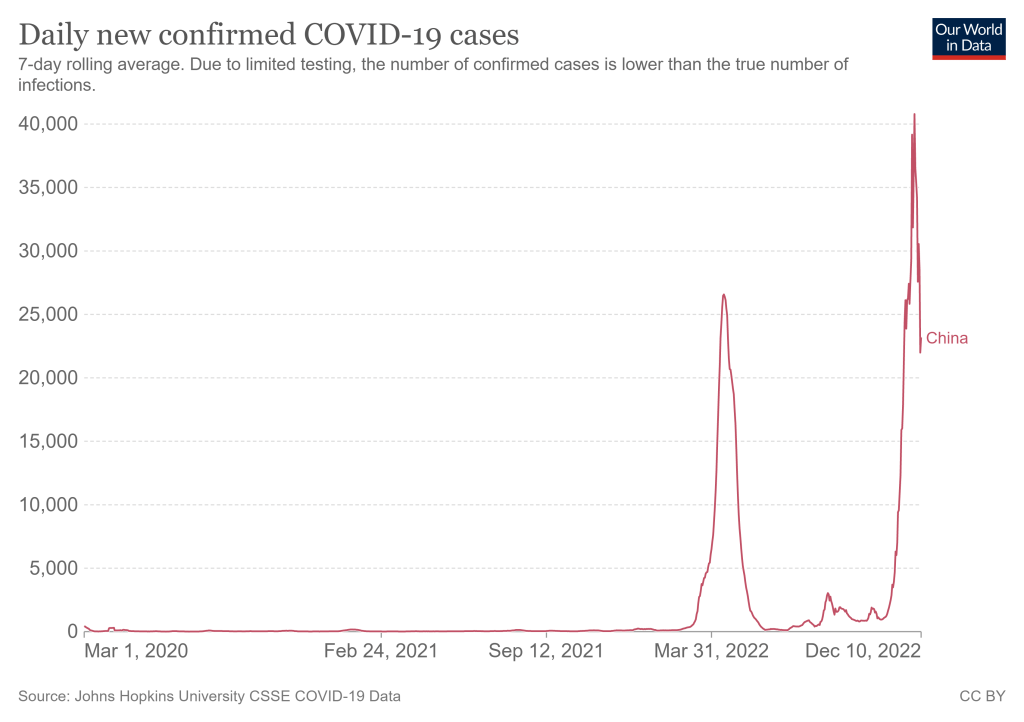
As China rolls back on COVID-19 safety measures, its rising case load is likely to shoot up further. Chart from Our World in Data.
China has rolled back some of its most rigorous COVID-19 safety policies, essentially moving away from its “zero COVID” strategy, following recent protests. I am no expert on China’s political or health policies here, but I did want to share some reflections on what this rollback could mean for global COVID-19 data, citing from Katherine Wu’s recent story in The Atlantic.
First of all, it’s important to note that we don’t have much information about coronavirus variants circulating in China. According to the global database GISAID, China has submitted a total of just 667 Omicron sequences—compared to nearly two million from the U.S. The country’s most recent sample was submitted on November 29, almost two weeks ago. Some reports, like this one in the Global Times, suggest that Omicron BF.7 is the dominant variant in Beijing, but the pattern could be different in other parts of the country.
Without more data, it’s hard to say for sure. And this is concerning because, if a new variant evolves in China as the virus spreads more widely there in the coming weeks, it could take more time for the rest of the world to learn about it than if a new variant emerged in other countries. Quick responses and international collaboration have been crucial in responses to new variants over the last two years; the global scientific community needs to be prepared to study and adapt to any new variant that might come out of China.
At the same time, China’s case data are going to become less reliable as the country reduces its clinical testing. Daily case numbers have already appeared to drop, per Our World in Data, but this could be a product of less testing for asymptomatic people (and/or data delays) rather than a surge actually turning around. I also noted that Our World in Data does not have any testing numbers for China more recent than April 2022.
China is already more limited at sharing COVID-19 data than other countries. But if case numbers become less reliable, it will get harder for international health experts to keep tabs on how bad China’s surge is getting. And it could get very bad: one modeling analysis, published in Nature in May, found that an unchecked Omicron wave in the country could lead to demand for intensive care units at 15.6 times the country’s current capacity—and 1.55 million deaths.
Based on its current healthcare system, China is not prepared for a massive national surge of severe COVID-19 cases. It’s probably even less prepared for the massive surge of Long COVID cases that could follow. This has implications for global health, economics, and more.
Even without a spike in severe disease, a wide-ranging outbreak is likely to put immense strain on China—which may weigh heavily on its economy and residents for years to come. After the SARS outbreak that began in 2002, rates of burnout and post-traumatic stress among health-care workers in affected countries swelled. Chinese citizens have not experienced an epidemic of this scale in recent memory, Chen told me. “A lot of people think it is over, that they can go back to their normal lives.” But once SARS-CoV-2 embeds itself in the country, it won’t be apt to leave. There will not be any going back to normal, not after this.
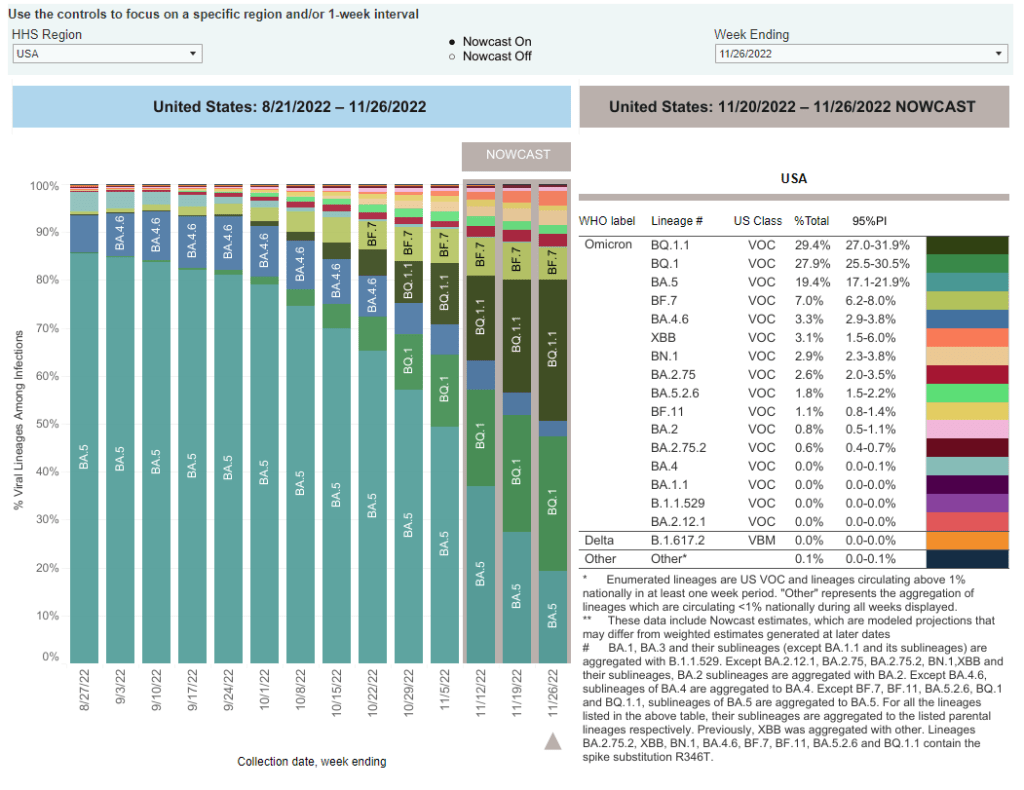
BA.5 sublineages BQ.1 and BQ.1.1 are now the dominant variants in the U.S., while newer lineage XBB has made an appearance. Chart via the CDC.
In the past week (November 17 through 23), the U.S. reported about 310,000 new COVID-19 cases, according to the CDC. This amounts to:
An average of 44,000 new cases each day
93 total new cases for every 100,000 Americans
8% more new cases than last week (November 10-16)
In the past week, the U.S. also reported about 24,000 new COVID-19 patients admitted to hospitals. This amounts to:
An average of 3,400 new admissions each day
7.2 total admissions for every 100,000 Americans
0.2% more new admissions than last week
Additionally, the U.S. reported:
2,600 new COVID-19 deaths (380 per day)
57% of new cases are caused by Omicron BQ.1 and BQ.1.1; 7% by BF.7; 3% by BN.1; 3% by XBB (as of November 26)
An average of 300,000 vaccinations per day
Nationwide, reported COVID-19 cases went up last week: the CDC reports 8% more cases in the week ending November 23 than in the week ending November 16. Wastewater monitoring also suggests a pre-Thanksgiving uptick, according to Biobot, while new hospitalizations have been at a plateau.
All eyes will be on wastewater data in the next couple of weeks, to look for potential spread after Thanksgiving travel and gatherings. We likely won’t see any immediate spikes in case data thanks to the data delays that always happen after holidays, but wastewater surveillance is less susceptible to these delays (and less biased by behavioral patterns). To look for wastewater data in your community, see the COVID-19 Data Dispatch’s resource page.
Any outbreaks we see in the coming weeks will likely be driven by newer coronavirus variants, combining forces with holiday behavior. Omicron subvariants BQ.1 and BQ.1.1 caused about 57% of new COVID-19 cases in the week ending November 26, according to CDC estimates; the BQ lineage is more transmissible than its parent variant, BA.5, though it has not caused major case spikes in the U.S. yet.
The CDC’s latest variant update also provides estimates on XBB, a subvariant that evolved from BA.2 and that has caused new surges in some Asian countries. XBB caused about 3% of new cases in the last week, the agency estimates, with higher prevalence in the Northeast and West coast. Health officials are closely watching XBB due to the many mutations on its spike protein, but it’s unclear whether this subvariant alone could cause a new surge.
As we watch for new COVID-19 outbreaks, healthcare systems—especially children’s hospitals— across the country are already facing intense pressure from the flu, RSV, and other respiratory viruses. Many states, particularly on the East coast and in the South, continue to report very high levels of influenza-like activity, according to the CDC.
If you took part in a Thanksgiving gathering over the last few days: this week, you should look out for any respiratory symptoms and consider getting a PCR test, if you can. If possible, get a test that will check for COVID-19, the flu, and RSV at once. Make sure any disease spread stops with you!