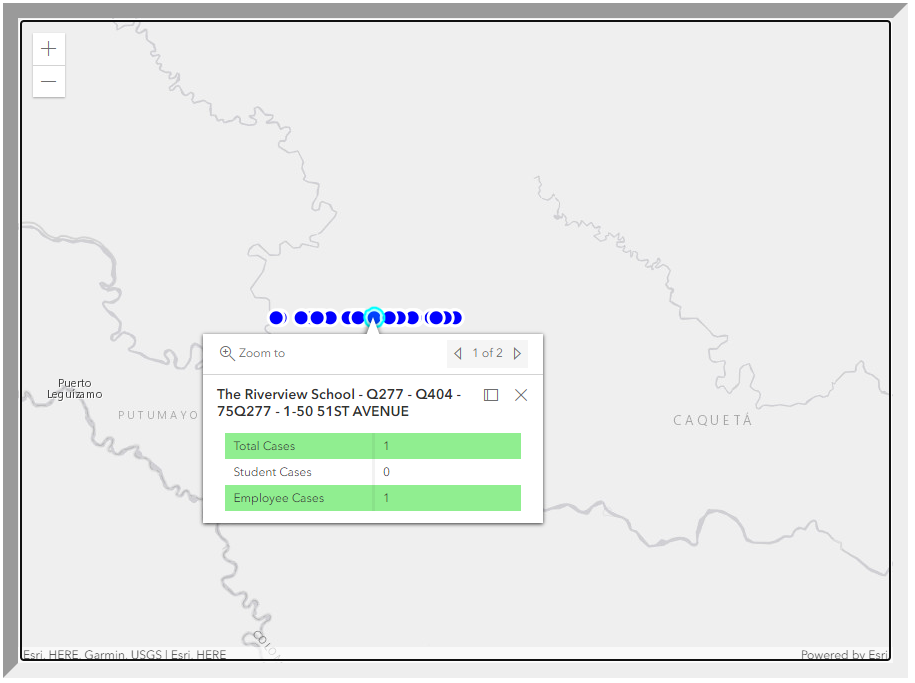
The error appears to be a problem with the dashboard’s geographical tagging, putting these schools in another continent instead of their correct NYC neighborhoods. But it’s a pretty big issue for parents and school staff who might be checking the map, looking for COVID-19 cases at their schools.
If these users didn’t know to zoom out and then scroll down a fair amount—which they probably wouldn’t, unless they got very creative or followed the right people on Twitter—they would think there were no cases. Which is far from the truth.
Over 1,400 schools have closed temporarily thus far in fall 2021, according to data collected by Burbio. Screenshot taken on September 11.
The COVID-19 Data Dispatch has, clearly, been pretty focused on school reopening in recent weeks. But our “Opening” project is primarily retrospective, looking back at schools that were successful last school year. This fall, the Delta variant and additional political pressures have made reopening success even harder to achieve.
With some schools now over a month into the fall semester—while others, like those in NYC, are finally starting class next week—let’s talk about how reopening has gone thus far.
Many schools in high-transmission areas have closed temporarily. “More than 1,400 schools across 278 districts in 35 states that began the academic year in person have closed,” writes U.S. News reporter Lauren Camera, citing data from the tracking organization Burbio. Due to out-of-control COVID-19 outbreaks, some districts switched temporarily to remote learning while others fully closed or delayed the start of class.
While that may seem striking, it’s just about 1.4% of the 98,000 public school districts in the U.S. And, as you can see from Burbio’s closure map, many of the districts that had to shut down are located in Southern states with limited COVID-19 safety protocols. In Texas, for example, over 70,000 K-12 students have tested positive for COVID-19 since the beginning of the fall semester, out of about 5.3 million total students. In the 2020-2021 school year, about 148,000 Texas students got COVID-19 in total. This is a pretty clear signifier of the increasing danger that Delta, combined with lower mask use in schools, may bring to classrooms.
The school districts that closed include Scott County School District 1, the subject of our first “Opening” profile. This Indiana district originally opened in August 2021 with no mask requirement; cases quickly climbed, leading the district to shift to virtual instruction for two weeks. When students returned to classrooms in late August, masks were required once again.
Schools with stricter COVID-19 precautions are faring better. Many of those school districts that start earlier in August are located in the South. From a news cycle perspective, that means we tend to hear about the schools that shut down due to outbreaks before we hear about the schools that aren’t seeing so much virus transmission.
For example: this past Thursday, San Francisco’s local health department announced that the city has not seen a single case of transmission at a public school. School started on August 17, giving officials about one month of data for the district’s over 50,000 students. Safety precautions in San Francisco schools include required masking, surveillance testing, ventilation updates, and mandatory vaccination for teachers and staff. Dr. Naveena Bobba, from the city public health department, additionally said that about 90% of residents in the 12 to 17 age group are fully vaccinated.
We’re starting to see vaccine mandates for students in addition to teachers and staff. Los Angeles Unified is now requiring vaccination for all eligible students, ages 12 and up. LA is the second-largest school district in the country, serving over 600,000 students—including 225,000 who are eligible for vaccination. The majority of those students are already vaccinated, according to the county public health department; the rest will have until October 31 to catch up.
LA’s school district follows many colleges and universities that have required vaccination and Culver City Unified, another California district that announced a student mandate in late August. As vaccination rates in the 12-17 age group tend to be low and parent hesitation tends to be high, student vaccination mandates likely won’t be as common as staff mandates. But I wouldn’t be surprised if we see more districts make this requirement.
Despite federal encouragement to provide regular COVID-19 testing, many schools aren’t doing it. The Biden administration “Path out of the Pandemic” plan focuses on COVID-19 testing, including a call for K-12 school districts to set up regular testing for unvaccinated students and staff. If all schools followed the CDC’s testing guidance, they’d be testing at least 10% of students, at least once a week. (This is, again, an area where many colleges and universities are already excelling.)
School districts have had months to tap into $10 billion set aside specifically for school testing in the American Rescue Plan. But many districts are still not testing, or are offering tests only to students who show COVID-19 symptoms or were recently in contact with a case. The nation’s largest school district (New York City) has even loosened its testing protocol from last year—shifting from mandatory testing for 20% of students and staff every week, to non-mandatory testing for 10% of unvaccinated students every other week. Some parents and staff are not happy about the change, saying that NYC should be testing more, not less.
The federal government is expanding school data collection, but still not counting cases. After Biden took office, the federal Department of Education started surveying schools on their pandemic protocols—asking whether schools were open online, in-person, or hybrid, how many students were choosing different options, and other similar questions. Survey data are made public on a federal dashboard, updated once a month; but the data are fairly incomplete, with numbers unavailable for about 20 states and all but ten individual districts.
Now, the federal DOE is expanding its survey efforts “by asking more questions about how students learn and what precautions schools take,” according to EdWeek. But if the DOE doesn’t also expand its survey to more school districts and states, it’s unclear how useful these data will be. And the federal government still isn’t tracking the most important metric here: actual case counts in schools!
While pediatric case counts soar, children are still at low risk for severe disease. As we see reports of record cases in children and overwhelmed pediatric ICUs, it is important to recognize that—tragic as these reports may be—the majority of kids who contract COVID-19 have mild cases.
An article from the German news site Spektrum der Wissenschaft, republished in Scientific American, helps to explain how children’s immune systems work to recognize the novel coronavirus and stop the virus from causing severe disease:
The immune system uses a special mechanism to protect children from novel viruses—and it typically saves them from a severe course of COVID-19 in two different ways. In the mucous membranes of their airways, it is much more active than that of adults. In children, this system reacts much faster to viruses that it has never encountered, such as pandemic pathogens. At least, that is what a recent study by Irina Lehmann of the Berlin Institute of Health at Charité and her colleagues suggests.
As children get older, the article explains, immune system resources are shifted from this innate response to a memory-based response; adults are thus more protected against viruses that they’ve encountered before.
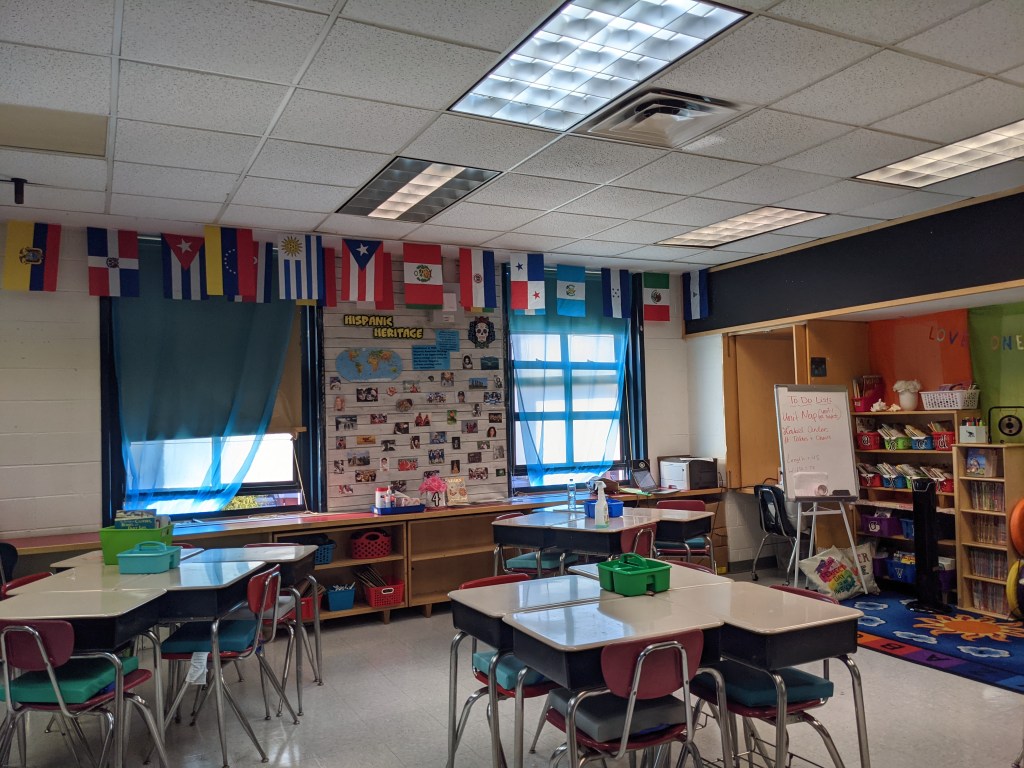
A fouth-grade classroom at P.S. 705, set up with desks in small clusters, windows open, and improved mechanical ventilation for fall 2021. Photo taken by Betsy Ladyzhets (COVID-19 Data Dispatch).
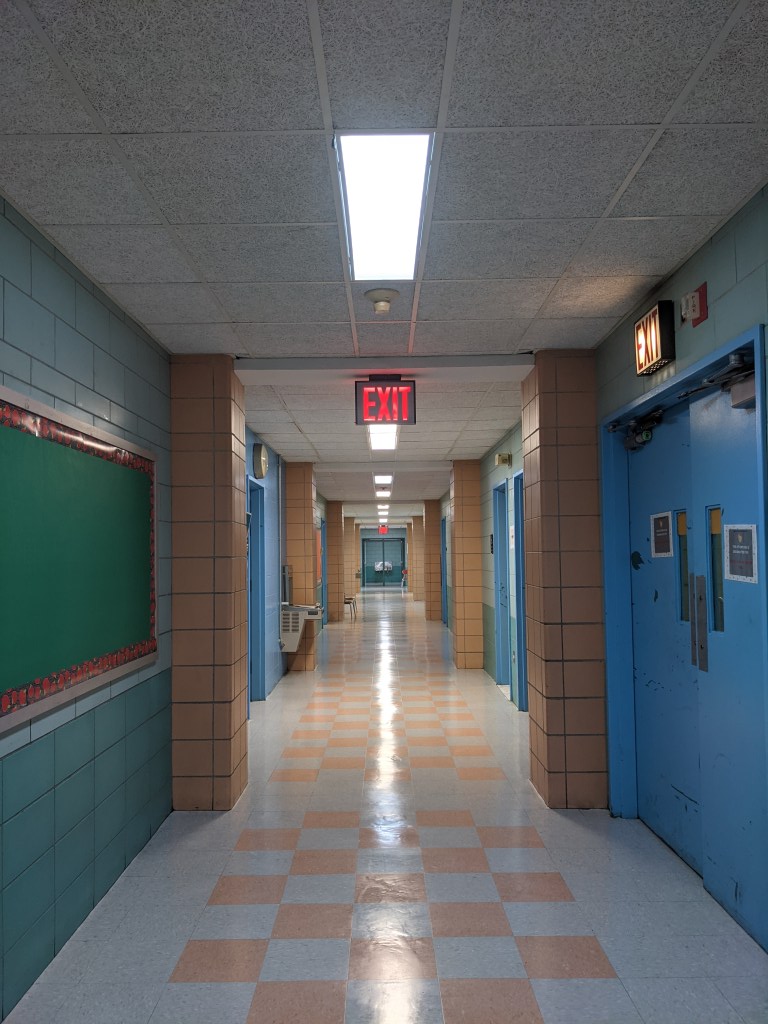
On the morning of Aug. 26, parents from Brooklyn Arts & Science Elementary School (or P.S. 705) flocked to the school for an open house ahead of the fall 2021 semester. Parents climbed up a flight of stairs — designated P.S. 705-only — to the second floor of a building in Crown Heights, Brooklyn. They walked down squeaky-clean hallways, toured classrooms with desks carefully spaced three feet apart, and heard the whir of newly-installed fans and portable ventilation units.
The event was live-streamed for those who couldn’t make it in person. About 100 parents attended the open house events online and in-person, Principal Valerie Macey estimated, representing around one-third of the school’s 308 students.
The school had already done “a lot of communication,” Macey said — so parents were familiar with safety protocols going into the open house, and questions focused on more typical school concerns such as homework policy. This past communication included weekly town hall meetings, virtual office hours, and individual calls to families.
P.S. 705 went above and beyond New York City school reopening guidance, with a particular reliance on the city’s surveillance testing program. This elementary school had 55% in-person enrollment by the end of the 2020-2021 school year, above the city’s average of about 40%, and made it through the year with just 11 total cases — and zero closures.
P.S. 705 is the subject of the final profile in the COVID-19 Data Dispatch’s “Opening” series. Alongside four other school communities, we selected it because the majority of the school’s students returned to in-person learning during the 2020-2021 school year — and city officials identified COVID-19 cases in under 5% of the student population. (According to the CDC, about 5% of school-aged children in the U.S. contracted COVID-19 between the start of the pandemic and early August 2021.)
As the other four school communities in this project are rural districts — following a trend in our data analysis, which primarily identified rural areas — we felt it was important to include a city school in the project. We additionally wanted to highlight New York State’s surveillance testing program, as it’s one of the few school testing programs with public data available. Plus, the COVID-19 Data Dispatch was able to visit this school in person, as this reporter (Betsy Ladyzhets) is based in Brooklyn.
Demographics for Brooklyn, New York1 Census population estimates, July 2019
Population: 2.6 million
Race: 36.8% white, 33.8% Black, 18.9% Hispanic/Latino, 12.7% Asian, 2.7% Two or more races, 0.9% Native American
Education: 82.4% have high school degree, 37.5% have bachelor’s degree
Income: $60,200 is median household income, 17.7% in poverty
Computer: 87.5% have a computer, 80.0% have broadband internet
Free lunch: 67.8% of students receive free or reduced-price lunch2
In-person enrollment: 55% at end of the school year
Total cases, 2020-2021 school year: 11 cases (8 among students, 3 among staff)
1We chose to include borough-level statistics here because the P.S. 705 school district does not clearly align with a specific ZIP code or another smaller geographic area within Brooklyn. 2Source: National Center for Education Statistics
Extensive parent communication
New York City, which has the largest public school district in the U.S., faced challenges with maintaining parent trust during the pandemic. In fall 2020, the city started offering hybrid learning, with cohorts of students returning to classrooms for two or three days a week. But only one in four students actually returned to classrooms by early November, according to the New York Times. In spring 2021, many schools were able to offer five days a week in-person, but most students still stayed home. Parents criticized NYC leaders for confusing communication; teachers protested unsafe conditions at their school buildings; and some staff, like those working with special education students, claimed the city’s plan left them behind.
At P.S. 705, more students returned to in-person learning (55%) than the city average (40%). School administrators made it a priority to provide parents with information and make themselves available for questions. This frequent communication was a major reason why parents felt safe sending their children back to classrooms, representatives from the Parent-Teacher Association (PTA) said in a group interview with administrators and other school staff.
Town halls — livestreamed to parents — are one hallmark of P.S. 705’s communication. After initial school-wide meetings, administrators devised a schedule in which the weekly town halls alternated between grade levels, in order to focus on concerns for specific age groups.
Takiesha Robinson, the PTA president, recalled that these meetings were well-attended; Principal Macey estimated that 30 to 40 parents typically joined the grade-specific events, accounting for the majority of the school’s 40 to 50 students in a grade. “The town halls [were] a very good open forum to let the parents know that you [the administrators] are listening, you do care, you are here,” she said. When parents provided feedback on something they felt wasn’t working, administrators responded quickly, Robinson said.
In addition to the town halls, P.S. 705 administrators staffed a “virtual main office” where parents could enter and ask additional questions. Each morning, administrators logged onto a virtual meeting which stayed live throughout the day. “Parents could come in and ask any questions when they needed,” said Melissa Graham, P.S. 705’s parent coordinator.
School staff also reached out to families proactively when they identified a potential need for support, such as after a student missed class. This school is located on the border of Crown Heights and Prospect Heights, both neighborhoods that were hard-hit by the pandemic: in the school’s ZIP code and in a neighboring ZIP code where families live, one out of every 11 people was diagnosed with COVID-19, according to NYC data.
At P.S. 705 itself, 41% of students are Black and 32% are Hispanic or Latino, two groups that saw disproportionately high COVID-19 hospitalizations and deaths in Brooklyn. Principal Macey explained that the staff wanted to know when students lost loved ones or went through other COVID-related struggles.
“The staff and administration went above and beyond to reach out to those families,” said Alison Gilles, PTA secretary. “[The pandemic] definitely hit our community really hard. But 705 is just the kind-of place where it is a ‘wrap your arms around the whole family’ kind-of a school.”
Surveillance testing
At P.S. 705, students get swabbed in the school auditorium. Students wait in socially-distanced seats before returning to class. Photo taken by Betsy Ladyzhets (COVID-19 Data Dispatch).
P.S. 705 utilized NYC’s COVID-19 testing program to identify cases before they turned into outbreaks. Starting in October 2020, the NYC Department of Education (DOE) required all schools open for in-person learning to test 20% of their on-site students and staff once a month. In December, as the winter COVID-19 surge grew, this requirement was increased to once a week.
Through partnerships between the city DOE and PCR testing labs, students and staff could get tested right at their school buildings, with results available in two to three days. At P.S. 705, students were tested in the school auditorium, one grade at a time: students filed in at one side of the room, got swabbed one by one, then waited in socially-distanced seats to return to class.
For this school, the city’s 20% requirement shook out to about 45 people. But P.S. 705 “over-volunteered for the testing,” according to DOE spokesperson Nathaniel Styer. Administrators realized that testing was a great tool to keep their classrooms safe and encouraged staff and students to get swabbed even when it wasn’t required.
“There were a lot of people apprehensive, initially, about being tested,” said Principal Macey. So, she, along with Graham (the parent coordinator) and Assistant Principal Kristen Pelekanakis, routinely got tested first so that students and staff could see how easy the process was. During the week of January 20, 2021, for example, over 150 staffers and students were tested—out of about 200 total people in the building.
!function(){“use strict”;window.addEventListener(“message”,(function(e){if(void 0!==e.data[“datawrapper-height”]){var t=document.querySelectorAll(“iframe”);for(var a in e.data[“datawrapper-height”])for(var r=0;r<t.length;r++){if(t[r].contentWindow===e.source)t[r].style.height=e.data["datawrapper-height"][a]+"px"}}}))}();
Just as young students got used to masks in Oregon, the Brooklyn students got used to swabs. Graham recalled: “I would come into the classroom with a clipboard, and I would have kids being like, ‘Take me! Take me! I’m getting tested this week!’”
In fact, Pelekanakis said that she and other administrators wished testing capacity was higher, so that they could test even more students. The majority of the school’s active cases were caught through random testing, she said; those students were asymptomatic and, she believed, likely wouldn’t have been identified as infected if not for P.S. 705 testing above their required level. The school saw a total of eight student cases and three staff cases all year — comprising just under 5% of the onsite students and staff.
The city’s testing requirement has become less stringent for fall 2021. Now, only 10% of unvaccinated students will be tested every other week, and students must opt in to the program rather than requiring testing for all. According to Principal Macey, all the students who attended in-person classes in spring 2021 had opted into the fall testing program as of early September; she plans on heavily promoting the program to the students who were remote last year through upcoming town halls and other communication.
Macey and the other staffers — who must be vaccinated with at least one dose by the end of September, per a city-wide mandate — aren’t required to participate in testing this fall. But Macey still intends to serve as an example for her students: “I’ll test, just because I want my kids to see,” she said.
Returning to one school community
NYC is heading into the fall 2021 semester with no remote option. At P.S. 705, this means more than 100 students who learned remotely for the entire 2020-2021 school year will be coming back to classrooms. Administrators are preparing with more parent communication (weekly town hall meetings and the late-August open house), while the DOE updates their building’s ventilation system.
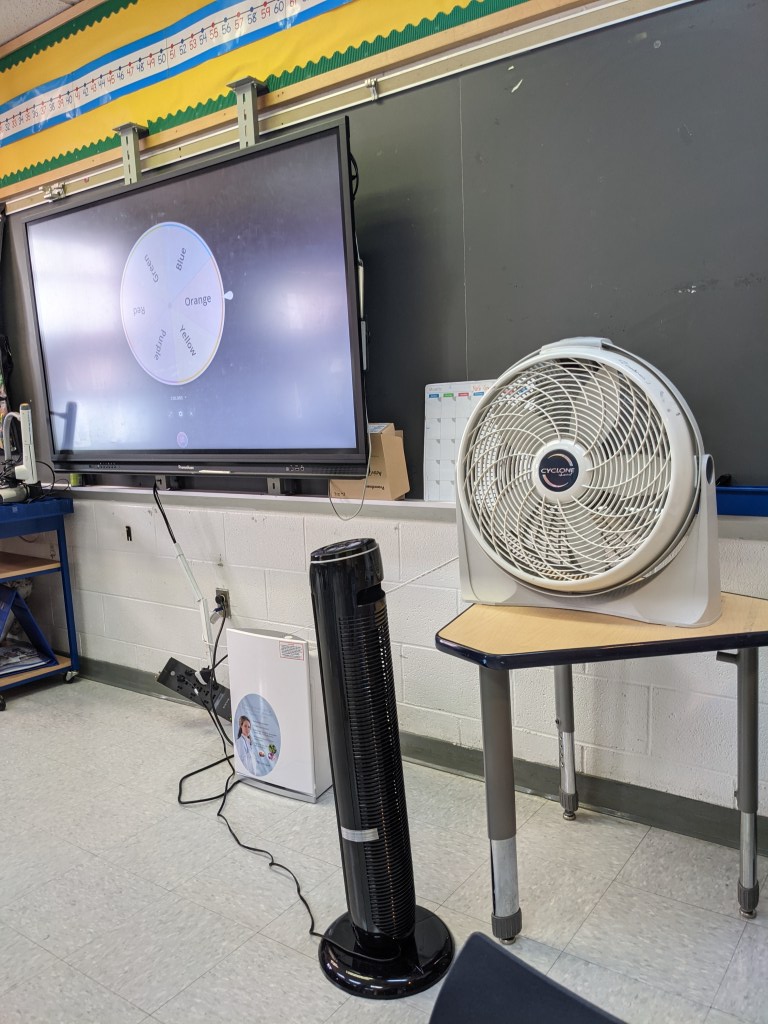
In addition to an upgraded mechanical ventilation system, P.S. 705 is utilizing open windows, fans, and portable air filtration units. The building also saw extensive cleaning this summer: Principal Macey wanted to see her face “shining in the floor” by the first day of class. Photos taken by Betsy Ladyzhets (COVID-19 Data Dispatch).
The COVID-19 Data Dispatch (CDD) visited P.S. 705 on Sept. 3, just ten days before classrooms open for the new school year. At that time, Principal Macey said the school just finished an overhaul of its HVAC system, updating ventilation throughout the building. The school also had external filtration units, fans, and windows open for additional airflow. In classrooms, desks are spaced three feet apart — down from six feet last year. And custodians are making the building look like new: During the CDD’s visit, Principal Macey told a custodian that she wants to see her face “shining in the floor” by the first day of school.
Summer renovations at P.S. 705 were extensive, according to reporting at Gothamist: In mid-August, “the building that houses Brooklyn Arts and Science Elementary School reported that all 40 of its classrooms were under repair.” At the time of publishing, just one classroom is still marked under repair by the DOE, while three rooms (two staff offices and a bathroom) have no mechanical ventilation.
At the Sept. 3 visit, administrators and teachers told the CDD that they were optimistic about the new school year. “The kids are really good with [keeping] their masks on,” said fourth-grade teacher Denise Garcia. She felt that, with similar protocols in place, the school could continue to have low case counts like the previous year.
This year’s first day of school will be far from typical. Principal Macey has planned for a big celebration, including outdoor activities, a literal red carpet, photo opportunities, and a moment of silence for loved ones lost in the pandemic.
“It can’t just be, ‘go inside, wash your hands,’” she said. “We have to get that space to just reconnect.” With continued communication and acknowledgement of the pandemic’s hardships, she intends to lead her school back into “one school community.”
The COVID-19 Data Dispatch’s “Opening” series is available for other publications to republish, free of charge. If you or your outlet is interested in publishing any part of this series, please contact betsy@coviddatadispatch.com.
It’s impossible to overstate how controversial school reopening has become in the U.S. this past year. After a spring of universal Zoom school, the country diverged: some administrators, parents, and scientists were determined to get kids back in classrooms, while others prioritized COVID-19 safety above all else.
Reopening debates have dominated headlines. In August 2020, images of maskless crowds in Georgia’s Cherokee County School District went viral on social media — and the school quarantined hundreds of students just one week after the semester started. That same month In New York City, teachers brought handmade coffins and a guillotine to a protest against Mayor Bill de Blasio’s reopening plan. Chicago’s schools remained closed through the fall, and the teachers union narrowly avoided a strike during reopening negotiations in early 2021. And districts like Brookline, a liberal Massachusetts suburb, saw parents who are health experts feud with teachers over social distancing, vaccinations, and more.
The divided communities made the news — but not all U.S. schools were fighting grounds. In fact, many districts managed to bring the majority of their students back into classrooms without breeding a dreaded COVID-19 outbreak.
Here, at the COVID-19 Data Dispatch, we’re sharing stories from five such communities. The series will be published in installments: one profile a week for the next five weeks, followed by a conclusion with overall insights and lessons for fall 2021.
This project fits into a school of reporting called “solutions journalism.” Rather than focusing on uncovering society’s problems, this type of journalism seeks to identify and uplift responses to these problems. In other words, instead of asking, “Why was it so hard to reopen schools in the U.S?”, the CDD is asking, “Which schools did reopen, and what made them successful?”The Solutions Journalism Network — which, as you may guess from the name, is a nonprofit that supports solutions journalism — provided the CDD with a grant to pursue this project, as well as trainings and other guidance.
Identifying districts that reopened
Before introducing you to the five districts that we profiled, let’s talk methodology, also known as how these districts were selected for the project. As we’ve discussed at length here at the CDD, there’s a lack of good data on COVID-19 cases in schools. The country is approaching a fourth pandemic semester, but the federal government still does not provide comprehensive information on how many students are attending public school in person or how many of them have contracted the virus. And while the majority of states provide some data on this topic, these data are scattered and unstandardized — and some states have even gotten worse at their reporting since the 2020-2021 school year ended.
So, to identify success stories for this project, we relied on two main sources. First, we used a database which tracks in-person attendance change at school districts across the country, covering approximately 94% of districts across 98% of U.S. counties. These data come from SafeGraph, a company that aggregates location data from cell phones; this database was also used in a March 2021 Nature paper on disparities in school closures. Using the SafeGraph data, we could see which districts had high in-person traffic numbers in spring 2021 compared to shutdowns during spring 2020, indicating that the majority of students returned.
It’s important to establish here that the aim of this data analysis was not to identify the districts that had the biggest in-person comebacks or to do any kind of comprehensive ranking. Instead, we looked for outliers: districts that had a larger attendance change than the schools around them.
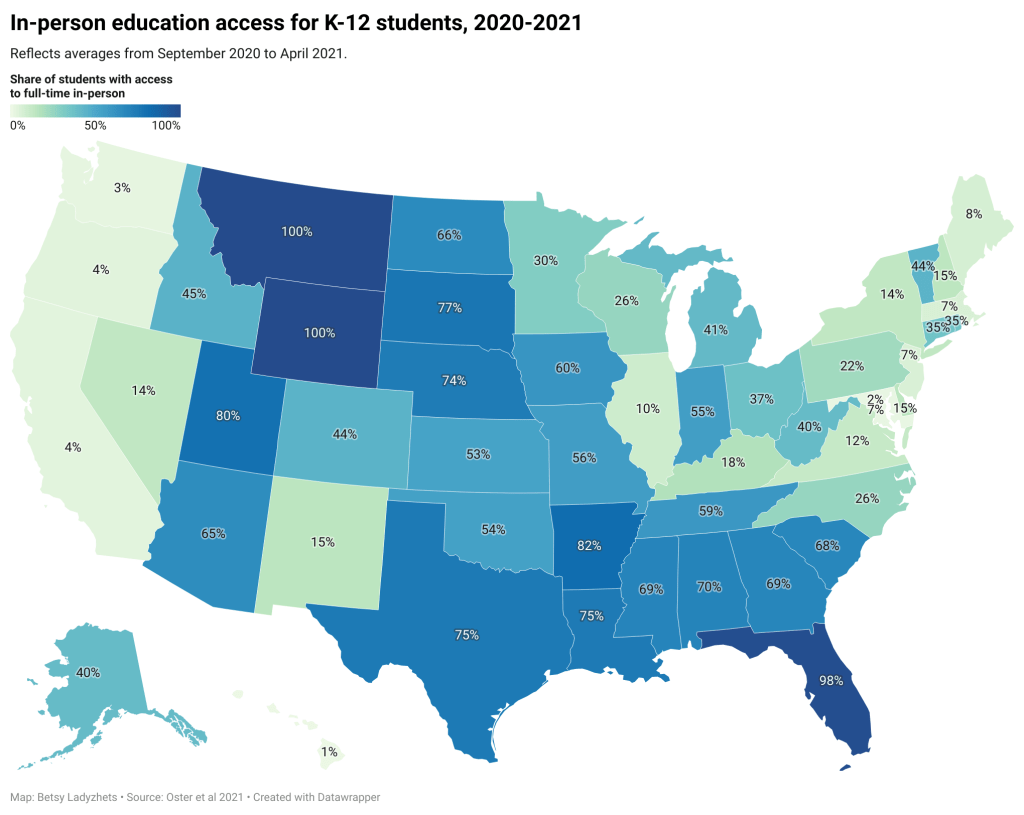
This geography-based method was important because the 2020-2021 school year looked very different from one state to the next. For example, in New York City, just over one-third of public school families attended school in-person before June 2021, per the New York Times. Meanwhile, in Texas, the majority of schools had at least 70% of students back in-person by spring 2021, according to data from the state department of health.
!function(){“use strict”;window.addEventListener(“message”,(function(e){if(void 0!==e.data[“datawrapper-height”]){var t=document.querySelectorAll(“iframe”);for(var a in e.data[“datawrapper-height”])for(var r=0;r<t.length;r++){if(t[r].contentWindow===e.source)t[r].style.height=e.data["datawrapper-height"][a]+"px"}}}))}();
You can see the variation in the map above, based on a study published in the Centers for Disease Control and Prevention’s Morbidity and Mortality Weekly Report earlier this summer. According to this analysis, every single student in Montana and Wyoming had access to in-person learning five days a week, between September 2020 and April 2021, while in Maryland, just 2.3% of students had that access during the same period.
Comparing COVID-19 case numbers
After using the SafeGraph dataset to identify outliers in a given state, we used data from state public health departments to identify districts’ COVID-19 case numbers. This step restricted the analysis to states that provided a.) COVID-19 case data by individual district and b.) data for the entire school year. Few states meet both of these criteria. It’s no coincidence that New York and Texas — also the only two states providing in-person enrollment numbers — are both represented among the five focus districts of this project.
!function(){“use strict”;window.addEventListener(“message”,(function(e){if(void 0!==e.data[“datawrapper-height”]){var t=document.querySelectorAll(“iframe”);for(var a in e.data[“datawrapper-height”])for(var r=0;r<t.length;r++){if(t[r].contentWindow===e.source)t[r].style.height=e.data["datawrapper-height"][a]+"px"}}}))}();
!function(){“use strict”;window.addEventListener(“message”,(function(e){if(void 0!==e.data[“datawrapper-height”]){var t=document.querySelectorAll(“iframe”);for(var a in e.data[“datawrapper-height”])for(var r=0;r<t.length;r++){if(t[r].contentWindow===e.source)t[r].style.height=e.data["datawrapper-height"][a]+"px"}}}))}();
Over the next few weeks, you’ll learn about how schools from rural Indiana to New York City faced the challenge of bringing kids back to classrooms while keeping their communities safe. Some took advantage of novel COVID-19 technologies, such as tests and ventilation updates. But others utilized less technical strategies such as personalized communication with parents and close collaboration with local public health officials.
As the Delta variant intensifies reopening challenges for this coming fall, the stories of these five communities tell us that virus cases can be kept down during in-person learning if administrators, teachers, and families all work together.
These schools are:
Scott County School District 1 in Austin, Indiana
Garrett County Public Schools in Garrett County, Maryland
Andrews Independent School District in Andrews, Texas
Brooklyn Arts and Science Elementary School in Brooklyn, New York
Port Orford-Langlois School District 2CJ in Curry County, Oregon
The COVID-19 Data Dispatch’s “Opening” series is available for other publications to republish, free of charge. If you or your outlet is interested in publishing any part of this series, please contact betsy@coviddatadispatch.com.
On November 18, New York City mayor Bill de Blasio announced that the city’s schools would close until further notice. The NYC schools discrepancy is indicative of an American education system that is still not collecting adequate data on how COVID-19 is impacting classrooms—much less using these data in a consistent manner.
Earlier this week, New York City mayor Bill de Blasio made a big announcement: all the city’s schoolchildren are going back to the classroom this fall. There will no longer be a remote option.
NYC was one of the first big cities to open with a hybrid model last fall, but it came with challenges—ranging from teachers protesting unsafe conditions, to in-person students doing “Zoom school” in the library, to closures dictated by confusing test positivity rates. The city’s choice to eliminate a remote option indicates a commitment to simple, unified policies for all students and teachers. It also suggests that many other districts may follow NYC’s lead—as the New York Times reported, a few districts already have.
Vaccine options for children ages 12 and older (now Pfizer, soon Moderna) make in-person education a safe bet for a lot of families. But younger students will likely have to wait much longer for their shots. As a result, regular testing will continue to be a key safety strategy, aided by American Rescue Plan funding dedicated specifically to school surveillance programs. Beyond identifying COVID-19 cases before they turn into outbreaks, testing can help parents and teachers feel safer about reopening plans.
But, as we have covered extensively here at the COVID-19 Data Dispatch, school testing data are incredibly hard to come by. New York continues to be the only state that reports any data on COVID-19 tests conducted in schools, and some states fail to even report COVID-19 school case counts.
Since Biden took office, more schools have returned to hybrid and in-person classes, but it remains unclear what percentage of school districts across the country are regularly screening students and teachers for Covid-19. An Education Department spokesperson said the department is “not tracking that level of detail.” A Centers for Disease Control and Prevention spokesperson said that “most states have offered or implemented testing programs in schools during the 2020-2021 school year,” adding that a survey conducted by the publication EdWeek in February found that just 16 percent of school district leaders said they were testing students.
Education and health groups — including the Association of State and Territorial Health Officials, the Rockefeller Foundation and American Federation of Teachers — also said they do not have comprehensive nationwide data on how many districts have testing programs in place.
This continued lack of data makes it difficult to evaluate how well school testing programs actually work. A lot of schools may be flying blind going into the fall 2021 semester, or they may choose not to set up regular testing at all.
I plan to do more reporting on this topic over the summer, including detailed investigations of individual school districts. If you have any burning questions, send them my way (betsy@coviddatadispatch.com).
On November 18, New York City mayor Bill de Blasio announced that the city’s schools would close until further notice. The NYC schools discrepancy is indicative of an American education system that is still not collecting adequate data on how COVID-19 is impacting classrooms—much less using these data in a consistent manner.
On November 18, New York City mayor Bill de Blasio announced that the city’s schools would close until further notice. Students returned to remote learning, while restaurants and bars remain open—even indoor dining is permitted.
This closure came because the city had passed a 3% positivity rate. 3% of all tests conducted in the city in the week leading up to November 18 had returned positive results, indicating to the NYC Department of Health and de Blasio that COVID-19 is spreading rampantly in the community. As a result—and as de Blasio had promised in September—the city’s schools had to close.
But that 3% value is less straightforward than it first appears. In closing schools, de Blasio cited data collected by the NYC Department of Health, which counts new test results on the day that they are collected. The state of New York, however, which controls dining bans and other restrictions, counts new test results on the day that they are reported. Here’s how Joseph Goldstein and Jesse McKinley explain this discrepancy in the New York Times:
So if an infected person goes to a clinic to have his nose swabbed on Monday, that sample is often delivered to a laboratory where it is tested. If those results are reported to the health authorities on Wednesday, the state and city would record it differently. The state would include it with Wednesday’s tally of new cases, while the city would add it to Monday’s column.
Also, the state reports tests in units of test encounters while the city (appears to) report in units of people. (See my September 6 issue for details on these unit differences.) Also, the state includes antigen tests in its count, while the city only includes PCR tests. These small differences in test reporting methodologies can make a sizeable dent in the day-to-day numbers. On the day that Goldstein and McKinley’s piece was published, for example, the city reported an average test positivity rate of 3.09% while the state reported a rate of 2.54% for the city.
Meanwhile, some public health experts have questioned why a test positivity rate would be even used in isolation. The CDC recommends using a combination of test positivity, new cases, and a school’s ability to mitigate virus spread through contact tracing and other efforts. But NYC became fixated on that 3% benchmark; when the benchmark was hit, the schools closed.
Overall, the NYC schools discrepancy is indicative of an American education system that is still not collecting adequate data on how COVID-19 is impacting classrooms—much less using these data in a consistent manner. Science Magazine’s Gretchen Vogel and Jennifer Couzin-Frankel describe how a lack of data has made it difficult for school administrators and public health researchers alike to see where outbreaks are occurring. Conflicting scientific evidence on how children transmit the coronavirus hasn’t helped, either.
Emily Oster, a Brown University economist whom I interviewed back in October, continues to run one of a few comprehensive data sources on COVID-19 in schools. Oster has faced criticism for her dashboard’s failure to include a diverse survey population and for speaking as an expert on school transmission when she doesn’t have a background in epidemiology. Still, CDC Director Robert Redfield recently cited this dashboard at a White House Coronavirus Task Force briefing—demonstrating the need for more complete and trustworthy data on the topic. The COVID Monitor, another volunteer dashboard led by former Florida official Rebekah Jones, covers over 240,000 K-12 schools but does not include testing or enrollment numbers.
For me, at least, the NYC schools discrepancy has been a reminder to get back on the schools beat. Next week, I will be conducting a review of every state’s COVID-19 school data—including which metrics are reported and what benchmarks the state uses to declare schools open or closed. If there are other specific questions you’d like me to consider, shoot me an email or let me know in the comments.
The CDC was busy last week. In addition to their vaccination playbook, the agency released indicators for COVID-19 in schools intended to help school administrators make decisions about the safety of in-person learning. The indicators provide a five-tier system, from “lowest risk of transmission” (under 5 cases per 100,000 people, under 3% test positivity) to “highest risk” (over 200 cases per 100,000 people, over 10% test positivity). It is unclear what utility these guidelines will have for the many school districts that have already started their fall semesters, but, uh, maybe New York City can use them?
Speaking of New York: the state’s dashboard on COVID-19 in schools that I described in last week’s issue is now live. Users can search for a specific school district, then view case and test numbers for that district’s students and staff. At least, they should be able to; many districts, including New York City, are not yet reporting data. (The NYC district page reports zeros for all values as of my sending this issue.)
Los Angeles Unified, the nation’s second-largest school district, is building its own dashboard, the Los Angeles Times reported last week. The district plans to open for in-person instruction in November or later, at which point all students and staff will be tested for COVID-19. Test results down to the classroom level will be available on a public dashboard.
Wisconsin journalists have stepped in to monitor COVID-19 outbreaks in schools, as the state has so far failed to report these data. A public dashboard available via the Milwaukee Journal Sentinel and the USA Today Network allows users to see case counts and resulting quarantine and cleaning actions at K-12 schools across the state. Wisconsin residents can submit additional cases through a Google form.
According to the COVID Monitor, states that report K-12 COVID-19 case counts now include: Arkansas, Hawaii, Kentucky, Louisiana, Mississippi, New Hampshire, Ohio, South Carolina, South Dakota, Tennessee, Texas, and Utah. Some of these state reports are far more precise than others; Texas and Utah, for example, both report only total case counts. The COVID Monitor reports over 10,000 COVID-19 confirmed cases in K-12 schools as of September 20, with another 17,000 reported cases pending.
A recent article in the Chronicle of Higher Education by Michael Vasquez explains common issues with reporting COVID-19 cases on college and university campuses: inconsistencies across school dashboards, administrations unwilling to report data, and other challenges.
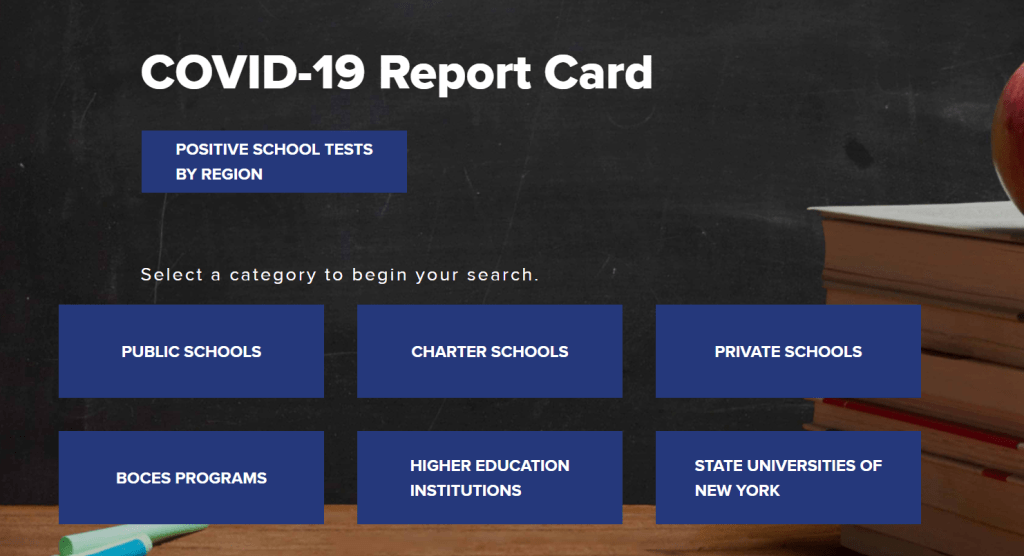
New York Governor Andrew Cuomo discussed this dashboard in his online briefing last Tuesday, September 8. (If you’d like to watch, start at about 18:00.) He explained that every school district is now required to report test and case numbers daily to New York’s Department of Health. Local public health departments and state labs performing testing are also required to report these numbers, so that the state department can cross-check against three different sources. Cases and tests will be published by school on the new dashboard, called the COVID Report Card.
In his briefing, Governor Cuomo showed a mockup of what the Report Card will look like. The available data includes positive cases by date, tests administered by the school (including test type, lab used, and test wait time), the school’s opening status (i.e. is it operating remotely, in person, or with a hybrid model), and the percentage of on-site students and staff who test positive.
This dataset promises to be much more complete than any other state’s reporting on COVID-19 in schools. But I haven’t been able to closely examine these data yet, because the dashboard has yet to come online.
According to reporting from Gothamist, state officials planned for the dashboard to begin showing data on September 9. As I send this newsletter on September 13, however, the dashboard provides only a message stating that the COVID Report Card will be live “when the reporting starts to come back.”
“The facts give people comfort,” Governor Cuomo said in his briefing. So, Governor, where are the facts? Where are the data? When will New York students, parents, and teachers be able to follow COVID-19 in their schools? My calls to Governor Cuomo’s office and the New York State Department of Health have as yet gone unanswered, and subsequent press releases have not issued updates on the status of these data.
I hope to return with an update on this dashboard next week. In the meantime, for a thorough look at why school COVID-19 data are so important and the barriers that such data collection has faced so far, I highly recommend this POLITICO feature by Biana Quilantan and Dan Goldberg.
Since last week’s issue, four more forms of official state reporting on COVID-19 in schools have come to my attention:
New Hampshire is publishing school-associated case data, including active cases, recovered cases, and outbreak status (not clearly defined) on a page of the state’s dashboard, updated daily.
Mississippi is publishing a weekly report on cases, quarantines, and outbreaks among students, teachers, and staff, aggregated by county. So far, the state has released reports on the weeks ending August 21 and August 28.
Hawaii’s state Department of Education is publishing a page on COVID-19 in the school district, updated weekly. (Did you know that the entire state of Hawaii is comprised of one school district?)
New York is launching a public dashboard on COVID-19 in schools; this dashboard will be available starting on September 9. So far, the page states that, “New York school districts will be required to provide the Department of Health with daily data on the number of people who have tested positive for COVID-19 beginning Tuesday, September 8th.” Last week, Mayor Bill de Blasio announced that classes in New York City would be delayed by two weeks to allow for more extensive safety precautions.
In addition, the nonprofit civic data initiative USAFacts has compiled a dataset of reopening plans in America’s 225 largest public school districts. The dataset classifies reopening plans as online, hybrid, in-person, or other, with information as of August 17.
Meanwhile, on the higher education front:
Education reporter (and friend of this newsletter!) Benjy Renton has launched a dashboard keeping track of COVID-19 outbreaks on college and university campuses. The dashboard organizes outbreaks according to their alert level, based on new cases in the past week.
I am continuing to monitor the COVID-19 metrics reported by college and university dashboards in my comparison spreadsheet. I haven’t had the chance to expand this analysis much in the past week, but it continues to be an ongoing project.