Tag: National numbers

  • National numbers, July 3

    National numbers, July 3

    New hospital admissions for COVID-19 increased 12% last week over the week prior, a signal of the continued surge. Chart via the CDC.

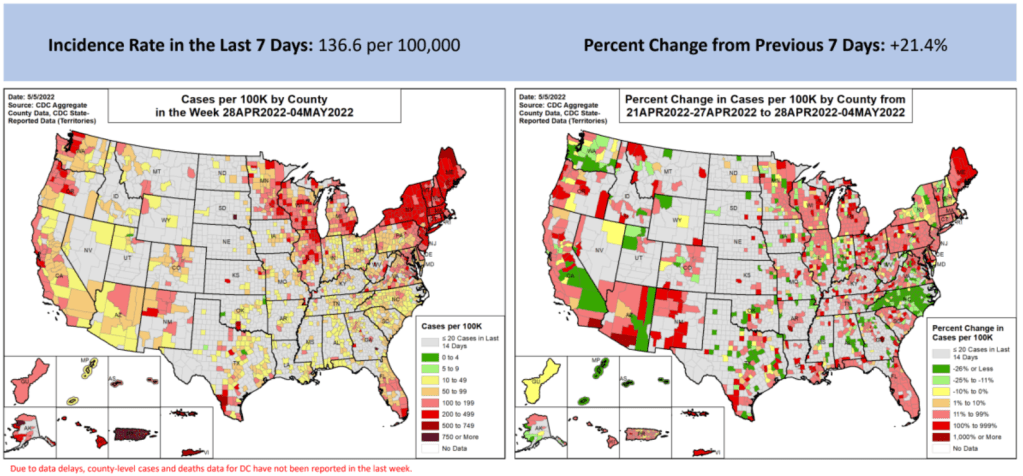
    In the past week (June 25 through July 1), the U.S. reported about 800,000 new COVID-19 cases, according to the CDC. This amounts to:

    • An average of 110,000 new cases each day
    • 234 total new cases for every 100,000 Americans
    • 11% more new cases than last week (June 18-24)

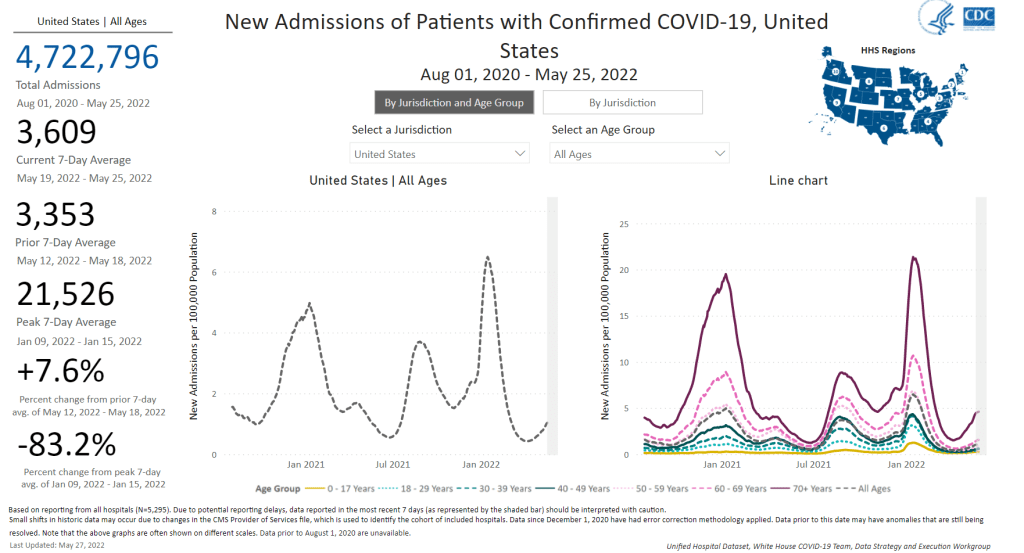
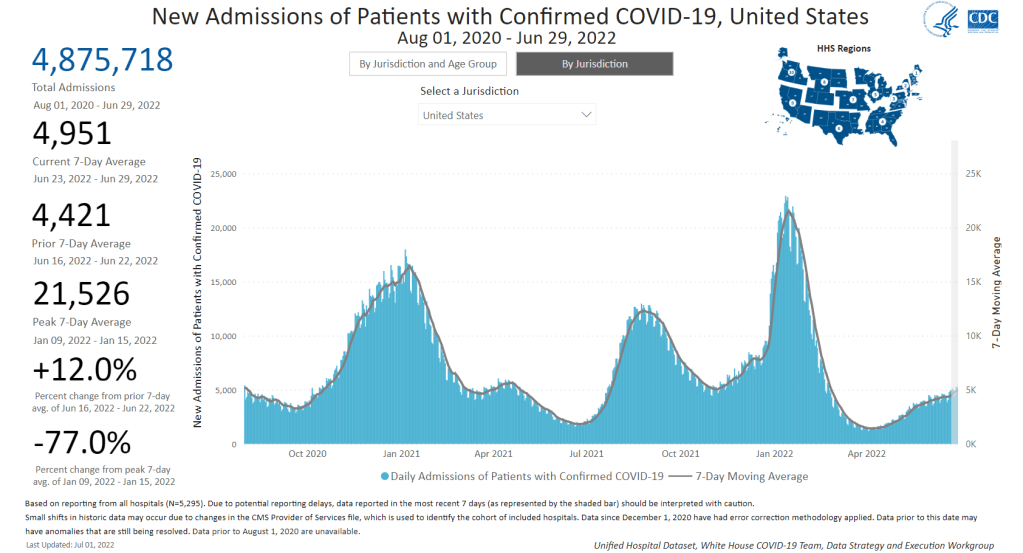
    In the past week, the U.S. also reported about 35,000 new COVID-19 patients admitted to hospitals. This amounts to:

    • An average of 5,000 new admissions each day
    • 10.6 total admissions for every 100,000 Americans
    • 12% more new admissions than last week

    Additionally, the U.S. reported:

    • 2,200 new COVID-19 deaths (0.7 for every 100,000 people)
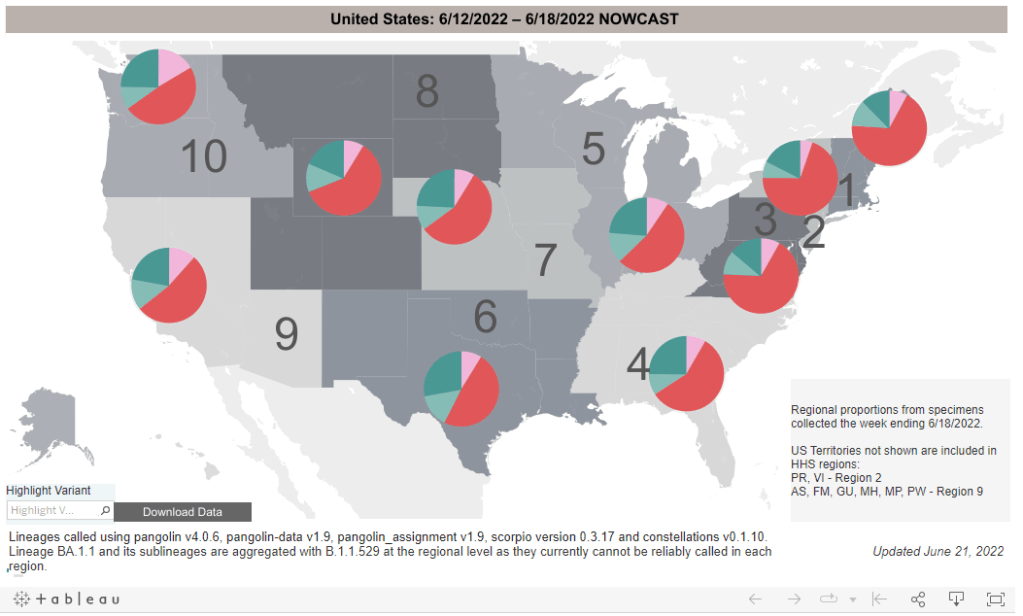
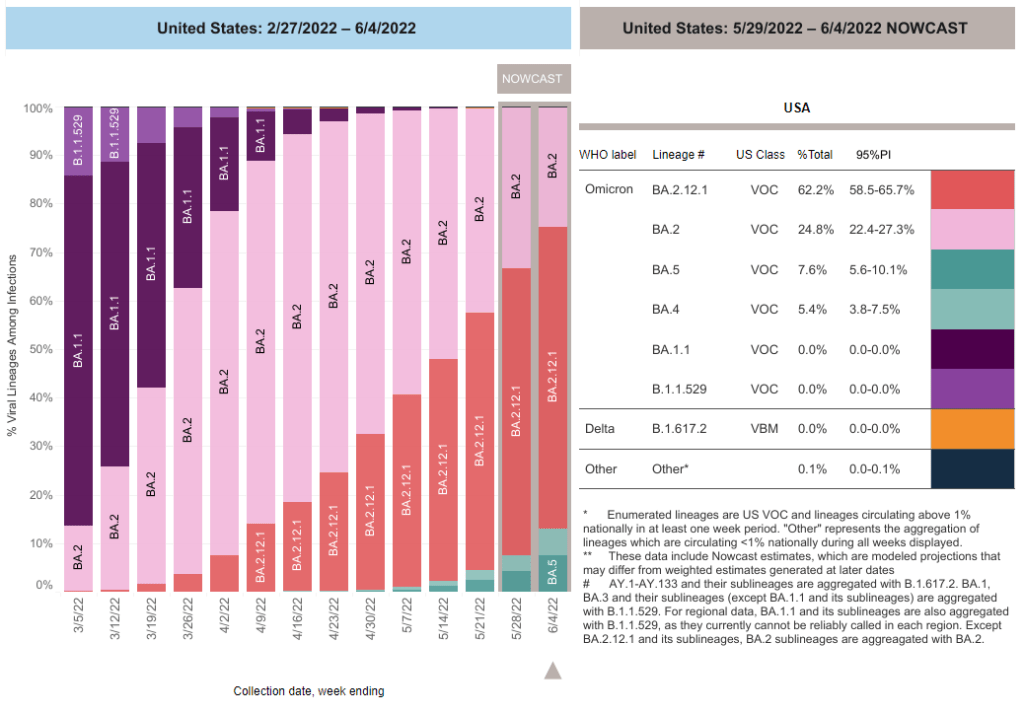
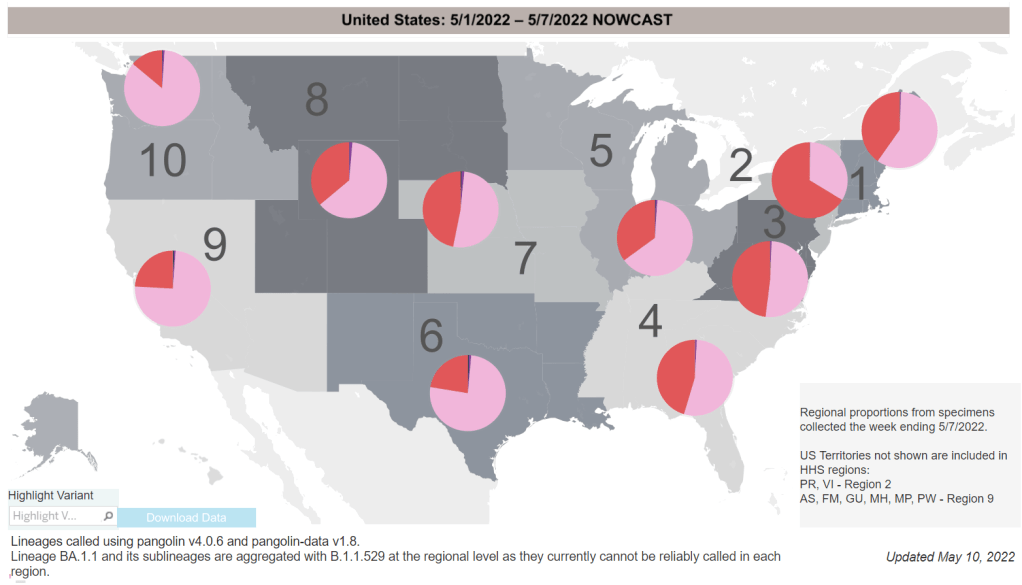
    • 48% of new cases are Omicron BA.2.12.1-caused; 52% BA.4/BA.5-caused (as of June 25)
    • An average of 150,000 vaccinations per day (per Bloomberg)

    BA.4 and BA.5 are now the dominant coronavirus lineages in the U.S., and they’re reviving our recent surge: from the plateau of recent weeks, national COVID-19 cases are clearly going up again. Reported cases rose 11% last week from the week prior. And, as always, this number is a significant undercount of true infections.

    New hospital admissions also went up last week: about 5,000 Americans were admitted to hospitals with COVID-19 each day, up 12% from the week prior. While the vast majority of COVID-19 cases may now be mild—thanks to vaccinations, prior infections, and treatments—this is a reminder that severe symptoms are still very possible.

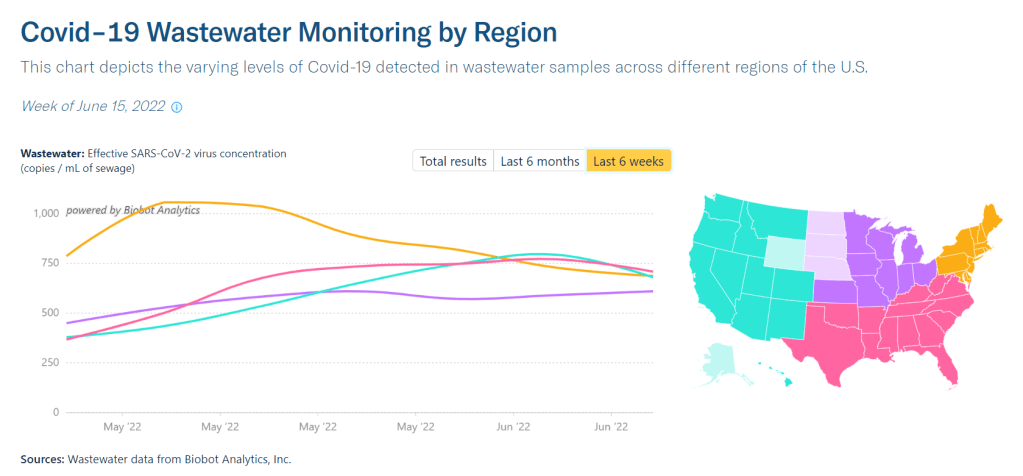
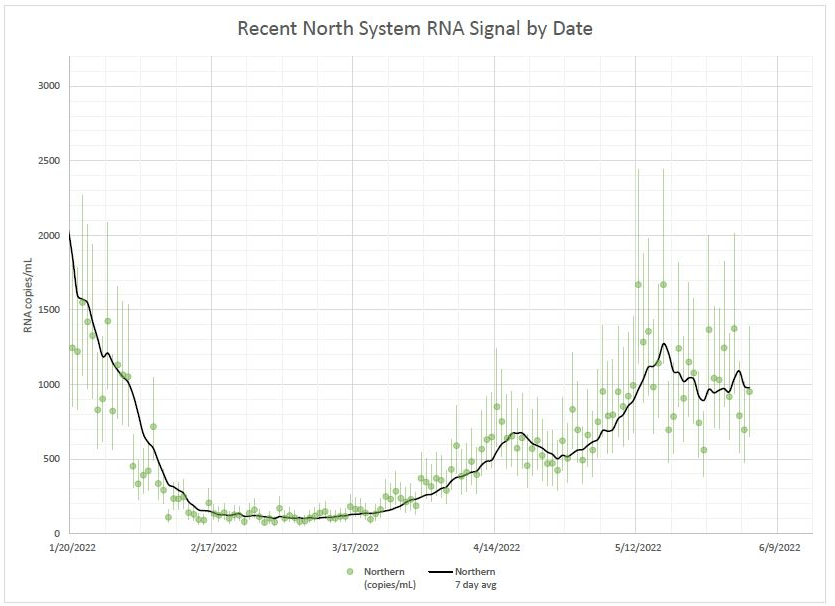
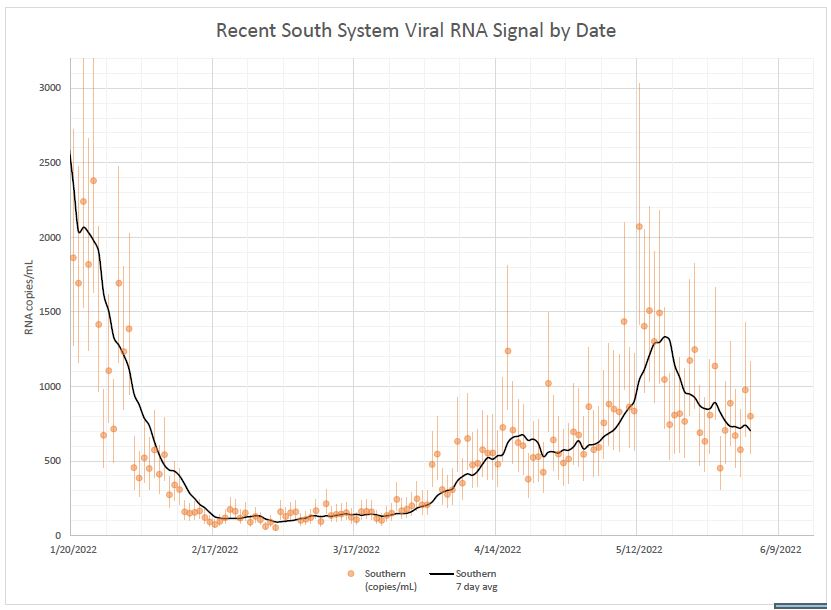
    Wastewater data from Biobot indicate a continued plateau in transmission at the national level. At the regional level, COVID-19 levels are trending down in the West and South, but ticking up again in the Northeast, likely as BA.4 and BA.5 take over from BA.2.12.1 in these areas.

    In my FAQ post last month ago, I wrote that scientists weren’t yet sure whether BA.4 and BA.5 would be able to outcompete BA.2.12.1, the offshoot of BA.2 first identified in New York. Now, it seems clear that BA.4 and BA.5 are capable of dominating: these two subvariants caused over half of new cases nationwide in the week ending June 25, as well as in most regions.

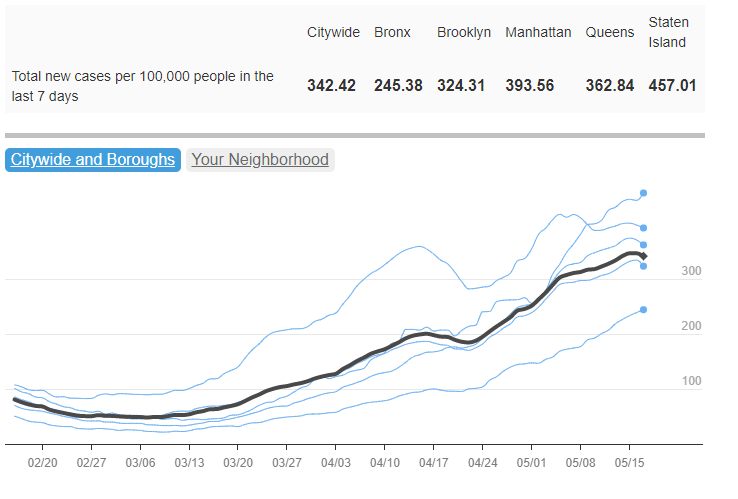
    Even places like New York City, which saw a major BA.2/BA.2.12.1 wave, is now reporting another uptick in cases, according to data from the local health department. The city’s test positivity rate went over 10% on Thursday for the first time since January, a signal of the underreporting in recent weeks as PCR testing becomes less popular. And yet, city leadership is not interested in implementing any new safety precautions.

    Remember, the problem with these subvariants is that they’re built for reinfection. Even if you had Omicron BA.1 in the winter, or even had BA.2 this spring, you could easily get BA.4 or BA.5. These infections are, at best, a week-long inconvenience, and at worst, could turn into Long COVID.

    The holiday tomorrow will interrupt COVID-19 reporting, as holidays always do. Stay safe this weekend, and don’t be fooled if you see a brief downturn in case numbers.

  • National numbers, June 26

    National numbers, June 26

    BA.4 and BA.5 (teal) are competing with BA.2.12.1 (red), with different lineages dominating in different parts of the country. CDC estimates reflect the week from June 12 to June 18.

    In the past week (June 18 through 24), the U.S. reported about 680,000 new COVID-19 cases, according to the CDC. This amounts to:

    • An average of 100,000 new cases each day
    • 208 total new cases for every 100,000 Americans
    • 6% fewer new cases than last week (June 11-17)

    In the past week, the U.S. also reported about 31,000 new COVID-19 patients admitted to hospitals. This amounts to:

    • An average of 4,400 new admissions each day
    • 9.3 total admissions for every 100,000 Americans
    • 1% more new admissions than last week

    Additionally, the U.S. reported:

    • 1,800 new COVID-19 deaths (0.5 for every 100,000 people)
    • 56% of new cases are Omicron BA.2.12.1-caused; 35% BA.4/BA.5-caused (as of June 18)
    • An average of 50,000 vaccinations per day (per Bloomberg)

    America’s Omicron subvariant surge continues to be in a plateau this week, with national COVID-19 case rates, hospitalization rates, and wastewater trends remaining fairly level or showing slight declines.

    The U.S. has reported a weekly average between 100,000 and 110,000 new cases a day since mid-May, according to the CDC. These numbers are massive undercounts, as about five times more rapid antigen tests are being conducted in the U.S. than PCR tests, so the true trend is difficult to discern—but we can safely say that there is a lot of coronavirus circulating throughout the country.

    New hospital admissions, the number of COVID-19 patients who sought treatment, rose slightly in the last week: about 4,400 patients were admitted each day nationwide, compared to 4,300 last week. Wastewater data from Biobot shows a national plateau, as coronavirus levels drop in the Northeast and West while rising in the South and remaining stagnant in the Midwest.

    Why this prolonged plateau? Most likely, the rise of immune-evading Omicron subvariants BA.4 and BA.5 is preventing a BA.2-initiated wave from truly dipping back down. Estimates from the CDC suggest that BA.4 and BA.5 may even be outcompeting BA.2.12.1: the share of U.S. cases caused by BA.2.12.1 dropped for the first time in the CDC’s latest variant prevalence update, from 63% in the week ending June 11 to 56% in the week ending June 18.

    Regions with a higher share of BA.4 and BA.5—namely, Gulf Coast states, the Midwest, and the West Coast—are also reporting case increases. A few state hotspots that stick out in the (admittedly, poor) official case counts: Hawaii, Florida, New Mexico, Alaska, and California all reported more than 250 new cases per 100,000 people in the week ending June 22.

    In the Northeast, BA.2.12.1 is still causing a majority of cases, but BA.4 and BA.5 are gaining some ground. This may explain why places like New York City are seeing case trends that simply refuse to go down as quickly as we’ve observed in past waves, though a lack of new safety measures is likely also playing a role.

    Meanwhile, vaccination rates remain the lowest they’ve been since late 2020. Fewer than 25,000 people received a first vaccine dose in the week ending June 21, according to the CDC. I was expecting to see a bump from children under five finally becoming eligible for vaccination, but it has not shown up in the data yet—likely another signal of current apathy towards COVID-19 safety.

  • National numbers, June 19

    National numbers, June 19

    The Omicron subvariants surge might be peaking, but it’s turning around slowly. Chart from Biobot, retrieved June 19.

    In the past week (June 11 through 17), the U.S. reported about 700,000 new COVID-19 cases, according to the CDC. This amounts to:

    • An average of 100,000 new cases each day
    • 215 total new cases for every 100,000 Americans
    • 8% fewer new cases than last week (June 4-10)

    In the past week, the U.S. also reported about 30,000 new COVID-19 patients admitted to hospitals. This amounts to:

    • An average of 4,300 new admissions each day
    • 9.2 total admissions for every 100,000 Americans
    • 5% more new admissions than last week

    Additionally, the U.S. reported:

    • 1,900 new COVID-19 deaths (0.6 for every 100,000 people)
    • 64% of new cases are Omicron BA.2.12.1-caused; 22% BA.4/BA.5-caused (as of June 11)
    • An average of 130,000 vaccinations per day (per Bloomberg)

    National COVID-19 cases appeared to plateau this week, as some parts of the country seem to have peaked in their Omicron subvariants wave while others are still reporting increasing transmission. The CDC reported an average of 100,000 cases each day—as always, this is a significant undercount of actual infections due to changing test availability.

    Major indicators are showing continued high transmission around the country. National cases have leveled off or slightly dipped, but the number of new COVID-19 patients admitted to hospitals increased by 5% compared to the prior week—continuing a trend of steady increases since early April. (Hospitalization trends usually lag case trends, but the increased unreliability in case reporting may have shifted this.)

    Wastewater surveillance also suggests that COVID-19 spread remains at high levels nationwide, with a very slight dip in the last week, according to Biobot’s tracker. The Northeast region is a couple of weeks past the point of its surge, at this point; data from individual Northeast cities like Boston, New York City, and New Haven, Connecticut back up this trend.

    West Coast, Midwest, and Southern states continue to report rising or plateauing transmission, according to Biobot. Wyoming, Nevada, Montana, and Utah reported the highest increases in official case counts this week (compared to the prior week), according to the June 16 Community Profile Report.

    Some of these Midwest and Southern states are also reporting high prevalences of BA.4 and BA.5, the latest (and, likely, most contagious) Omicron subvariants yet. The CDC estimates that these two lineages caused about 21% of new cases nationwide in the week ending June 11. But these data are always reported with a significant lag, suggesting that the true prevalence could be closer to 50%.

    As many of our local leaders, workplaces, and social circles continue to pretend that the pandemic is over—when we are actually facing one of the country’s biggest COVID-19 waves yet—remember that there are still options to protect yourself and your community. Safety measures like wearing a good mask, testing frequently, and gathering outdoors or in well-ventilated spaces are more important than ever.

  • National numbers, June 12

    National numbers, June 12

    Omicron BA.4 and BA.5 (shown here in teal) have been spreading rapidly in the U.S. in the last month. CDC data are as of June 4.

    In the past week (June 4 through June 10), the U.S. reported about 760,000 new COVID-19 cases, according to the CDC. This amounts to:

    • An average of 110,000 new cases each day
    • 233 total new cases for every 100,000 Americans
    • 8% more new cases than last week (May 28-June 3)

    In the past week, the U.S. also reported about 29,000 new COVID-19 patients admitted to hospitals. This amounts to:

    • An average of 4,100 new admissions each day
    • 8.8 total admissions for every 100,000 Americans
    • 8% more new admissions than last week

    Additionally, the U.S. reported:

    • 2,100 new COVID-19 deaths (0.7 for every 100,000 people)
    • 62% of new cases are Omicron BA.2.12.1-caused; 13% BA.4/BA.5-caused (as of June 4)
    • An average of 90,000 vaccinations per day (per Bloomberg)

    As I predicted last week, the brief dip in reported COVID-19 cases was a result of the Memorial Day holiday, not an actual signal of the BA.2/BA.2.12.1 wave reaching its peak. National case counts are up again this week, with the country still reporting over 100,000 new cases a day. And remember, the true infection rate could be five or more times higher, thanks to under-testing.

    Hospital admissions, a more reliable metric (less impacted by holiday interruptions) also went up this week. The number of Americans admitted to the hospital with COVID-19 has risen steadily each week since early April.

    Even as millions of people are protected from severe symptoms by vaccination or prior infection, many are still susceptible—whether they’re too young to be vaccinated or have not yet received booster shots for which they are eligible. Plus, the U.S. continues to have next to zero data on Long COVID cases, a debilitating, long-term condition that can impact even people who are fully vaccinated and boosted.

    Highly contagious Omicron subvariants continue to drive this surge. BA.2.12.1, the subvariant first identified in New York, is now causing almost two-thirds of cases nationwide, according to the CDC’s latest estimates. Meanwhile, the agency is finally listing separate estimates for BA.4 and BA.5, subvariants with greater capacity to reinfect people (even those who already had other versions of Omicron.)

    BA.4 and BA.5 caused about 13% of cases combined in the week ending June 4, and are spreading fast. These two subvariants are currently more prevalent in parts of the Midwest and South, while BA.2.12.1 is more dominant in the Northeast. This pattern might partially explain why the Northeast is seeing virus transmission decrease or plateau, while other regions report increases.

    Wastewater data from Biobot show a similar picture: a downward trend in the Northeast, offset by upward trends in the other regions. Cities like Boston and New York City are showing somewhat confusing signals right now, as Memorial Day travel and gatherings may have interrupted the decline.

    According to the CDC’s old community transmission levels (which are based on cases, not hospitalizations), about 96% of U.S. counties are currently reporting high transmission—and should recommend masking in public. But new mask requirements or other safety measures have been few and far between as this surge remains largely invisible.

  • National numbers, June 5

    National numbers, June 5

    In the past week (May 28 through June 3), the U.S. reported about 700,000 new COVID-19 cases, according to the CDC. This amounts to:

    • An average of 100,000 new cases each day
    • 215 total new cases for every 100,000 Americans
    • 9% fewer new cases than last week (May 21-27)

    In the past week, the U.S. also reported about 27,000 new COVID-19 patients admitted to hospitals. This amounts to:

    • An average of 3,800 new admissions each day
    • 8.1 total admissions for every 100,000 Americans
    • 5% more new admissions than last week

    Additionally, the U.S. reported:

    • 1,700 new COVID-19 deaths (0.5 for every 100,000 people)
    • 94% of new cases are Omicron BA.2-caused; 59% BA.2.12.1-caused (as of May 28)
    • An average of 70,000 vaccinations per day (per Bloomberg)

    The BA.2/BA.2.12.1 surge continues. According to the CDC, the number of new cases reported nationwide dropped last week, compared to the prior week; but this drop is more likely a result of the Memorial Day holiday than of an actual slowdown in transmission. (As I frequently note in these updates, holidays always result in case reporting dips as public health workers take time off.)

    Despite the holiday, the country reported over 100,000 new cases a day last week. And, of course, this is a massive undercount. A new preprint from researchers at the City University of New York suggests that actual coronavirus infections during the BA.2/BA.2.12.1 surge may be 30 times as high as reported case counts—and that’s in New York City, which has better PCR infrastructure than most. (More on this study later in the issue.)

    Unlike official case counts, the number of COVID-19 patients newly admitted to hospitals across the country rose last week: an average of 3,800 patients were admitted each day, a 5% increase from the prior week. Hospital admissions are more reliable than case counts, especially after a holiday, suggesting that we are indeed still on the upswing of this surge.

    Similarly, coronavirus levels in the country’s wastewater keep rising. Biobot’s dashboard shows a continued national increase, as well as increases in the Midwest, West, and South regions. In the Northeast, virus levels dipped last week and now appear to be at a plateau.

    Has the Northeast peaked? Optimistically, I would like to say yes, but a combination of spotty data and the Memorial Day holiday makes it tough to say for sure. In New York City, case rates dropped last week—but so did testing. In Boston, coronavirus concentrations in wastewater seem to be on a downturn—but the data are noisy.

    And even if the Northeast is coming out of its BA.2/BA.2.12.1 surge, the rest of the country is on the opposite side of the wave. Reported case numbers in Southern and Midwest states like Missouri, Wyoming, Alabama, Utah, Mississippi, and Texas shot up by over 20% last week, while Hawaii and Florida now have the highest reported case rates, according to the June 2 Community Profile Report.

    Even the CDC’s highly lenient Community Levels are beginning to light up yellow and orange, suggesting that counties from Florida to central California should reinstate indoor mask requirements. But are any leaders actually putting these measures in place? It seems unlikely, leaving the increasingly-smaller COVID-concerned minority to fend for ourselves.

  • National numbers, May 29

    National numbers, May 29

    It’s not all mild cases: new COVID-19 hospital admissions have been rising at a similar rate to cases in the last couple of weeks. Chart via the CDC.

    In the past week (May 21 through 27), the U.S. reported about 770,000 new COVID-19 cases, according to the CDC. This amounts to:

    • An average of 110,000 new cases each day
    • 234 total new cases for every 100,000 Americans
    • 8% more new cases than last week (May 14-20)

    In the past week, the U.S. also reported about 25,000 new COVID-19 patients admitted to hospitals. This amounts to:

    • An average of 3,600 new admissions each day
    • 7.7 total admissions for every 100,000 Americans
    • 8% more new admissions than last week

    Additionally, the U.S. reported:

    • 2,200 new COVID-19 deaths (0.7 for every 100,000 people)
    • 97% of new cases are Omicron BA.2-caused; 58% BA.2.12.1-caused (as of May 21)
    • An average of 70,000 vaccinations per day (per Bloomberg)

    America’s largely-ignored BA.2 surge continues: the U.S. reported over 100,000 new cases a day last week, while an average of 3,600 new COVID-19 patients were admitted to hospitals each day. Both of these metrics rose about 8% from the week prior.

    Of course, as I am frequently reminding everyone these days, current case numbers are a drastic undercount of actual infections, thanks to at-home testing and increasingly-fractured PCR access. Our current surge might actually be the country’s “second-largest wave of COVID-19 infections since the pandemic began,” Wall Street Journal reporter Josh Zumbrun wrote last week.

    The culprits for this wave of infections are BA.2 and its sublineage BA.2.12.1; the latter is now causing more than half of new cases in the U.S., according to CDC estimates. Northeast states, which have been BA.2.12.1 hotspots for a few weeks now, continue to report the highest case rates: these include Rhode Island, Delaware, New Jersey, Massachusetts, D.C., and New York.

    There are some promising signs that the BA.2 wave in these Northeast states may soon be on a downturn, if it isn’t already. Data from Biobot show that coronavirus levels in wastewater are dropping in this region, with reports from Boston and from Maine contributing to this pattern. New York City, where I live, has reported a case plateau for the last week or so, but I’m hopeful that it could turn into a downturn soon.

    But will this encouraging pattern in the Northeast withstand the holiday weekend of largely-unmasked travel and gatherings? It may be a couple of weeks before we know for sure, because the holiday will interrupt data reporting (as holidays always do). The CDC itself is taking a long weekend off, with no Weekly Review this past Friday and no data updates at all Saturday, Sunday, and Monday.

    Meanwhile, COVID-19 deaths—the most lagging pandemic metric—are going up once again. More than 300 Americans died of the disease each day last week, in a 13% increase from the week prior. These are the consequences of our country’s continued failure to protect the vulnerable.

  • National numbers, May 22

    National numbers, May 22

    After appearing to peak in mid-April, COVID-19 case rates in New York City began going up again as BA.2.12.1 took over. Chart from NYC Health.

    In the past week (May 14 through 20), the U.S. reported about 710,000 new COVID-19 cases, according to the CDC. This amounts to:

    • An average of 101,000 new cases each day
    • 216 total new cases for every 100,000 Americans
    • 19% more new cases than last week (May 7-13)

    In the past week, the U.S. also reported about 23,000 new COVID-19 patients admitted to hospitals. This amounts to:

    • An average of 3,300 new admissions each day
    • 6.9 total admissions for every 100,000 Americans
    • 24% more new admissions than last week

    Additionally, the U.S. reported:

    • 2,000 new COVID-19 deaths (0.6 for every 100,000 people)
    • 98% of new cases are Omicron BA.2-caused; 48% BA.2.12.1-caused (as of May 14)
    • An average of 140,000 vaccinations per day (per Bloomberg)

    The Omicron BA.2 surge continues in the U.S., with a 19% increase in officially-reported COVID-19 cases in the past week to over 100,000 new cases a day. Of course, the official case numbers severely underestimate true infections, as PCR testing sites close and more people use rapid tests; actual case counts may be five or more times higher.

    New hospital admissions are also increasing: about 23,000 COVID-19 patients were admitted for care nationwide last week, up from 11,000 one month ago. While millions of Americans have some protection against severe disease from vaccination and/or prior Omicron infections, many are still susceptible. Hospitals are beginning to fill up again in almost every state, and as Ed Yong points out, the numbers don’t capture continued burnout among healthcare workers.

    BA.2.12.1, the most transmissible version of Omicron BA.2 now spreading in the U.S., accounted for almost half of new cases in the week ending May 14, according to CDC estimates. Northeast states remain hotspots: BA.2.12.1 caused about three in four new cases in New York and New Jersey last week.

    One thing I’ve been wondering, in recent weeks, is when we might see cases peak in the Northeast. In New York City, where I live, case trends seemed to turn downward in mid-April; but then after about a week, the numbers went up again — perhaps a consequence of BA.2.12.1 taking over from BA.2.

    COVID-19 trends from wastewater surveillance for the Northeast look similar to the case trends in NYC: a slow increase through March and April, followed by a potential plateau or further increases in May.

    And other regions are catching up, according to Biobot’s tracker: states in the Midwest and South continue to see their coronavirus levels increase as the Northeast stagnates. Official case data from the latest Community Profile Report suggest that states such as Nebraska, Montana, Missouri, Kansas, and Kentucky reported the sharpest increases over the last week.

    One piece of good news: new COVID-19 vaccinations rose slightly over the last week, going above 100,000 new shots administered daily for the first time in several months. Second booster shots in older adults and those with severe medical conditions are likely driving this increase, though, rather than shots for the previously unvaccinated.

    As local leaders like NYC mayor Eric Adams refuse to institute new mask mandates and the country overall seems apathetic to this COVID-19 surge, it’s unclear how long we’ll be dealing with these Omciron subvariants — or how much we’ll invite the virus to keep mutating.

  • National numbers, May 15

    National numbers, May 15

    Omicron BA.2.12.1 (shown here in red) is taking over from BA.2 (pink) in much of the country, with the Northeast in the lead. Chart via the CDC, data as of May 7.

    In the past week (May 7 through 13), the U.S. reported about 590,000 new COVID-19 cases, according to the CDC. This amounts to:

    • An average of 85,000 new cases each day
    • 181 total new cases for every 100,000 Americans
    • 31% more new cases than last week (April 30-May 6)

    In the past week, the U.S. also reported about 18,000 new COVID-19 patients admitted to hospitals. This amounts to:

    • An average of 2,600 new admissions each day
    • 5.6 total admissions for every 100,000 Americans
    • 18% more new admissions than last week

    Additionally, the U.S. reported:

    • 1,900 new COVID-19 deaths (0.6 for every 100,000 people)
    • 99% of new cases are Omicron BA.2-caused; 43% BA.2.12.1-caused (as of May 7)
    • An average of 80,000 vaccinations per day (per Bloomberg)

    New COVID-19 cases continue to rise in the U.S., with an average of 85,000 cases reported nationally each day last week—double the daily average from three weeks ago. This is a significant undercount, of course, as the majority of COVID-19 tests conducted these days are done at home.

    The country is also reporting more COVID-19 patients admitted to hospitals: about 18,400 people were admitted last week, an 18% increase from the prior week. While this is far lower than the numbers reported during the peak of the Omicron wave (and includes some incidental hospitalizations), it’s still a concerning signal: even as immunity from prior vaccinations and infections protects many Americans from severe disease, plenty of people remain vulnerable.

    This current increase is largely driven by the Omicron subvariant BA.2 and its offshoot BA.2.12.1, which is the most transmissible version of this lineage yet. BA.2.12.1 caused about 43% of new cases nationwide in the week ending May 7, according to CDC estimates; in parts of the Northeast, Midwest, and South, that ratio is over 50%.

    The Northeast, which has the most BA.2.12.1, also continues to report the highest coronavirus levels in wastewater regionally, according to Biobot. After a potential plateau in recent weeks, the Northeast is now continuing to show a clear uptick; wastewater data from other parts of the country also indicate a slow increase in coronavirus transmission.

    The CDC’s wastewater data somewhat reaffirm these trends, but are currently difficult to interpret as a number of sites have gone offline recently. (More on that later in the issue.)

    States with the highest COVID-19 case rates continue to include Northeast states: Rhode Island, Massachusetts, New York, Maine, Vermont, New Jersey, and Washington, D.C. But some Midwest states (Illinois, Michigan, Wisconsin) as well as Hawaii are also reporting over 250 new cases per 100,000 people in the last week, showing how this BA.2 surge is spreading to other regions.

    If you look at the CDC’s Community Level guidance, you may think that, even if you live in one of these surging Northeast states, you can go out in public without a mask. But other metrics, such as the agency’s old Community Transmission levels (which are based more on cases than hospitalizations), suggest otherwise.

    In short: if you want to protect yourself and others in your community, especially if you live in the Northeast, now is a good time to mask up, test often, and avoid large indoor gatherings.

  • National numbers, May 8

    National numbers, May 8

    These maps from the May 5 Community Profile Report look pretty different from the CDC’s all-green “Community Levels” map, huh?

    In the past week (April 30 through May 6), the U.S. reported about 450,000 new COVID-19 cases, according to the CDC. This amounts to:

    • An average of 65,000 new cases each day
    • 138 total new cases for every 100,000 Americans
    • 21% more new cases than last week (April 23-29)

    In the past week, the U.S. also reported about 16,000 new COVID-19 patients admitted to hospitals. This amounts to:

    • An average of 2,200 new admissions each day
    • 4.7 total admissions for every 100,000 Americans
    • 17% more new admissions than last week

    Additionally, the U.S. reported:

    • 2,300 new COVID-19 deaths (0.7 for every 100,000 people)
    • 98% of new cases are Omicron BA.2-caused; 37% BA.2.12.1-caused (as of April 30)
    • An average of 70,000 vaccinations per day (per Bloomberg)

    New COVID-19 cases are still rising in the U.S., as the country continues to face the Omicron subvariant BA.2 and its offshoots. While at levels much lower than what we saw in December and January, daily new cases have more than doubled in the last month.

    And, as I frequently note these days, case numbers are capturing a small fraction of actual COVID-19 infections, as PCR testing becomes less available and at-home rapid tests become more popular. Hospital admissions, a more reliable metric, have also shot up in recent weeks, with about 50% more COVID-19 patients admitted to U.S. hospitals last week than in the first week of April.

    Wastewater data suggest that COVID-19 transmission nationwide may be increasing slightly or in a plateau, far from the kind of exponential increase we saw during the first Omicron surge. Biobot’s dashboard shows that coronavirus levels in wastewater in the Northeast, South, and Midwest continue to increase slightly, while in the West, virus levels have shifted back down in the most recent week of data.

    The CDC’s wastewater dashboard similarly suggests that fewer parts of the country are seeing major coronavirus upticks than the national system reported a couple of weeks ago. But this dashboard is a bit incomplete at the moment, with hundreds of sites reporting no recent data, so I take that finding with a grain of salt.

    Northeast states continue to report the highest case rates, according to the May 5 Community Profile Report. Maine, Rhode Island, Vermont, Massachusetts, Hawaii, New York, New Jersey, Illinois, New Hampshire, and Connecticut all reported more than 200 new cases for every 100,000 residents in the last week, passing the CDC threshold for a medium “Community Level” (or, under the agency’s old guidance, more than double the threshold for high transmission).

    The BA.2 subvariant is now causing almost 100% of new COVID-19 cases in the country, according to CDC estimates, with the even-more-contagious BA.2.12.1 sub-subvariant causing about one in three of those cases. In the coming weeks, we’ll see how well protection from vaccines and recent Omicron BA.1 infections holds up against these more-transmissible versions of the virus.

  • National numbers, May 1

    National numbers, May 1

    On the left, the CDC’s current Community Levels indicate that 90% of the U.S. is in a “low risk” region. On the right, the CDC’s old Transmission Levels indicate that only 15% of the country is in a “low risk” region.

    In the past week (April 23 through 29), the U.S. reported about 370,000 new COVID-19 cases, according to the CDC. This amounts to:

    • An average of 53,000 new cases each day
    • 113 total new cases for every 100,000 Americans
    • 25% more new cases than last week (April 16-22)

    In the past week, the U.S. also reported about 13,000 new COVID-19 patients admitted to hospitals. This amounts to:

    • An average of 1,900 new admissions each day
    • 4.0 total admissions for every 100,000 Americans
    • 19% more new admissions than last week

    Additionally, the U.S. reported:

    • 2,300 new COVID-19 deaths (0.7 for every 100,000 people)
    • 97% of new cases are Omicron BA.2-caused; 29% BA.2.12.1-caused (as of April 23)
    • An average of 80,000 vaccinations per day (per Bloomberg)

    Nationwide, new COVID-19 cases have increased in the U.S. for the fourth week in a row. The daily case average has doubled since early April, and that’s just the cases that we’re reporting; with less PCR testing availability and more people using at-home tests, we have very limited visibility into this current uptick.

    New hospital admissions, a more reliable metric than cases, have also continued to rise this week. U.S. hospitals reported about 13,200 COVID-19 patients admitted this week, up from under 10,000 in the first week of April.

    Wastewater data similarly continue to indicate increased coronavirus spread. The Northeast is still in a high plateau, according to Biobot’s dashboard, while other parts of the country are reporting upticks.

    This mirrors the reported case data: Northeast states Vermont, Rhode Island, New York, and Massachusetts reported the highest case rates in the week ending April 27, according to the latest Community Profile Report. But states in the South and West, such as North Carolina and Nebraska, reported the sharpest increases.

    Almost one-third of new cases were caused by the BA.2.12.1 subvariant in the week ending April 23, according to the CDC’s latest estimates. This version of Omicron, first identified by the New York state health department, is even more transmissible than BA.2. It’s causing more than half of cases in the New York and New Jersey region, the CDC estimates.

    Despite all of these concerning signals, the vast majority of the country seems unaware that we are in a new COVID-19 spike. Indeed, I’m writing this from the plane back to New York City, on which I’m one of few mask-wearers.

    And I can’t really blame my fellow travelers for their lack of awareness: if you just look at the CDC’s Community Level map—as the agency recommends people do—you’d think that the whole country is in a green, low-risk zone. The agency’s old guidance, with more stringent, case-based thresholds, paints a very different picture.

    The U.S. has “reached the choose-your-own-adventure stage of the pandemic,” as Maryn McKenna put it in a recent WIRED article. We’re taking “individual responsibility” to a whole new level.