In the past week (May 28 through June 3), the U.S. reported about 700,000 new COVID-19 cases, according to the CDC. This amounts to:
- An average of 100,000 new cases each day
- 215 total new cases for every 100,000 Americans
- 9% fewer new cases than last week (May 21-27)
In the past week, the U.S. also reported about 27,000 new COVID-19 patients admitted to hospitals. This amounts to:
- An average of 3,800 new admissions each day
- 8.1 total admissions for every 100,000 Americans
- 5% more new admissions than last week
Additionally, the U.S. reported:
- 1,700 new COVID-19 deaths (0.5 for every 100,000 people)
- 94% of new cases are Omicron BA.2-caused; 59% BA.2.12.1-caused (as of May 28)
- An average of 70,000 vaccinations per day (per Bloomberg)
The BA.2/BA.2.12.1 surge continues. According to the CDC, the number of new cases reported nationwide dropped last week, compared to the prior week; but this drop is more likely a result of the Memorial Day holiday than of an actual slowdown in transmission. (As I frequently note in these updates, holidays always result in case reporting dips as public health workers take time off.)
Despite the holiday, the country reported over 100,000 new cases a day last week. And, of course, this is a massive undercount. A new preprint from researchers at the City University of New York suggests that actual coronavirus infections during the BA.2/BA.2.12.1 surge may be 30 times as high as reported case counts—and that’s in New York City, which has better PCR infrastructure than most. (More on this study later in the issue.)
Unlike official case counts, the number of COVID-19 patients newly admitted to hospitals across the country rose last week: an average of 3,800 patients were admitted each day, a 5% increase from the prior week. Hospital admissions are more reliable than case counts, especially after a holiday, suggesting that we are indeed still on the upswing of this surge.
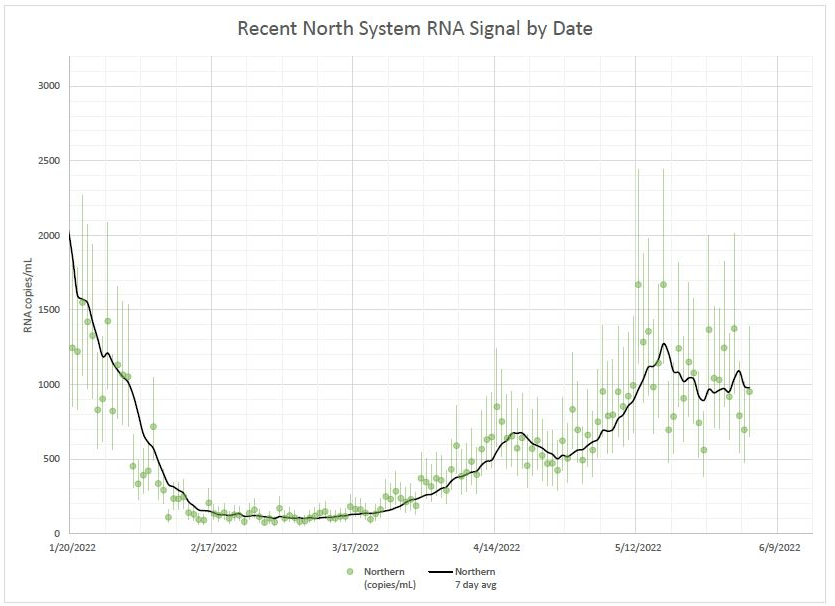
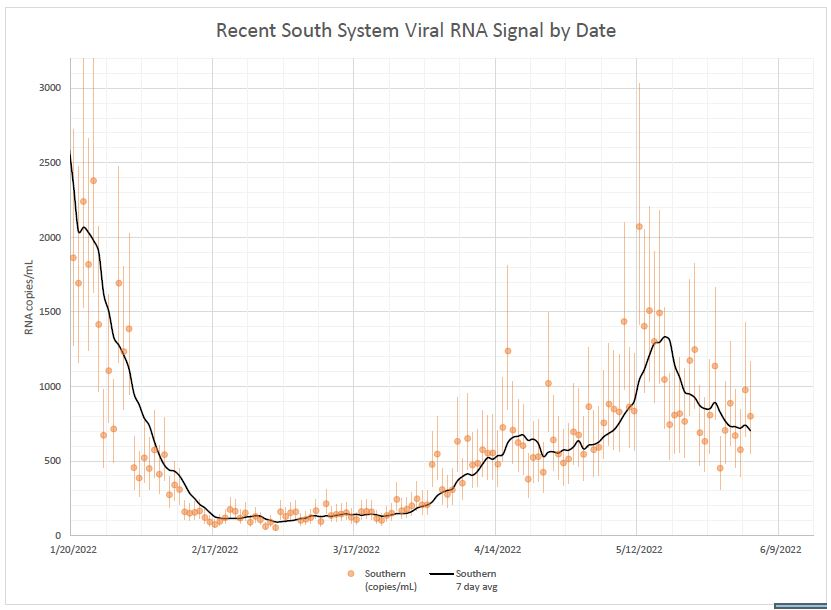
Similarly, coronavirus levels in the country’s wastewater keep rising. Biobot’s dashboard shows a continued national increase, as well as increases in the Midwest, West, and South regions. In the Northeast, virus levels dipped last week and now appear to be at a plateau.
Has the Northeast peaked? Optimistically, I would like to say yes, but a combination of spotty data and the Memorial Day holiday makes it tough to say for sure. In New York City, case rates dropped last week—but so did testing. In Boston, coronavirus concentrations in wastewater seem to be on a downturn—but the data are noisy.
And even if the Northeast is coming out of its BA.2/BA.2.12.1 surge, the rest of the country is on the opposite side of the wave. Reported case numbers in Southern and Midwest states like Missouri, Wyoming, Alabama, Utah, Mississippi, and Texas shot up by over 20% last week, while Hawaii and Florida now have the highest reported case rates, according to the June 2 Community Profile Report.
Even the CDC’s highly lenient Community Levels are beginning to light up yellow and orange, suggesting that counties from Florida to central California should reinstate indoor mask requirements. But are any leaders actually putting these measures in place? It seems unlikely, leaving the increasingly-smaller COVID-concerned minority to fend for ourselves.

Leave a comment