
In the past week (April 30 through May 6), the U.S. reported about 450,000 new COVID-19 cases, according to the CDC. This amounts to:
- An average of 65,000 new cases each day
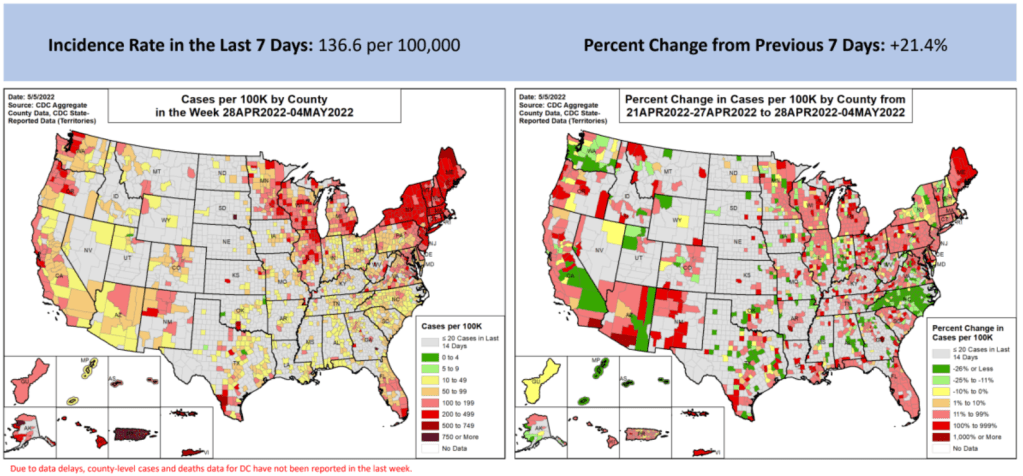
- 138 total new cases for every 100,000 Americans
- 21% more new cases than last week (April 23-29)
In the past week, the U.S. also reported about 16,000 new COVID-19 patients admitted to hospitals. This amounts to:
- An average of 2,200 new admissions each day
- 4.7 total admissions for every 100,000 Americans
- 17% more new admissions than last week
Additionally, the U.S. reported:
- 2,300 new COVID-19 deaths (0.7 for every 100,000 people)
- 98% of new cases are Omicron BA.2-caused; 37% BA.2.12.1-caused (as of April 30)
- An average of 70,000 vaccinations per day (per Bloomberg)
New COVID-19 cases are still rising in the U.S., as the country continues to face the Omicron subvariant BA.2 and its offshoots. While at levels much lower than what we saw in December and January, daily new cases have more than doubled in the last month.
And, as I frequently note these days, case numbers are capturing a small fraction of actual COVID-19 infections, as PCR testing becomes less available and at-home rapid tests become more popular. Hospital admissions, a more reliable metric, have also shot up in recent weeks, with about 50% more COVID-19 patients admitted to U.S. hospitals last week than in the first week of April.
Wastewater data suggest that COVID-19 transmission nationwide may be increasing slightly or in a plateau, far from the kind of exponential increase we saw during the first Omicron surge. Biobot’s dashboard shows that coronavirus levels in wastewater in the Northeast, South, and Midwest continue to increase slightly, while in the West, virus levels have shifted back down in the most recent week of data.
The CDC’s wastewater dashboard similarly suggests that fewer parts of the country are seeing major coronavirus upticks than the national system reported a couple of weeks ago. But this dashboard is a bit incomplete at the moment, with hundreds of sites reporting no recent data, so I take that finding with a grain of salt.
Northeast states continue to report the highest case rates, according to the May 5 Community Profile Report. Maine, Rhode Island, Vermont, Massachusetts, Hawaii, New York, New Jersey, Illinois, New Hampshire, and Connecticut all reported more than 200 new cases for every 100,000 residents in the last week, passing the CDC threshold for a medium “Community Level” (or, under the agency’s old guidance, more than double the threshold for high transmission).
The BA.2 subvariant is now causing almost 100% of new COVID-19 cases in the country, according to CDC estimates, with the even-more-contagious BA.2.12.1 sub-subvariant causing about one in three of those cases. In the coming weeks, we’ll see how well protection from vaccines and recent Omicron BA.1 infections holds up against these more-transmissible versions of the virus.

Leave a comment