- CDC Variant Proportions: The CDC has adjusted the update schedule of its variant proportions estimates, from every two weeks to once a week. Variant numbers are still somewhat delayed (the most recent estimates are now from August 7, about a week ago), but this is a big improvement. The agency has also expanded its estimates to include Delta sub-lineages, called AY.1, AY.2, and AY.3.
- COVID-19 Vaccination among People with Disabilities: Another recent change to the CDC’s COVID Data Tracker is this new page, reflecting vaccination coverage among Americans with disabilities. Data come from the Census’ Household Pulse Survey, which began asking respondents about their disability and vaccine status in April 2021.
- Breakthrough cases by state, NYT: The New York Times has compiled and analyzed state data from on breakthrough (post-full-vaccination) COVID-19 cases, hospitalizations, and deaths. This information is available for 40 states and Washington, D.C.; the remaining 10 states failed to share their data with the NYT. Raw data underlying this analysis have yet to be made public on the NYT GitHub repository.
- Education Stabilization Fund: The U.S. Department of Education has distributed a lot of money to school districts in the past year and a half—funding technology for remote learning, ventilation updates to buildings, COVID-19 tests, and more. This DOE database provides detailed records on which schools received funding and how much of the money has been spent.
Tag: K-12 schools
-
Featured sources, August 15
-

Opening profile: Public health collaboration in Austin, Indiana
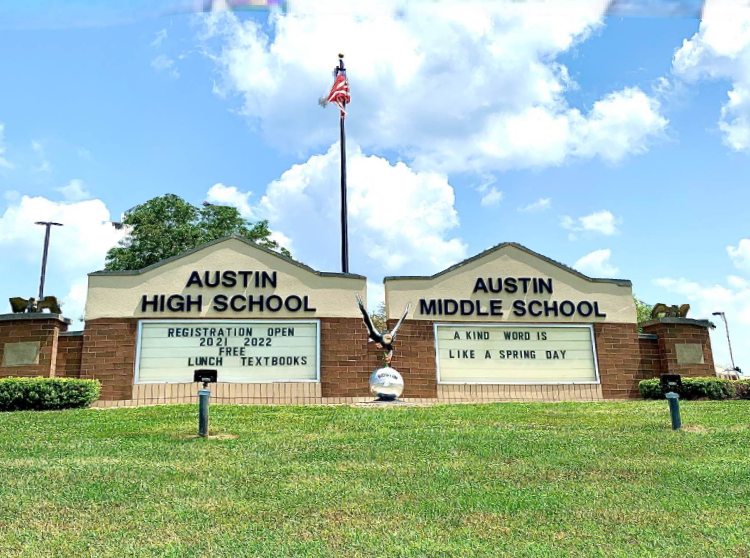
The middle and high school campus in Austin, Indiana. Photo from the Scott County School District 1 Facebook page. In 2015, Austin, Indiana was hit with a deadly epidemic: HIV/AIDS. This city, then over 4,000 people, saw over 200 HIV cases in about a year during its outbreak, which one health reporter called “the worst drug-fueled HIV outbreak ever to hit rural America.”
So when the COVID-19 pandemic hit, the small city was prepared to respond. The school district and public health department took advantage of their existing relationship and community trust to plan for a safe school reopening that stands out as one of the most successful in the state, according to a COVID-19 Data Dispatch analysis.
“The HIV outbreak actually brought a lot of people together,” said Brittany Combs, a Scott County public health nurse who worked with the district. “We all came to the same table and figured out what we needed to do to tackle the HIV outbreak. And so, for the pandemic, we all were already at the table.”
This school district, Scott County School District 1, is the subject of the first profile in the COVID-19 Data Dispatch’s “Opening” series. Alongside four other school communities, it was selected because the majority of the district’s students returned to in-person learning during the 2020-2021 school year — and under 5% of the student population was identified as a COVID-19 case. (According to the CDC, about 5% of school-aged children in the U.S. have contracted COVID-19 since the start of the pandemic.)
While Austin’s experience with HIV/AIDS is unique, the school district offers lessons for other communities. An open line of communication between Austin’s county public health agency, school administrators, and other local leaders fostered an environment of collaboration and trust. Plus, the administrators took advantage of teachers’ and parents’ knowledge of their students to make them an integral part of identifying COVID-19 cases and stopping outbreaks.
Demographics for Austin, Indiana
American Community Survey 2019 5-year estimates- Population: 3,700
- Race: 97.8% white, 0.7% Native American, 0.8% other, 0.8% two or more races
- Education: 75.8% have high school degree, 4.7% have associate’s degree, 2.0% have bachelor’s degree
- Income: $34,200 is median household income, 27.4% in poverty
- Computer: 80.6% have a computer, 65.9% have broadband internet1
- Free lunch: 64.7% of students eligible for free or reduced-price lunch2
COVID-19 stats for Scott County School District 1, 2020-2021
- Total enrollment: 1,200 students2
- In-person enrollment: About 80% at the start of the year, 85% at the end3
- Total cases, 2020-2021 school year: 47 in students, 25 in staff4
- 13 elementary school students (Austin Elementary School)
- 19 middle school students (Austin Middle School)
- 15 high school students (Austin High School)
1Source: County-level statistic
2Source: National Center for Education Statistics
3Source: Interview with Superintendent Trevor Jones
4Source: Data from Head School Nurse Deana Broadus. Numbers include students who did not attend in-person classes while sick, but whose cases were reported to the district.
Public health collaboration
In planning for reopening the school district after spring 2020 closures, the public health department had “constant meetings with the school,” Combs said. The existing relationship between the school and public health experts streamlined these meetings. And thanks to past outreach efforts around HIV and opioids, the public health department already had relationships with Austin families.
“I like to think that the health department already has a lot of trust because we were in the news a lot, we were forefront a lot, so they kinda know who we are,” Combs said. “Hopefully, the majority of the county really trusted in what we said.”
Families were also likely to collaborate with the school district because they wanted their kids back in classrooms, according to Superintendent Trevor Jones. He referenced Austin’s high poverty level (27.4%, compared to a national average of 10.5%) and explained that the majority of students get free breakfast and lunch. Combined with the community’s past drug abuse issues, he said, there was ample motivation among parents and teachers alike to protect students from the isolation of remote learning.
“The safest place our kids can be is here at school,” Jones said.
While the schools had some basic safety measures in place, such as six-foot spacing, masks required everywhere except at spaced-out desks, and regular handwashing, this community trust paid off most in identifying students with COVID-19 symptoms. Deana Broadus, head school nurse at the district, said that teachers and parents acted as a first line of defense in identifying symptoms. At the beginning of the school day, teachers took students’ temperatures and asked them about other symptoms.
“As the school year went on, teachers [get to] know their kids,” Broadus said. “They can kind of tell, oh, she doesn’t look that well today, go see the nurse.”
Broadus and the other school nurses also got to know their students by following up on symptom questionnaires and developing medical histories. Some students would erroneously mark every symptom on the checklist, she said: “You get to know who’s trying to go home.” In other cases, the symptom checks inspired the nurses to keep better track of seasonal allergies, recurring stomach aches, and other chronic conditions that were previously reported by parents but not thoroughly documented by the school.
Parents took part in the informal COVID-19 surveillance, too. “Parents would call in and report certain symptoms,” Broadus said. “[Students] either needed a doctor’s note or a negative COVID test to return to school.”
The procedure was similar if a student was sent home. While the district initially quarantined full classes following a positive case, the strategy shifted to close-contact identification: figuring out which students had sat next to an infected child. Broadus said that the chief concern she heard from parents calling in to report a case was often ensuring that no more children than necessary would need to miss in-person class, though students who missed class could still follow along online.
Keep sick students home
Through collaboration with the public health department — which took charge of contact tracing for parents, staff and other non-students — Broadus found that the vast majority of school cases came from outside the buildings.
“Usually what we found was that a parent or someone else that the child lived with was sick, and then subsequently the student got sick,” she said. And among those students, cases were typically identified quickly enough that the virus didn’t spread to others.
One of the Austin district’s major lessons from the past school year was the importance of telling families to keep their kids home if they were sick. In the past, students and staff alike tended to “push through it” and still come in if they didn’t feel well, Broadus said. Now, the policy is to stay home from school or work if you have any symptoms, not just those matching COVID-19. To reinforce this, Jones said, the district is removing rewards for perfect attendance and similar bonuses for staff. The schools are also continuing to emphasize handwashing and other good hygiene habits.
Still, the district did not avoid cases entirely. A total of 47 students contracted COVID-19 over the course of the school year, including 13 students at Austin Elementary School, 19 at Austin Middle School, and 15 at Austin High School — or about 4% of the district’s total enrollment. According to Broadus, the district identified the most cases (17 total) during November and December 2020, at the peak of the fall COVID-19 surge. The district added additional COVID-19 safety precautions at this time, such as limiting spectators at sporting events.
Delta poses new challenges
This fall, Austin’s school district is facing further challenges amplified by the country’s Delta surge. School started in-person on August 3; unlike the previous year, masks were optional. Several student cases in the first week of school led the district to switch to all-virtual classes for two weeks, Superintendent Jones said in an email on August 10.
When students return after this virtual period, COVID-19 symptom monitoring will continue — though the district is phasing out formal checklists that proved to be less helpful than parent and teacher intuition. The six-feet distancing rule has shrunk to three feet. Ventilation has also improved, thanks to grant money from the federal government for which many districts were able to apply.
Austin will continue to rely on its community to identify cases and stay safe in the new school year. “I feel like it wasn’t just one thing that we were doing,” Broadus said. “Everyone was working together.”
The COVID-19 Data Dispatch’s “Opening” series is available for other publications to republish, free of charge. If you or your outlet is interested in publishing any part of this series, please contact betsy@coviddatadispatch.com.
Update, Sept. 7, 2021: After two weeks of all-virtual classes in August 2021 prompted by high case numbers, the Austin school district returned to the COVID-19 safety protocols followed in the previous school year. Masks are once again required whenever students are not stationary at distanced desks, and desk spacing is back at six feet where possible. “We made some adjustments to our COVID procedures that have minimized the number of students in quarantine,” Superintendent Jones said in an email on Sept. 7.
More K-12 schools reporting
-

COVID source shout-out: Hawaii schools reporting
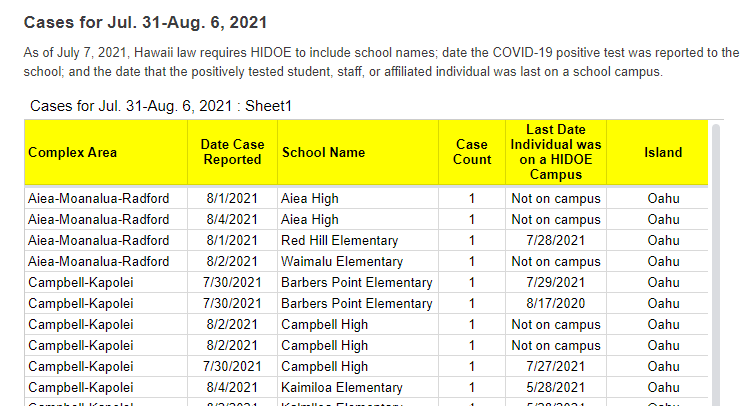
A snippet of Hawaii’s new-and-improved school COVID-19 case reporting. Screenshot taken on August 8. As noted in our “Opening” project intro, many states have paused their school COVID-19 case reporting for the summer—and a few have stopped reporting school cases entirely. Hawaii appears to be an exception: this state actually improved its reporting for the new school year.
Where the state previously just reported total cases for each island (or county) of Hawaii, it’s now reporting cases by individual school. Hawaii also reports the date a case was reported and the last date that the COVID-positive individual was on campus.
It’s still not perfect; ideally, Hawaii would also give us in-person enrollment or other numbers to contextualize these cases. But it’s a big improvement, useful for both Hawaii public school families and researchers like yours truly. Thanks Hawaii!
-
Featured sources, August 8
- School enrollment data from Big Local News: Stanford’s Big Local News program released a major dataset this week, allowing reporters to investigate the pandemic’s impact on school enrollment in their communities. The dataset includes enrollment data at the state, district, and school level for 33 states; it was compiled through a collaboration with OpenNews, the New York Times, and EdSource. To access the data, make an account on the Big Local News platform and search for “Stanford School Enrollment Project.” See this tutorial for more information on using the dataset.
- State-by-state hospitalization trends from the CDC: Last week, the CDC updated its COVID Data Tracker to include vaccination trends for every state. This week, the agency added hospitalization trends for every state, reflecting new COVID-19 admissions both overall and by age group. See the “Select a Jurisdiction” and “Select an Age Group” dropdown menus to explore the data.
- American Time Use Survey: This is a new survey from the U.S. Bureau of Labor Statistics (BLS). The BLS asked Americans how they spent their time during the COVID-19 pandemic; the resulting data demonstrate trends in remote work, commuting, childcare, and more. See the links at the bottom of this press release for comprehensive stats.
- Mirror, Mirror 2021 from the Commonwealth Fund: The Commonwealth Fund, a philanthropy foundation supporting healthcare research, published this new report comparing the U.S. healthcare system to those of ten other high-income nations. The report found, unsurprisingly, that the U.S. “ranks last overall, despite spending far more of its gross domestic product on health care.”
-
Opening: Five school districts that kept their communities safe
It’s impossible to overstate how controversial school reopening has become in the U.S. this past year. After a spring of universal Zoom school, the country diverged: some administrators, parents, and scientists were determined to get kids back in classrooms, while others prioritized COVID-19 safety above all else.
Reopening debates have dominated headlines. In August 2020, images of maskless crowds in Georgia’s Cherokee County School District went viral on social media — and the school quarantined hundreds of students just one week after the semester started. That same month In New York City, teachers brought handmade coffins and a guillotine to a protest against Mayor Bill de Blasio’s reopening plan. Chicago’s schools remained closed through the fall, and the teachers union narrowly avoided a strike during reopening negotiations in early 2021. And districts like Brookline, a liberal Massachusetts suburb, saw parents who are health experts feud with teachers over social distancing, vaccinations, and more.
The divided communities made the news — but not all U.S. schools were fighting grounds. In fact, many districts managed to bring the majority of their students back into classrooms without breeding a dreaded COVID-19 outbreak.
Here, at the COVID-19 Data Dispatch, we’re sharing stories from five such communities. The series will be published in installments: one profile a week for the next five weeks, followed by a conclusion with overall insights and lessons for fall 2021.
This project fits into a school of reporting called “solutions journalism.” Rather than focusing on uncovering society’s problems, this type of journalism seeks to identify and uplift responses to these problems. In other words, instead of asking, “Why was it so hard to reopen schools in the U.S?”, the CDD is asking, “Which schools did reopen, and what made them successful?” The Solutions Journalism Network — which, as you may guess from the name, is a nonprofit that supports solutions journalism — provided the CDD with a grant to pursue this project, as well as trainings and other guidance.
Identifying districts that reopened
Before introducing you to the five districts that we profiled, let’s talk methodology, also known as how these districts were selected for the project. As we’ve discussed at length here at the CDD, there’s a lack of good data on COVID-19 cases in schools. The country is approaching a fourth pandemic semester, but the federal government still does not provide comprehensive information on how many students are attending public school in person or how many of them have contracted the virus. And while the majority of states provide some data on this topic, these data are scattered and unstandardized — and some states have even gotten worse at their reporting since the 2020-2021 school year ended.
So, to identify success stories for this project, we relied on two main sources. First, we used a database which tracks in-person attendance change at school districts across the country, covering approximately 94% of districts across 98% of U.S. counties. These data come from SafeGraph, a company that aggregates location data from cell phones; this database was also used in a March 2021 Nature paper on disparities in school closures. Using the SafeGraph data, we could see which districts had high in-person traffic numbers in spring 2021 compared to shutdowns during spring 2020, indicating that the majority of students returned.
It’s important to establish here that the aim of this data analysis was not to identify the districts that had the biggest in-person comebacks or to do any kind of comprehensive ranking. Instead, we looked for outliers: districts that had a larger attendance change than the schools around them.
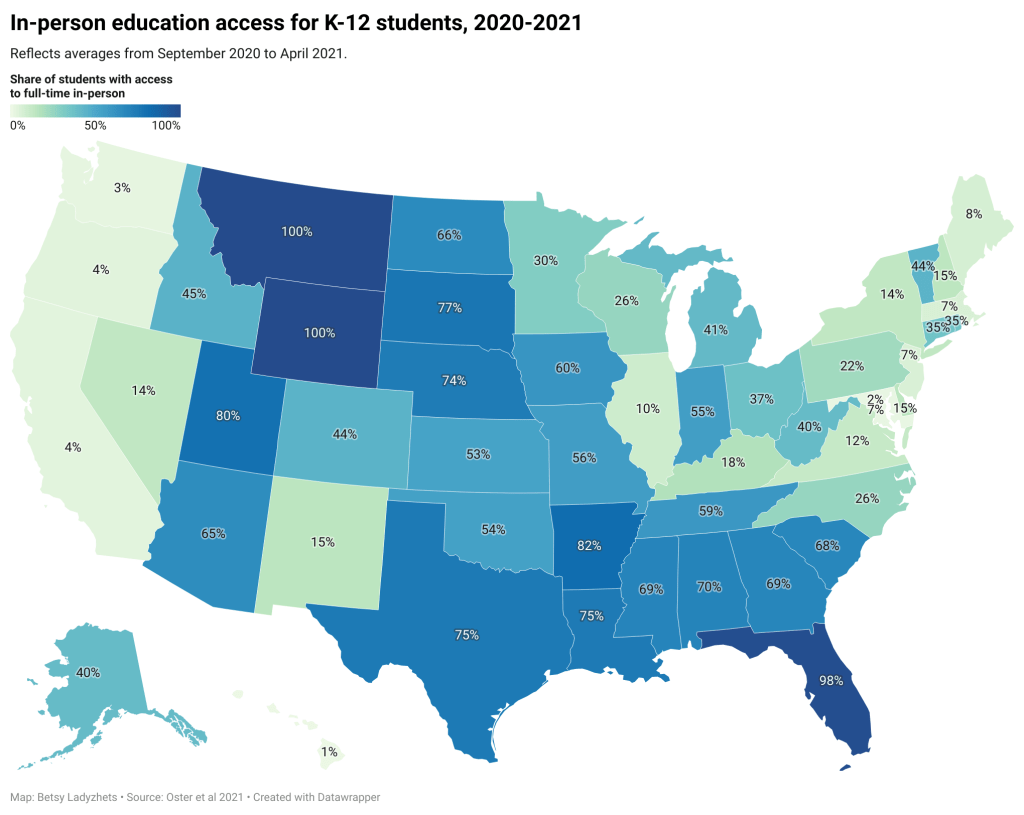
This geography-based method was important because the 2020-2021 school year looked very different from one state to the next. For example, in New York City, just over one-third of public school families attended school in-person before June 2021, per the New York Times. Meanwhile, in Texas, the majority of schools had at least 70% of students back in-person by spring 2021, according to data from the state department of health.
!function(){“use strict”;window.addEventListener(“message”,(function(e){if(void 0!==e.data[“datawrapper-height”]){var t=document.querySelectorAll(“iframe”);for(var a in e.data[“datawrapper-height”])for(var r=0;r<t.length;r++){if(t[r].contentWindow===e.source)t[r].style.height=e.data["datawrapper-height"][a]+"px"}}}))}();You can see the variation in the map above, based on a study published in the Centers for Disease Control and Prevention’s Morbidity and Mortality Weekly Report earlier this summer. According to this analysis, every single student in Montana and Wyoming had access to in-person learning five days a week, between September 2020 and April 2021, while in Maryland, just 2.3% of students had that access during the same period.
Comparing COVID-19 case numbers
After using the SafeGraph dataset to identify outliers in a given state, we used data from state public health departments to identify districts’ COVID-19 case numbers. This step restricted the analysis to states that provided a.) COVID-19 case data by individual district and b.) data for the entire school year. Few states meet both of these criteria. It’s no coincidence that New York and Texas — also the only two states providing in-person enrollment numbers — are both represented among the five focus districts of this project.
You can find more information on state K-12 data reporting at the CDD’s annotations page here.
!function(){“use strict”;window.addEventListener(“message”,(function(e){if(void 0!==e.data[“datawrapper-height”]){var t=document.querySelectorAll(“iframe”);for(var a in e.data[“datawrapper-height”])for(var r=0;r<t.length;r++){if(t[r].contentWindow===e.source)t[r].style.height=e.data["datawrapper-height"][a]+"px"}}}))}(); !function(){“use strict”;window.addEventListener(“message”,(function(e){if(void 0!==e.data[“datawrapper-height”]){var t=document.querySelectorAll(“iframe”);for(var a in e.data[“datawrapper-height”])for(var r=0;r<t.length;r++){if(t[r].contentWindow===e.source)t[r].style.height=e.data["datawrapper-height"][a]+"px"}}}))}();Over the next few weeks, you’ll learn about how schools from rural Indiana to New York City faced the challenge of bringing kids back to classrooms while keeping their communities safe. Some took advantage of novel COVID-19 technologies, such as tests and ventilation updates. But others utilized less technical strategies such as personalized communication with parents and close collaboration with local public health officials.
As the Delta variant intensifies reopening challenges for this coming fall, the stories of these five communities tell us that virus cases can be kept down during in-person learning if administrators, teachers, and families all work together.
These schools are:
- Scott County School District 1 in Austin, Indiana
- Garrett County Public Schools in Garrett County, Maryland
- Andrews Independent School District in Andrews, Texas
- Brooklyn Arts and Science Elementary School in Brooklyn, New York
- Port Orford-Langlois School District 2CJ in Curry County, Oregon
The COVID-19 Data Dispatch’s “Opening” series is available for other publications to republish, free of charge. If you or your outlet is interested in publishing any part of this series, please contact betsy@coviddatadispatch.com.
Past K-12 schools reporting
- COVID-19 school data remain sporadicOn November 18, New York City mayor Bill de Blasio announced that the city’s schools would close until further notice. The NYC schools discrepancy is indicative of an American education system that is still not collecting adequate data on how COVID-19 is impacting classrooms—much less using these data in a consistent manner.
-

CDC says schools should reopen, but will data improve?
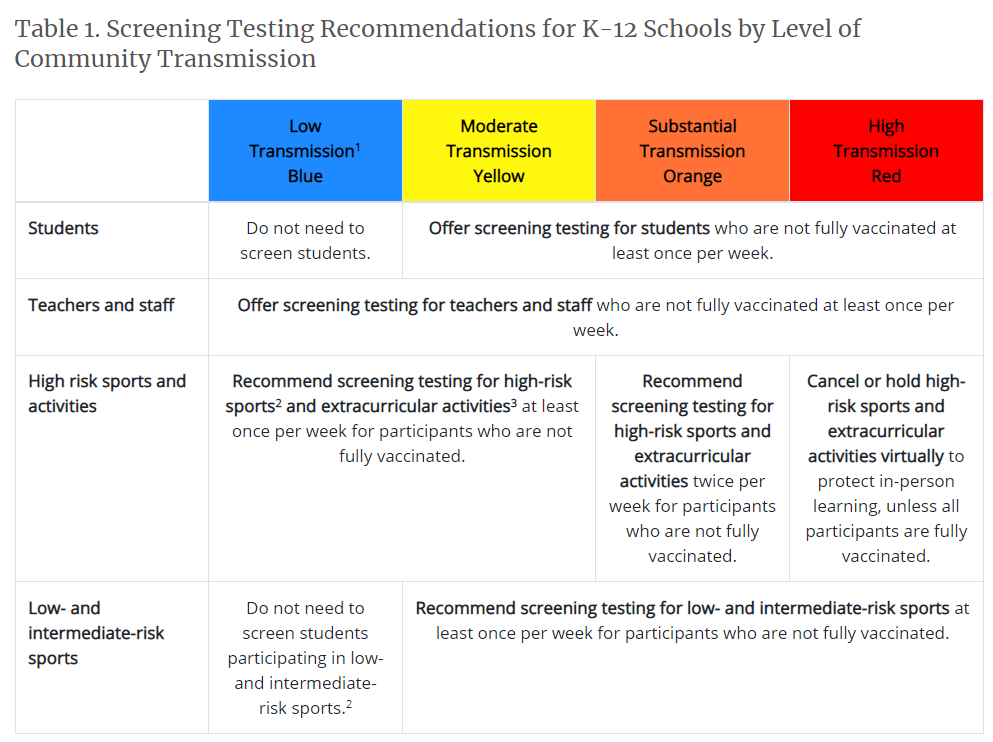
The CDC’s updated guidance focuses on testing, but makes no mention of reporting the results of said testing. The CDC made a major announcement this Friday: the agency updated its recommendations for COVID-19 safety in K-12 schools.
The new recommendations prioritize getting kids into classrooms, even when schools aren’t able to implement all prevention strategies. They also prioritize vaccination; the CDC says that all teachers and students over age 12 should get vaccinated, and those individuals who get their shots don’t need to wear masks at school.
This guidance adds to growing evidence that the majority of America’s K-12 schools will be fully open in the fall. Some areas that were bastions of remote learning—like New York City, where I live—will no longer allow that option.
But there’s a big problem with this trend: we still do not have good data on COVID-19 in schools. I’ve written about this issue extensively; over a year into the pandemic, there’s still no federal dataset on cases that have arisen in COVID-19 schools, and state reporting is incredibly fragmented. If this situation continues into next fall, we will be ill-equipped to understand which safety measures are working best in a fully reopened America—and to protect the young children who are not yet eligible for vaccination.
Throughout the 2020-2021 school year, the COVID-19 Data Dispatch has maintained a set of annotations on school COVID-19 data. I updated these annotations yesterday after a couple of months’ hiatus. I found that, in some locations, reporting is even worse than it was in the spring.
Here are a few highlights:
- A number of states have paused their K-12 COVID-19 reporting for the summer, as schools are on break. These states include Alabama, Connecticut, Idaho, Louisiana, Mississippi, the Dakotas, Tennessee, Washington, and West Virginia.
- A couple of other states (Maine, Montana) appear to have paused this reporting, but did not include clear language on their dashboard to back this up.
- South Carolina and Delaware both stopped reporting for the summer, with notes on their dashboards indicating that the state health departments have not yet decided whether to resume reporting in the fall. Delaware’s note is particularly ominous.
- Florida stopped providing regular school COVID-19 reports in early June, when the state discontinued its dashboard and switched to providing a single weekly report for all state data.
- Both Arkansas and Iowa discontinued their school COVID-19 pages during the spring, with no indication that reporting will resume in the future.
Another major update to the CDC’s guidance, from my perspective, was a new emphasis on screening tests. The CDC now recommends regular COVID-19 tests for unvaccinated students and teachers, and for those taking part in school athletics and other higher-risk activities.
I was glad to see this update because my reporting on rapid tests—including an upcoming piece on rapid testing in schools—has led me to believe that this type of testing is a key strategy for avoiding school outbreaks. But it’s another area where good data are lacking right now. New York continues to be the only state reporting school testing numbers; and from the looks of other state dashboards, they don’t appear prepared to track these key data at a systematic level.
Delta is increasingly hitting younger populations, including children not old enough to be vaccinated. The CDC’s guidance encourages schools to bring these kids into classrooms, but it puts a lot of pressure onto individual districts at a time when they need more support, as Dr. Katelyn Jetelina points out in a recent Your Local Epidemiologist post.
The guidance also says literally nothing about data collection and reporting. I worry that, if we don’t get better data infrastructure in place for schools, we could miss Delta outbreaks this fall.
Also: this feels like a good time to announce that I’m currently working on a big project covering school reopening. I’m identifying and profiling districts that successfully brought their students back into classrooms, supported with a grant from the Solutions Journalism Network. The stories will be published here in the COVID-19 Data Dispatch starting in August.
As always, if you have questions or want to collaborate, let me know at betsy@coviddatadispatch.com.
More K-12 reporting
- COVID-19 school data remain sporadicOn November 18, New York City mayor Bill de Blasio announced that the city’s schools would close until further notice. The NYC schools discrepancy is indicative of an American education system that is still not collecting adequate data on how COVID-19 is impacting classrooms—much less using these data in a consistent manner.
-
Fall school reopening plans demonstrate continued data gap
Earlier this week, New York City mayor Bill de Blasio made a big announcement: all the city’s schoolchildren are going back to the classroom this fall. There will no longer be a remote option.
NYC was one of the first big cities to open with a hybrid model last fall, but it came with challenges—ranging from teachers protesting unsafe conditions, to in-person students doing “Zoom school” in the library, to closures dictated by confusing test positivity rates. The city’s choice to eliminate a remote option indicates a commitment to simple, unified policies for all students and teachers. It also suggests that many other districts may follow NYC’s lead—as the New York Times reported, a few districts already have.
Vaccine options for children ages 12 and older (now Pfizer, soon Moderna) make in-person education a safe bet for a lot of families. But younger students will likely have to wait much longer for their shots. As a result, regular testing will continue to be a key safety strategy, aided by American Rescue Plan funding dedicated specifically to school surveillance programs. Beyond identifying COVID-19 cases before they turn into outbreaks, testing can help parents and teachers feel safer about reopening plans.
But, as we have covered extensively here at the COVID-19 Data Dispatch, school testing data are incredibly hard to come by. New York continues to be the only state that reports any data on COVID-19 tests conducted in schools, and some states fail to even report COVID-19 school case counts.
The federal government is also failing to track these data. As POLITICO’s David Lim reported last week, the situation is pretty murky:
Since Biden took office, more schools have returned to hybrid and in-person classes, but it remains unclear what percentage of school districts across the country are regularly screening students and teachers for Covid-19. An Education Department spokesperson said the department is “not tracking that level of detail.” A Centers for Disease Control and Prevention spokesperson said that “most states have offered or implemented testing programs in schools during the 2020-2021 school year,” adding that a survey conducted by the publication EdWeek in February found that just 16 percent of school district leaders said they were testing students.
Education and health groups — including the Association of State and Territorial Health Officials, the Rockefeller Foundation and American Federation of Teachers — also said they do not have comprehensive nationwide data on how many districts have testing programs in place.
This continued lack of data makes it difficult to evaluate how well school testing programs actually work. A lot of schools may be flying blind going into the fall 2021 semester, or they may choose not to set up regular testing at all.
I plan to do more reporting on this topic over the summer, including detailed investigations of individual school districts. If you have any burning questions, send them my way (betsy@coviddatadispatch.com).
More K-12 schools reporting
- COVID-19 school data remain sporadicOn November 18, New York City mayor Bill de Blasio announced that the city’s schools would close until further notice. The NYC schools discrepancy is indicative of an American education system that is still not collecting adequate data on how COVID-19 is impacting classrooms—much less using these data in a consistent manner.
- COVID-19 school data remain sporadic
-
State K-12 school data still leave much to be desired
The academic year is coming to an end for most schools pretty soon (I’ve been off for about a week, but I’m a college student), so we thought it’d be appropriate to check in on the state of state K-12 COVID-19 data. We’ve been keeping track of the metrics reported by states throughout the fall and spring, and you can find our annotations of those sources here.
We had a few metrics that we looked for in a school tracker (if one exists for a state at all, which we’ll get to.) These include cases, hospitalizations, deaths, tests, test positivity rate, and in-person enrollment. We also wanted to know if trackers were separating student cases from staff cases. While we didn’t expect every state tracker to account for all of these, a robust tracker should include at least a few.
Turns out, no state trackers reported all of our wished-for metrics. Most trackers—37 of them—just reported cases and called it good, and 24 of them separated cases by students and staff. There are too many states in this vein to list them all, but a few include Alabama, Indiana, Idaho, the Dakotas, South Carolina, and Oregon (which is my home state so I’m a bit more disappointed.)
But when we narrow it down to slightly more granular metrics like hospitalizations, the number of trackers that report them drop significantly. Only five states reported deaths: Colorado, Illinois, Kansas, North Carolina, and Virginia. Three reported hospitalizations: Illinois, Kansas, and Georgia. Two reported tests: Georgia and New York. (One caveat for Georgia: they’re not actually reporting cases in schools, they’re reporting cases in school-aged children.)
To assess how robust a particular state’s tracker was, we assigned it an index number based on how many metrics it reported. (The methodology for doing so can be found here.) Essentially, a higher number indicates a more robust tracker. With this methodology, the top five states were New York (19), Kentucky (14), Texas (14), New Hampshire (14) and South Carolina (13). The bottom three were Utah, Arizona, and Kansas (all 7.) The average was between 8 and 9, with a median of 9.
However, so far we’ve been talking about states with school trackers at all. 11 states do not track school cases (at the very least, we couldn’t find their school tracker). I’ll actually list these out: Alaska, Arkansas, California, Iowa, Nebraska, Nevada, New Mexico, Oklahoma, Pennsylvania, Utah, and Wyoming.
In pointing this out, I’m not trying to shame the public health authorities in these states who are working very hard to get this pandemic under control. I’m trying to get the point across that statewide school data is still very fractured and very incomplete. And while we wait for a complete federal tracker, state data is really all we have. COVID-19 is still going to be a threat in schools as long as people under 16 can’t get vaccinated; we should at least know how much of a threat it’s turned out to be.
Related posts
- COVID-19 school data remain sporadicOn November 18, New York City mayor Bill de Blasio announced that the city’s schools would close until further notice. The NYC schools discrepancy is indicative of an American education system that is still not collecting adequate data on how COVID-19 is impacting classrooms—much less using these data in a consistent manner.
- COVID-19 school data remain sporadic
-
CDC says 80% of teachers and childcare workers are vaccinated, fails to provide more specifics
This past Tuesday, April 6, the Centers for Disease Control and Prevention put out a press release that I found heartening, yet confusing.
“Nearly 80 percent of teachers, school staff, and childcare workers receive at least one shot of COVID-19 vaccine,” the release proclaims. These vaccinations include “more than 2 million” people in these professions who received doses through the federal retail pharmacy program and “5-6 million” vaccinated through state programs, all of whom received shots before the end of March.
This CDC release is exciting because occupational data—or, figures tying vaccination counts to the jobs of those who got vaccinated—have been few and far between. As I wrote last month, state and local health departments have been unprepared to track this type of data; even getting states to report the race and ethnicity of their vaccinated residents has been a struggle.
While you may need to be a teacher or fit another essential worker category in order to get vaccinated in your state, your provider may require you to show some proof of eligibility without recording that eligibility status anywhere. Meanwhile, school districts and local public health departments might be wary of surveying their local teachers to see who’s been vaccinated. Madeline Will explains the issue in EdWeek:
Yet many vaccination sites do not collect or report occupation data, and many districts are not tracking vaccination rates themselves. Some district leaders say they’re wary of asking employees if they’ve gotten vaccinated because they don’t want to run afoul of any privacy laws, although the U.S. Equal Employment Opportunity Commission has said that employers can ask whether employees have gotten a COVID-19 vaccine.
This brings us to the question: how did the CDC get its 80% figure? The agency’s press release is frustratingly unspecific; it’s all of 282 words long, with just one paragraph devoted to what a data journalist like myself would call the methodology, or the explanation of where the data come from.
Here’s that explanation:
CDC, in collaboration with the Administration for Children and Families, the Department of Education, and our non-federal partners, conducted surveys of Pre-K-12 teachers, school staff, and childcare workers at the end of March. CDC received almost 13,000 responses from education staff and nearly 40,000 responses from childcare workers. The responses closely matched available national race/ethnicity and demographic data on this specific workforce.
Let’s unpack this. The CDC worked with two other federal agencies to conduct a survey of this high-priority occupation group, including 13,000 school staff and 40,000 childcare workers. The agency then extrapolated the results of this 53,000-person survey to estimate that 80% of Americans in these occupations have been vaccinated overall. While the CDC doesn’t provide any detail on how workers were chosen for the survey, the press release notes that responses match demographic data for this workforce, indicating that agency researchers did collect race, ethnicity, and other demographic information for those they surveyed.
So, here’s my big question: is the CDC planning to release more detailed results from this survey? And if not… why?
As we’ve noted in past CDD issues, teacher vaccination can go a long way towards inspiring confidence in school reopening programs, in school staff and parents alike. And that confidence is needed right now: February results of the Department of Education’s school COVID-19 survey, released last week, demonstrate that even though the majority of U.S. schools are now offering in-person instruction, only about one-third of students are learning in the classroom full-time. (More on those findings via AP’s Collin Binkley.)
If the CDC released results of this vaccination survey for individual states and demographic groups, local public health and school district leadership may be able to see how their populations compare and respond accordingly. If, say, Texas is vaccinating fewer teachers than New York, Governor Greg Abbott can make a speech telling his state to step it up.
And those states where a higher share of teachers have been vaccinated can use the information to inform school opening plans. The CDC’s press release doesn’t specify what share of that 80% vaccinated represents partially versus fully vaccinated school and childcare workers (which would also be useful data!), but even a workforce that was partially vaccinated at the end of March may be ready for in-person work by the end of April.
All this is to say: show your work, CDC! Give us more detailed data!
It’s also important to note, though, that while teachers are in the spotlight, they aren’t the only occupation for whom vaccination data should be a priority. Many staff in long-term care facilities have been unwilling to get vaccinated even though it would be a highly protective measure for the seniors they care for, Liz Essley Whyte wrote in late March at The Center for Public Integrity.
The federal program that partnered with pharmacy chains to get LTC residents and staff vaccinated is now winding down, Whyte reports, even though some states still have a lot of LTC workers left who need shots. In seven states and D.C., less than a third of staff are vaccinated.
Whyte writes:
Low vaccination rates among staff at these facilities mean that workers continue to have greater risk of contracting COVID-19 themselves or passing the virus to their patients, including residents who can’t be inoculated for medical reasons. Low staff uptake can also complicate nursing homes’ attempt to reopen their doors to visitors like Caldwell, who are striving for some sense of normalcy.
The Centers for Medicare & Medicaid Services are hoping to improve data on this issue. This agency proposed a new rule this week that would require nursing homes to tell the CDC how many of their health care workers are vaccinated against COVID-19, POLITICO reported on Friday. This rule would enable the CMS to identify specific facilities that are faring poorly and take appropriate action. And, if such data are made public, it would be easier for both reporters and families of nursing home residents to push for more LTC worker vaccinations.
Still, privacy concerns continue to be a barrier for more detailed vaccination data of all types. Some of the big pharmacy chains that are administering huge shares of shots are requiring vaccine recipients to share their emails or phone numbers when they register for an appointment—then saving that data to use for future marketing. Getting patient contact information is an easy way to ensure people actually show up for their appointments, but when it’s a private company collecting your phone number instead of your public health department, it’s understandable that people might be a bit concerned about giving any information away.
More detailed data standards, along with communication between governments and vaccine providers, could have saved the U.S. from the patchwork of vaccination data we’re now facing. But instead, here we are. Asking the CDC to please send out a longer press release. Maybe with a state-by-state data table included.
-
Featured sources, March 28
- COVID-19 diverse sources: NPR journalists from the organization’s Source of the Week project have compiled this database of COVID-19 experts from diverse backgrounds. The database is divided into 13 major categories, including virology, disease origin, health policy, racial/ethnic health disparities, and more. I know I’ll be using this database in my own reporting!
- School Survey Dashboard from the Institute of Education Statistics: As part of the Biden Administration’s commitment to reopening K-12 schools across the country, the federal government is now collecting data on how students are receiving education—and releasing those data on a monthly basis. This dashboard draws from surveys of a nationally represented sample including 7,000 rural, suburban, and urban schools, focusing on fourth-graders and eighth-graders. We don’t have data on COVID-19 cases, tests, or enrollment numbers, and several major states are missing, but this is a good start! For more on these data, read Lauren Camera in U.S. News.
- Counties with High COVID-19 Incidence and Relatively Large Racial and Ethnic Minority Populations (CDC MMWR): The CDC continues adding to the overwhelming body of evidence pointing to disproportionately high COVID-19 impacts for people of color in the U.S. This report, released last Wednesday, identified counties across the U.S. that had both large minority populations and high COVID-19 case counts (relative to their populations) between April and December 2020. Different racial/ethnic groups have had different trajectories, but by mid-December, almost all counties in the U.S. had high case numbers thanks to the overwhelming winter surge.
- PreventCOVIDU study examines vaccine effectiveness in college students: At the White House COVID-19 briefing this Friday, Dr. Fauci described a new clinical trial that kicked off this past week. 12,000 college students, age 18-26, at 22 universities across the country, will be followed over the 5 months. Half of the students are receiving Moderna vaccine doses now, while the other half will serve as a control group (and get vaccinated later). All students will get tested daily—and, in a unique move for vaccine studies, about 25,000 of these students’ close contacts will also get tested daily. The study is designed to determine if the Moderna vaccine prevents coronavirus infection and transmission. See the list of participating universities at the link.
