- Vaccination data from dialysis facilities: A recent addition to the CDC’s COVID Data Tracker, this dataset reports vaccination coverage among patients and staff working in dedicated dialysis facilities, which offer treatment to patients with chronic kidney diseases—a group at high risk for severe COVID-19. The vaccine coverage rates for dialysis staff are new as of this week. Overall, about 74% of dialysis patients and 79% of staff are fully vaccinated, and smaller percentages are boosted, as of late January.
- CDC report provides vaccination data by sexual orientation and gender identity: As health equity advocates have pushed for more demographic data describing who’s been vaccinated in the U.S., the focus is often on race and ethnicity data. But it’s also important to track vaccinations among the LGBTQ+ community, as these Americans are at higher risk for severe COVID-19 due to HIV, mental health issues, and other conditions common in this group. This new CDC report provides a snapshot of these important data, sourced from the National Immunization Survey. Notably, the report found that vaccine coverage was higher overall among gay and lesbian adults compared to straight adults—but lower among Black LGBTQ+ people across all identities.
- Association of child masking with COVID-related childcare closures: A new paper published in JAMA Network Open this week provides additional evidence showing that mask requirements can help keep schools and childcare centers open. The paper found that childcare programs where children were masked were 14% less likely to close over the course of a year than programs without child masking. For more commentary on the paper, see Inside Medicine.
Tag: Featured sources
-
Sources and updates, February 6
-
Featured sources, January 30
- KFF updates COVID-19 vaccine monitor: The Kaiser Family Foundation released a new report in its COVID-19 vaccine polling project this week, marking over a year since the U.S.’s vaccine rollout began. Notable updates from this report include: people are worried about Omicron’s impact on the economy and healthcare system, less worried about its impact on them personally; vaccine uptake “inched up in January” with more people getting their first doses; and gaps in booster shot uptake echo early gaps in vaccine uptake, with white Americans getting boosted at higher rates than Black and Hispanic Americans.
- New version of the COVID-19 circuit breaker dashboard: A few weeks ago, I shared a dashboard from emergency physician Dr. Jeremy Faust and colleagues that estimates which U.S. states and counties are facing hospitals operating at unsustainable levels. The dashboard has now been updated, with help from Kristen Panthagani, Benjy Renton, Bill Hanage, and others; this new version includes hospital capacity and related metrics over time for states and counties, estimates of open beds, ICU-specific data, and more.
- Biobot’s Nationwide Wastewater Monitoring Network: If you’re looking to monitor COVID-19 levels in U.S. wastewater, Biobot’s dashboard is a great source. The wastewater epidemiology company collects samples from water treatment facilities across the country; their dashboard includes both estimates of coronavirus levels in the U.S. overall and estimates for specific counties in which data are collected. The data are available for download on Github. (H/t Data Is Plural.)
- Prisoners released in 2020, DOJ: A new report from the U.S. Department of Justice includes data on state and federal prisons during the COVID-19 pandemic. The number of inmates in these facilities declined about 15% from the end of 2019 to the end of 2020, according to this report. A large cause for this decline was overall disruption in the court system, not compassionate releases due to the pandemic: there was a 40% decrease in prison admissions from 2019 to 2020.
- Companies requiring COVID-19 vaccinations: ChannelE2E, a news site covering the IT industry, has compiled this comprehensive list of major companies requiring their employees to get vaccinated. The list includes about 50 companies, and is regularly updated with links to news sources discussing policy changes. (H/t Al Tompkins’ COVID-19 newsletter.)
-
Featured sources, January 23
- CDC dashboard adds booster shots to key pages: This week, the CDC added booster shot status to its COVID-19 dashboard page detailing the rates of lab-confirmed COVID-19 hospitalizations by vaccination status. According to the new chart (at the bottom of this page), in December, hospitalization rates were 49 times higher in unvaccinated adults over age 65 than in fully vaccinated and boosted adults in that age group. The CDC also added booster shot status to its COVID-19 Vaccination Equity page, with a chart showing booster shot rates according to race and ethnicity. Unsurprisingly, white and Asian Americans have the highest booster rates.
- KFF: How Are Private Insurers Covering At-Home Rapid COVID Tests? A new report from the Kaiser Family Foundation compares rapid at-home test reimbursement policies for 13 major private insurers, as of mid-January 2022. According to the report, six insurers are currently offering direct coverage (meaning users don’t need to pay out of pocket for the tests), while seven offer reimbursement online, by mail, or by fax.
- QCovid® risk calculator: This tool, commissioned by England’s Chief Medical Officer for use in the U.K. national healthcare system, helps potential COVID-19 patients estimate their risk for severe symptoms. The tool is meant for use by doctors and other medical professionals who are actively evaluating patients, but the website allows anyone to go through the risk questionnaire and see their status. (You just can’t use the results for anything beyond gaining information.)
-
Featured sources, January 16
- Post-Acute Sequelae of SARS-CoV-2 infections estimates and insights: Continuing with the Long COVID theme of this issue: I recently learned about this dashboard from the American Academy of Physical Medicine and Rehabilitation. It provides estimates of Long COVID cases in the U.S. based on case numbers from Johns Hopkins University and a model assuming that 30% of surviving COVID-19 cases will lead to long-term symptoms. The dashboard includes estimates of total Long COVID cases, cases over time, and cases by state.
- Disease severity among hospitalized patients (CDC): The CDC added a new page to its COVID-19 dashboard this week, providing data on the shares of COVID-19 patients in U.S. hospitals who require intensive care and ventilation, and who die while at the hospital. The data come from the CDC’s hospitalization surveillance network and other federal hospital sources.
- Vaccination dashboard annotations: This weekend, I updated my annotations page detailing how every U.S. state and several national sources track vaccinations. 39 states are now reporting some data on booster shots or third doses, I found, though most of them still aren’t providing demographic data reflecting the recipients of these additional doses.
-

A new resource for journalists covering Long COVID

Screenshot of the source list, showing some of the main how-to info available. This week, a new resource that I’ve been working on for the past few months went live: a comprehensive source list including Long COVID patients and experts who are willing to talk to reporters. This source list project was a collaboration with Fiona Lowenstein, who’s a journalist, speaker, consultant, and founder of the Body Politic support group for Long COVID patients.
Here’s some info about the source list:
- It includes over 300 Long COVID sources from the U.S. and other countries, spanning all ages, race and ethnicity groups, and other demographics.
- It’s sorted into four categories: patients who identify as Long COVID experts and/or advocates; patients who aren’t experts but can speak to their own lived experience; other experts (scientists, clinicians, advocates, etc.); and related conditions and experiences.
- Patients and experts have identified topics about which they’d like to talk to journalists, including Long COVID research, patient care, policy, mental health, relationships, financial insecurity, and related conditions (such as ME/CFS and dysautonomia).
- The list is hosted on Notion, allowing users to search and filter for specific source needs.
- This project is ongoing, and we will be adding more sources on an ongoing basis. If you would like to be added or have other feedback, please email LongCovidSourceList@gmail.com!
To further explain the motivations for this project and provide some advice on how to use the source list, I did a Q&A with Fiona. Our conversation included the gaps in Long COVID news coverage, connecting the dots between Long COVID and other chronic conditions, recommendations for interviewing Long COVID patients, suggestions for covering this condition in year three of the pandemic, and much more. This interview has been lightly edited and condensed for clarity.
Betsy Ladyzhets: Why did you want to do this project? Why was it worth putting the time and effort into making this source list?
Fiona Lowenstein: I think there were two things. One was almost like a personal desire to have fewer media inquiries in my own inbox. I was receiving a lot of emails from journalists who were looking for very specific types of Long COVID sources. Part of that was because I started the support group Body Politic, and people were reaching out, asking me to post stuff in the group. Also, I have written a lot of stories on Long COVID and interviewed a lot of patients, and so people wanted help reaching more patients.
I knew that a lot of the support group leaders were very burnt out and kind-of exhausted, and that media requests are one of the biggest sources of, like, email stress. And I wanted to think about, is there a way to just ease this process for everyone? I was also noticing that journalists were getting frustrated with how long it was taking to get in touch with [Long COVID] sources, because so many of these groups are run by chronically ill people, and a lot of them are volunteers. They’re not always able to respond to an email in twelve hours.
Part of [the motivation] was also feeling like the news coverage of Long COVID, a lot of it focuses on the same people and the same stories. I’m someone that has been included in a lot of those articles, and at a certain point in time, I stopped doing press on my own experience, because I was like, this story is already out there. And I’m not sure it’s even reflective of the average experience of Long COVID, just because I had a lot of privilege that helped me get care and rest through my recovery.
So, I wanted to see more types of patients talked about, more patients who aren’t necessarily young and super healthy and fit before they got sick. Because that was very much the narrative for a long time. And that is sort-of an ableist narrative, to be emphasizing so strongly that so many of us were young and healthy, and we should care about our chronic illnesses because of that.
Also, I know that Long COVID coverage is going to have to go deeper and is already starting to go deeper in the coming year. Most news outlets have had at least one story explaining what Long COVID is. But we’re now at a point where we’re going to have to delve deeper into, like, what are the financial risks? What toll does [Long COVID] take on relationships? How are people navigating workplace accommodations? What about these specific symptom clusters that might morph over time? What about people who have additional diagnoses [of other chronic conditions] on top of having Long COVID?
And the last thing was, I want to connect the dots between Long COVID and other post-viral or infection-initiated chronic illnesses, like ME/CFS, dysautonomia, and other diagnoses that people with Long COVID have received. These are also diseases that have a lot in common, both in terms of symptoms and the way that they present but also in terms of social and political issues with regards to getting care, getting funded research, etc.
I think those of us who have had Long COVID and been involved or even been a fly on the wall in this advocacy work have seen how people with related chronic illnesses are not getting as much media attention. Even though they are really helping the Long COVID advocacy movement in a huge way, and helping patients on a day-to-day basis. So, that was why I wanted to include people with related conditions and experiences [on the source list], ideally, as well.
BL: Yeah, that makes sense. When we were starting to put together the Google forms [used to collect source’s information] and thinking about who we wanted to send them to, what were some of the things that you were considering?
FL: I was thinking a lot about the patient side of things. I wanted to connect with the leaders of the big [Long COVID] support groups, especially the private support groups, because the private support groups are a little more insular and more highly moderated. They’re the places where we can assume that a larger majority of the members actually have Long COVID. But the private support groups also have no way for journalists to kind-of see into those ecosystems. So, I wanted to connect with those support group leaders and have them share [the project within their groups]. I also did a lot of sharing on social media, because I’m followed by a lot of Long COVID patients and people living with the illness. And I messaged past sources, other people that I’ve talked to.
That being said, I was a little surprised—we got a lot of patient responses, but I think we could have gotten more. (Editor’s note: The list includes over 250 patients and 80 non-patient experts.) I know that there are more [Long COVID] people out there who want to tell their stories. But I think that, among the population of people with Long COVID who want to talk to the press, there are a lot of people who are just burnt out and tired of filling out forms. And there’s also a lot of distrust of the media. There was at least one support group that basically said, “We don’t want to participate in this because we don’t want our members’ information out there for reporters to access, we’ve had so many bad experiences with journalists.”
That was a tricky thing to navigate. To that end, something I’m hoping to do at some point is organize another media training with some of these support groups, to talk through, like, what are some of the issues that are coming up in the journalist-patient relationship? What are your rights as a source when you’re being interviewed? That sort of thing.
BL: Was there anything else that surprised you, when you were looking at the form responses? I know one thing that struck me when I was looking at them was, how many patients checked the box for experience with financial instability. I knew that was an issue, but it’s not something that a lot of articles have focused on so far.
FL: Yeah, that’s a really good point. I filled out the form, because I’ve had Long COVID, and I checked that off, too. I think that, in the Long COVID communities, [financial instability] is such a huge issue, and it’s being talked about constantly. Even for people like myself—I had a relative amount of financial privilege, I had savings that I could rely on after I got sick and couldn’t work. And I had my parents and my partner’s parents, they were able to contribute a little bit to our rent and our groceries and that sort of thing. But it’s still massively set back my finances. So, I think almost everyone has had that experience on some level.
I think one thing that surprised me was how many people had a diagnosis of another condition on top of Long COVID. It’s good, it’s heartening to see that people are getting diagnosed with things like dysautonomia, myalgic encephalomyelitis, and mast cell activation syndrome. I know that [these diagnoses are] happening a lot with the patient advocates that I know, but those are people who often have the highest levels of access to a clinician or a Long COVID clinic. But [the form responses] made me wonder if maybe also, there’s been so much information-sharing online and between patient groups that people are now able to diagnose themselves with this stuff—which is very common in chronic health communities because it can be so hard to get a diagnosis.
So, it was interesting seeing that so many people have checked off dysautonomia and these other things, because it made me feel like, okay, there actually is a pretty large group of people that are very aware of these other illnesses. I could not have told you what dysautonomia was, prior to getting COVID—even though I technically had a form of it, it turns out, before getting COVID. It seems indicative of the extent to which community information sharing has spread, and actually helps people figure out what they’re dealing with.
And those diagnoses are also really helpful for figuring out your symptom management techniques. Like, I learned rest and pacing from people in the ME community. So that’s a huge part of it, too: it’s having that community that you can look to, in addition to Long COVID. People who have been sicker for longer, and research has been going on for longer, and you can learn from [these other chronic illness patients].
BL: What recommendations do you have for people who are using the source list?
FL: There are a couple of kind-of broad stroke recommendations that we tried to account for in some of the questions we included on the list.
For example, one thing that I have said to colleagues and also publicly throughout the pandemic is: if you are a journalist reporting on Long COVID, you unfortunately have to have a pretty flexible schedule with your interviews, because this is an unpredictable illness. Someone could tell you, “Yeah, I’m available tomorrow at 2pm.” And then they could end up being really sick at that time. So, in the questions for patients, there’s a space where they can indicate how quickly they think, on average, they’ll respond to reporters. Hopefully that will help with this issue of, the urgency of tight deadlines, while trying to report on an issue in which people can’t always get back to you in a short timeframe.
Just be aware that these are people who, even though a lot of them may not be working, are dealing with a full schedule of managing their own health. It’s also important to know that there is distrust amongst this population, in terms of interacting with journalists and reporters. I’m not saying that exists with every single one COVID patient, and lots of people have had really good experiences talking to journalists.
But still, for that reason, it’s sometimes helpful, when you’re interviewing someone with Long COVID, to explain why you’re asking the questions you’re asking. For example, on the source list, we’ve included both people who have tested positive for COVID-19—via a PCR test or other diagnostic test—and people who have not tested positive. Some of those people who have not tested positive have a clinical diagnosis of COVID or Long COVID, while others do not. It’s important to understand the difference between those testing statuses and those diagnosis statuses. These statuses may have something to do with how intense the person’s acute symptoms were, but it has more to do with where the person was at the time that they sought the test, what time in the pandemic it was, and what sorts of privilege they might have or not have within the healthcare system in terms of accessing a test. Like, do they have a car and can they drive themselves to get a test?
That [testing status] question comes up a lot. And I think that journalists, when asking about just testing status, a helpful thing to do is explain why you’re asking. You could say, “I’m going to include people of all testing statuses in this article, because I understand that not everyone who has Long COVID was able to get a positive test for an acute COVID infection. But just for the purposes of accuracy, I need to ask, are you someone who had a positive COVID test or did you not have a COVID test? Because I need to include those details.”
Also, some people on the list have specified different methods of interview that they are comfortable with. But it never hurts to ask and double check [about interview method]. There are people who have really intense screen sensitivity and light sensitivity, and so emailing is going to be more difficult for them. Then, there are other people for whom a Zoom call or phone call is actually going to be more difficult, and they’d prefer texting, or emailing, or audio messages. I know a lot of times there is sort-of a reticence with journalists to use methods other than a Zoom call. But a lot of Long COVID patients have been communicating super effectively using nontraditional means for the entire pandemic. So, have a bit of trust in their ability to do that.
BL: Are there any other things that you want journalists to know about talking to Long COVID patients?
FL: There are a lot of things! One other thing to keep in mind is that everybody has a different level of expertise on Long COVID. A lot of times, I’ll seen articles—or I’ve even been in this position—there are people on our list who have identified themselves as experts on Long COVID, or patient advocates, outside of just their lived experience. Those are people who can, yeah, they might be able to speak to their lived experience, but they’re also going to be able to speak to, like, what they’re seeing in their support group or their experience, trying to advocate for policy change.
And I think it’s a shame when the stories about those advocates focus only on their own health issues. That happens a lot, just because I think journalists have a hard time finding people who are willing to talk about their own health issues. But be aware that there are a lot of people who have really a higher level of expertise than just, “This is what happened to me in my body,” people who have taken a lot of care and a lot of time to read the latest research on Long COVID and are in touch with doctors and scientists and policymakers. I think treating those people as experts on the subject is important.
On the flip side, not every Long COVID patient is going to be able to speak to those macro issues, and not every Long COVID patient has the same understanding of what’s happening in their body. There are also a ton of people—and these people probably are not on our list, unfortunately—people who have Long COVID and don’t know what it is, or don’t know that it’s called Long COVID. So, knowing that people’s understandings will vary from individual to individual is important as well, I think.
And don’t be afraid to interview people with related illnesses! Again, dysautonomia is an incredibly common diagnosis, it seems, for people with Long COVID. But I haven’t really seen many articles that are interviewing other people who have lived with dysautonomia for ten years, or scientists who are studying it, or that sort of thing.
BL: Yeah. How would you like to see the source get used?
FL: We had a media inquiry today [via LongCovidSourceList@gmail.com] that excited me because it was about a really hyper-specific local story. I would love to see more of that. Because I think Long COVID is an illness that does radicalize a lot of people, through getting sick and seeing like, “Oh, no one’s there to take care of me, and the government doesn’t care.” And a lot of people who are angry are organizing in their communities, or they’re even advocating on behalf of themselves.
I think, in the coming decade, we’re going to learn about more and more of these people who have been doing this [organizing] on the local level. Like, I know of many people who have organized really small support groups in their town or in their city. So, I’d love to see more hyperlocal coverage of how Long COVID is impacting individual communities. I’d also love to see more coverage of caregivers and people with loved ones who have Long COVID, and how folks are navigating those relationships. Because I think there are so many lessons we can learn about disability and chronic illness and relationships in general from those stories.
And obviously, I’d love to see more diverse sources. Near the beginning of the pandemic, there was a period of time where there were a lot of stories about health disparities. And we were talking a lot more about the impact of COVID on undocumented populations, or Black and Latinx and Indigenous populations in the US, or the people in rural areas or inner city areas.
We haven’t really seen a lot of that coverage for Long COVID. Part of that is because no one’s tracking it on a nationwide level, like we don’t have the case counts for Long COVID that we have for COVID infections. But there’s still stories to be done [on this issue]. You can go into a community and all you really need is one person, one source that has Long COVID in that community, to understand: How is that community grappling with this condition? Does that person know anybody else who knows what Long COVID is? Is that person educating everyone in their community on what Long COVID is? How did that person find care? Is there a hospital near them? Those are the stories I’d really like to see more.
Those stories, with an emphasis on those populations that were hit hardest at the beginning of the pandemic, and are still hard-hit. Like, I saw the other day that in Los Angeles, where I am, homeless populations have some of the highest rates of COVID infections. That would be a really interesting story and a really important story to look at, what does long-term care look like for those populations?
BL: You mentioned the fact that Long COVID cases are not tracked the way so many other COVID metrics are—which, as a data journalist, I definitely consider to be one of the biggest data gaps of the pandemic. Are there any other stories that you would want to see in that vein, or any other coverage areas you would like to see around Long COVID?
FL: Yeah. I think this idea would take kind of the right type of journalist, probably someone with a deep knowledge of chronic illness communities; it would be interesting to delve into what I was talking about before, in terms of these additional diagnoses that [Long COVID patients] have received and/or self-diagnosed themselves with.
I’m also very curious about how people get diagnosed with Long COVID, because it seems to be happening in a different way with everyone. There are the people like me, where I don’t have a clinical diagnosis of Long COVID—I don’t think I do, maybe my doctor put something on my chart—but like, I just have a COVID PCR test, and then I have records of going for care for these other related problems. And then I have an additional diagnosis of this kind-of dysautonomia-related thing.
We do now have an ICD code for Long COVID. But I’m not exactly sure that it’s being used in all situations. And like, if someone gets diagnosed with ME/CFS, are they getting diagnosed with both those ICD codes, or does one diagnosis overrule the other one? So, I think there’s a lot of interesting stuff there. You could also delve into how common it is to self-diagnose and what that looks like when you end up going to the doctor at some point later on. This [story] can be done in a variety of ways. People could also write guides on, “How do you get an accurate diagnosis?” And, “What does a diagnosis mean in terms of your insurance coverage, or your eligibility for disability benefits?”
I think [disability benefits are] another thing that is going to be huge. I get a lot of emails from people with Long COVID who have been denied long-term disability. One person I was speaking to was from a Republican state, and she was saying, like, “I’m from a state where the government shut down all the COVID-related social programs earlier than in other states. Why would I believe the caseworker in my state is going to take my Long COVID disability case seriously?”
I think that’s an interesting thing, too. COVID was highly politicized. Long COVID isn’t highly political in the exact same way simply because it’s not something that everybody knows about and is talking about. But there’s that question: if we know that COVID infections and COVID care can sometimes differ state to state based on the political leadership and what sort of funding has been put into healthcare systems, how does that look for Long COVID? What does that mean for people applying for disability benefits? Are people in blue states having an easier time getting approved for long-term disability? Does it not matter? That sort of thing.
BL: Yeah, that’s a good point. Those were all of my questions—is there anything else that you think is important for people to know about this project or about using the list?
FL: Well, I’m curious—I know that you were writing about Long COVID and looking for sources, but I’m kind of curious why you wanted to participate in this project and why it felt important to you?
BL: I think that, as I said a bit ago, I feel like this is a really important data gap. There’s this feedback loop where, we don’t have really solid numbers about Long COVID, and so people don’t know about it, and so that contributes to the lack of numbers, and then it sort-of spirals in that way. And this [project] seemed like a way to combat that situation, at least a little bit. And also, I like making resources for other journalists, it’s part of the reason why [the COVID-19 Data Dispatch] exists, basically. This project felt like an extension of that goal.
FL: Yeah, that makes a lot of sense. I think there is an enormous desire for those of us who followed Long COVID from the beginning to see it get its due in the media. And I think, now that we’re entering year three, and we’re hearing that Omicron is potentially more mild—it just feels like, when is it going to be the time that we fully turn our attention to this? In terms of gathering the data and, and writing about it.
-
Featured sources, January 9
- COVID-19 Hospital Capacity Circuit Breaker Dashboard: This dashboard from emergency physician Dr. Jeremy Faust and colleagues shows which U.S. states and counties are operating at unsustainable levels, or are likely to get there in coming days. Faust further explains circuit breakers in this post: these are “short-term restrictions, regardless of vaccination status, designed to slow the spread of COVID-19” and help prevent hospitals from becoming overwhelmed. Dashboard data come from the CDC, HHS, and Johns Hopkins University.
- CDC Cruise Ship Color Status: Throughout the pandemic, cruise ships have been hotbeds for coronavirus spread. This is especially true right now, thanks to Omicron, and the CDC is investigating a number of outbreaks. The agency reports on all cruise ships that it’s monitoring for COVID-19, classifying them based on the number of cases reported among passengers and crew; as of January 7, the vast majority of ships have reported enough cases to meet the threshold for CDC investigation.
- Deaths and hospitalizations averted by vaccines: This December report from philanthropy foundation the Commonwealth Fund provides estimates on the severe COVID-19 cases prevented by the U.S. vaccination effort. Without vaccination, the report estimates, “there would have been approximately 1.1 million additional COVID-19 deaths and more than 10.3 million additional COVID-19 hospitalizations in the U.S. by November 2021.” (H/t Your Local Epidemiologist.)
-
Featured sources, December 26
- Holiday risk estimator: A group of data analysts at the Rockefeller Foundation’s Pandemic Prevention Institute put together this tool showing the risk of coronavirus exposure at an event or gathering, taking Omicron’s increased transmissibility into account. You can plug in your county and view your risk at 10, 20, and 30-person events, with adjustments for attendee vaccination and rapid testing. The tool will be updated daily through the end of December, according to analyst Kaitlyn Johnson, with potential further updates after that point.
- State Reporting of Covid-19 Vaccine Breakthrough Infections: Another source from the Rockefeller Foundation: researchers from the Pandemic Tracking Collective evaluated every state’s reporting of COVID-19 breakthrough cases. The evaluations include both the data fields states report and how information is presented. Only three states (California, Colorado, and Utah) scored an A; nine states that don’t share breakthrough case data regularly scored an F.
- POLITICO’s State Pandemic Scorecard: And another evaluation of how states fared, but much broader: POLITICO reporters compiled data about state outcomes during the COVID-19 pandemic, including health, economy, social well-being, and education. For each category, states are scored between zero and 100. “No state did well in every policy area,” the report finds; for example, some states that imposed more COVID-19 restrictions fared better on health but worse on economy and education.
-
The 21 best COVID-19 data stories of 2021
As 2021 comes to a close, I want to dedicate this final issue of the year to all of the other science, health, and data journalists who have continued following COVID-19 in the last twelve months. It hasn’t been easy, as burnout dovetails with declining public interest in pandemic news; still, so many people have stuck with this beat and brought important issues to light.
Here’s my list of the 21 best COVID-19 data stories of 2021. Disclaimer: this list is not comprehensive or objective—I selected these stories from my own readings of national and local outlets, combined with a couple of reader submissions. Still, I tried to include a variety of publications and story types, ranging from short news pieces to large investigative projects.
If you’d like to check out my 2020 list, you can find it here.
- The “Good” Metric Is Pretty Bad: Why It’s Hard to Count the People Who Have Recovered from COVID-19 (COVID Tracking Project, Jan. 13): This analysis post illuminates the issues behind tracking “recovered” COVID-19 patients, a metric that used to appear on many state dashboards. Amanda French and Quang Nguyen explore the inconsistent definitions that states use to track this metric—most COVID-19 metrics are inconsistent from one source to another, but “recovery” is particularly inconsistent—as well as how the metric excludes Long COVID patients. The post also explains why CTP removed many “recovered” values from its website.
- As Covid vaccine rollout expands, Black Americans still left behind (KHN/NBC, Jan. 29): While vaccines became more widely available throughout the early months of 2021, the CDC’s data on which Americans were getting vaccinated remained extremely limited. In fact, the agency has never released demographic vaccination data at the state-by-state level. KHN reporters Hannah Recht and Lauren Weber filled that gap by compiling data from state dashboards, while also reporting on the vaccine gap between Black and white Americans.
- As governor cherry-picked data, the pandemic took a toll on Florida Sunshine laws (Miami Herald, March 2): Throughout the pandemic, Florida has attracted attention—from Governor Ron DeSantis railing against mandates to the Florida Department of Health (FDOH) replacing its comprehensive COVID-19 dashboard with stripped-down weekly reports in June. This important Miami Herald article sheds light on FDOH’s reluctance to “release new data related to COVID-19 that contradicts the governor’s upbeat narrative,” hurting journalists’ and academics’ ability to hold the DeSantis administration accountable.
- The uncounted: People who are homeless are invisible victims of Covid-19 (STAT News, March 11): Usha Lee McFarling, national science correspondent at STAT News, has spent the year reporting on equity issues connected to COVID-19 and other areas of medicine. In this story, she investigates the lack of COVID-19 deaths reported among homeless populations. According to McFarling, one attempt to track these deaths resulted in a count of under 400, even though homeless shelters are prime locations for outbreaks.
- Why the Pandemic Experts Failed (The Atlantic, March 15): On March 7, the COVID Tracking Project updated its datasets for the last time. Shortly afterwards, founders Alexis Madrigal and Robinson Meyer wrote this story sharing lessons learned from a year of data collection, including the challenges of reporting COVID-19 data, the impact of America’s fractured public health systems, and what data can and can’t tell us. For more: check out the project’s analysis posts with further lessons and resources for using federal COVID-19 data.
- 3.9 million years (Vox, March 17): Typically, when we think about the losses of COVID-19, we think of the number of deaths. But there’s another metric we can use, beautifully explored in this Vox article: years of potential life lost. As of January 31, 2021, the U.S. has recorded about 420,000 deaths, amounting to 3.9 million years lost. The article includes an illustration of this toll, as well as personal stories from the family members of those who died.
- We Ran Tests on Every State’s COVID-19 Vaccine Website (The Markup, March 24): The Markup, a nonprofit newsroom that investigates big tech, is famous for its Blacklight tool, which scans websites for user-tracking technologies. In this story, The Markup ran that Blacklight tool on state websites built for users to make their vaccination appointments. The tool found that many sites had below-average privacy ratings and poor accessibility, likely contributing to the stress that many Americans felt in trying to book their vaccinations.
- A Tiny Number of People Will Be Hospitalized Despite Being Vaccinated. We Have to Learn Why. (ProPublica, April 14): ProPublica’s Caroline Chen was writing about breakthrough infections before it was cool—or, before Delta hit the U.S. and these infections became common. This article clearly explains what breakthrough infections are, why they’re so rare (at the time), and why they need to be investigated anyway, as scientists hope to find patterns in the breakthrough cases that lead to severe disease. At the time, many states were doing a poor job of data collection; this is still true, many months later.
- The First Billion Doses (Bloomberg, April 24): Since late 2020, a group of Bloomberg health and data journalists have run the most comprehensive dashboard on global COVID-19 vaccinations, including data from 184 countries and all U.S. states. It’s an immense undertaking, and has driven plenty of important reporting on vaccine rollouts nationally and globally—such as this story marking the first billion doses administered. The piece both celebrates this scientific achievement and highlights inequities: “Vaccine access so far has been determined by national wealth,” the story says.
- COMIC: For my job, I check death tolls from COVID. Why am I numb to the numbers? (NPR, April 25): This comic, by one of the reporters behind NPR’s COVID-19 dashboard, resonated deeply with me. It explores why one death may feel like a tragedy, but 500,000 deaths may feel like a natural part of the world. The comic ends by emphasizing the importance of reading individual people’s stories and maintaining connection, to cope with all of the trauma and loss of the past two years.
- Broken system can’t keep track of Native deaths (Indian Country Today, June 8): In this story, the Indigenous Investigative Collective explores how a “labyrinthian system of local, state, federal and tribal data-reporting systems” makes it difficult to accurately track how many Native Americans have died of COVID-19. As a result, the already-high official death toll is likely a significant undercount; and the problem goes beyond COVID-19 to other health issues.
- New CDC dataset showing COVID vaccine-by-county numbers misses the entire state of Texas. Why? (Houston Chronicle, June 23): For a long time, there was a Texas-shaped hole in the CDC’s dataset of COVID-19 vaccinations by county. This article, by Houston Chronicle reporter Kirkland An, digs into the issue and explains: a unique state law in Texas restricts sharing of individual data, including the anonymized vaccination records that the CDC requested from states in order to calculate county-level vaccination rates. To me, this is a great example of a local reporter diving into an issue that their region is facing in a national dataset. (And the data issue has since been fixed!)
- How Local Reporters in India Exposed the Pandemic’s True Death Toll (Global Investigative Journalism Network, June 28): This one is a bit meta: it’s an article about COVID-19 death investigations, carried out by journalists in India during the country’s severe spring 2021 surge. One reporter, Yogen Joshi, used counts of Hindu funeral rituals at a holy riverbed site to reveal that the true number of deaths in the state of Gujarat was much higher than the official record stated. Other journalists similarly investigated body counts and death certificates directly, showing how national data fell short.
- Meet the people who warn the world about new covid variants (MIT Technology Review, July 26): MIT Technology Review’s Pandemic Technology Project has produced a number of important COVID-19 stories this year (including my own!), but this one is my personal favorite. Cat Ferguson profiled a group of scientists who created and contributed to the Pango system for tracking coronavirus variants, racing to name and classify new sequences as soon as they’re uploaded into the public domain. This article demonstrates the human toll of running such an important database, particularly when it’s led by PhD students and postdocs who never anticipated the scale their project would attain.
- Inside America’s Covid-reporting breakdown (POLITICO, Aug. 15): At this point, most COVID-19 reporters are familiar with the challenges underlying our spotty pandemic numbers: public health agencies have long been underfunded, records are transmitted by fax and mail, data systems are inconsistent, workers are overwhelmed, etc. But few articles lay out the problems as clearly as this feature by POLITICO’s Erin Banco, who spoke to health officials in more than 20 states. The article also includes great data visualizations and graphics that illustrate the issues.
- Ahead Of NYC School Reopening, 1,500 Classrooms Still Undergoing Ventilation Repairs (Gothamist/WNYC, Aug. 30): By mid-2020, there was a growing scientific consensus that the coronavirus spreads through the air, and ventilation is an important means of increasing COVID-19 safety. Yet businesses and news cycles alike failed to focus on ventilation well into 2021—so I was very excited to see Gothamist’s thorough investigation of air filtration in New York City schools. This article is part one in an extensive series, combining city records with expert insights on air quality standards.
- How did a Kansas grandmother just become the first U.S. COVID death? Not even her family knew until this week (The Mercury News, Sept. 2): Sometimes, the best kind of data story is an investigation into one singular data point. This piece, published in Bay Area newspaper The Mercury News, tells the story of Lovell Brown, a senior in Leavenworth County, Kansas who is now the first recorded COVID-19 death in the U.S.—after her death certificate was amended in May 2021 to include the disease. While the exact reasons behind this death certificate update are unknown, the revision suggests that the coronavirus was spreading in the Kansas City area well before official data collection started.
- The fight to manufacture COVID vaccines in lower-income countries (Nature, Sept. 15): As someone who has been writing about global health long before COVID-19 hit, Amy Maxmen is an expert on the global vaccination beat. This story lays out the immense gap between vaccine access in high-income countries and low-income countries, while also explaining a potential solution: many manufacturers in low- and middle-income countries are ready to produce COVID-19 vaccines, if only they could get ahold of the patents. I’ve come back to reread this piece several times in the past few months, as booster shot campaigns in the U.S. and elsewhere have further exacerbated vaccine inequity.
- Opening Project conclusion: 11 lessons from the schools that safely reopened (COVID-19 Data Dispatch, Sept. 19): Yes, I snuck one of my own projects onto this list: the Opening Project, in which I identified and profiled five school communities that brought the majority of their students back to in-person learning by the end of the 2020-2021 school year while reporting fewer COVID-19 cases than the national average. For me, this project was a departure from past data journalism stories; instead of describing an overall trend with data, I focused on five outliers, investigating why they were successful. The project, which was funded with a grant from the Solutions Journalism Network, was republished at several education and science news outlets.
- Covid response hampered by population data glitches (Financial Times, Oct. 11): Vaccination rates—which show the percentage of a population that’s received at least one vaccine dose or been fully vaccinated—have been a key metric driving government COVID-19 responses in the past year. But when the population data underlying these calculations are inaccurate, this article by Oliver Barnes and John Burn-Murdoch explains, the vaccination rates can be way off. For example, some Miami, Florida ZIP codes have vaccination rates of over 200% among seniors, because snowbirds who don’t formally reside in the city got vaccinated there. (If you hit the Financial Times’ paywall, you can read my summary of the piece here.)
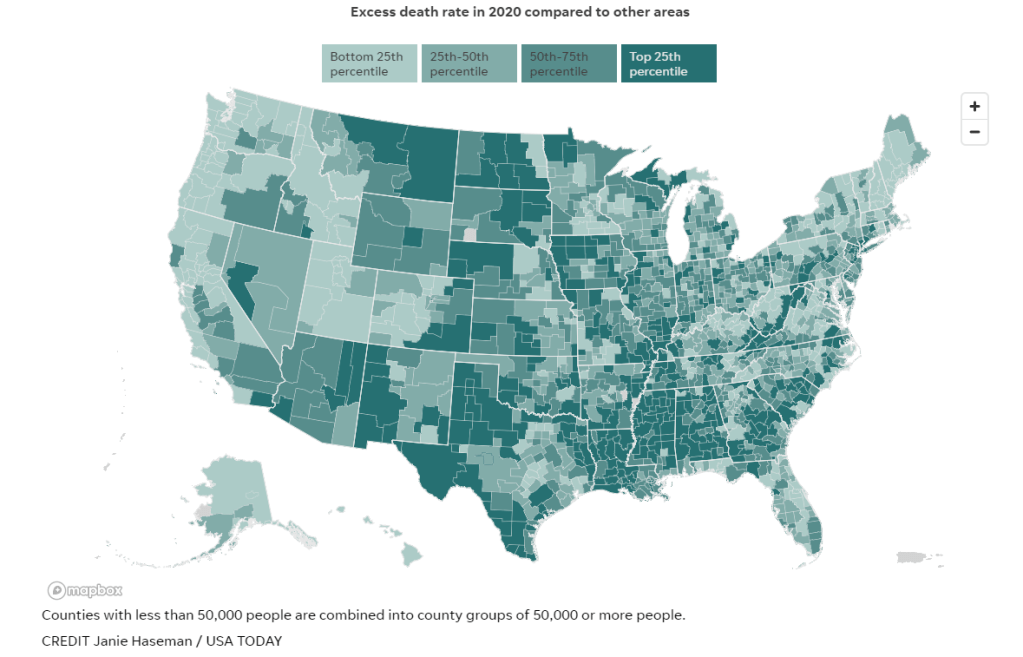
- Uncounted: Inaccurate death certificates across the country hide the true toll of COVID-19 (Documenting COVID-19 & USA Today, Dec. 22): For months, the Documenting COVID-19 team has worked with several USA Today newsrooms to investigate unreported COVID-19 deaths. While the official COVID-19 death toll in the U.S. is about 800,000, experts suspect that up to 200,000 additional deaths from the disease have gone uncounted, due to a combination of undertrained coroners and medical examiners, a lack of standardization for identifying these deaths, under-testing, and other issues with death certificates. I was part of the team behind this investigation, which will continue with further stories in 2022; you can read more about the CDC data that drove much of our analysis here.
Note: the featured image for this post is taken from the Uncounted project; it’s a visualization by Janie Haseman at USA TODAY.
-
Featured sources, December 19
- COVID-19 preventable mortality and leading cause of death ranking: The Peterson-KFF Health System Tracker has recently updated its analysis of preventable deaths from COVID-19 and the disease’s position among top causes of death in the U.S. In November 2021, COVID-19 was the #3 cause of death after heart disease and cancer. And, between June and November, more than 160,000 COVID-19 deaths could have been prevented with vaccinations.
- AARP analysis of nursing home data: AARP researchers have analyzed and visualized data showing staff shortages in nursing homes, along with vaccination rates, PPE availability, and other related figures. According to AARP’s analysis, almost one-third of the 15,000 nursing homes in the U.S. “recently reported a shortage of nurses or aides,” as of mid-November. (H/t Al Tompkins’ COVID-19 newsletter.)
- News workers laid off and outlets closed during the pandemic: At least 6,154 workers at news organizations were laid off between March 2020 and August 2021, according to a new report from Columbia Journalism Review. And at least 100 organizations closed during this time, though 14 have since resumed operations to some extent. The report includes detailed data on these layoffs and organization closures.
- Recommendations to transform public health data in the U.S.: The Robert Wood Johnson Foundation, a health philanthropy organization, has convened a commission of experts to reimagine how public health data are collected, shared, and used in the U.S. The commission put together this report, which includes recommendations ranging from data literacy to racial equity. While the report doesn’t include much data, per se, I wanted to include it in this week’s issue as a resource—and a source for potential story ideas.
- Science Literacy Resource Guide: The Science Literacy Foundation, a new nonprofit in the scicomm space, had compiled this database of science literacy-related resources. It includes resources specific to journalism, communication, education, policy, and research; the guide isn’t COVID-specific, but has a lot of utility for continued pandemic coverage. (Disclaimer: I’ve previously worked on a project for the Science Literacy Foundation, but was not involved with this guide.)
-
Sources and updates, December 12
- CDC adds booster shot trends to its dashboard: One significant update to the CDC’s COVID-19 dashboard this week: the agency has added daily booster shot administration trends to its Vaccination Trends page. Now, you can see how many booster shots are being given each day in your state; in New York, for example, I see clear jumps when eligibility opened to all adults, and when Omicron was identified after Thanksgiving.
- Global Health Security Index: Back in fall 2019, a group of public health and national security researchers put out an index that ranked 195 countries around the world on their capacity to respond to future health threats. The U.S. was ranked number one—a ranking that soon became laughable as the country proved to be incredibly unprepared for the COVID-19 pandemic. This week, the organization released their 2021 update to that index… and the U.S. is, somehow, still number one. Yet despite this, the researchers say, “no country is fully prepared for future pandemic or epidemic threats.”
- COVID Collaborative: Hidden Pain report: The COVID Collaborative is a team of health, education, and economic experts aiming to develop recommendations for U.S. leaders. Their recent Hidden Pain report focuses on children who lost parents or caretakers to COVID-19—a group that, the report estimates, includes over 167,000 children across the country.
- State Alcohol-Related Laws During COVID-19: The Alcohol Policy Information System has compiled a database of alcohol-related state laws during the pandemic, including rules about drinking both inside and outside of bars and restaurants. The database allows you to see when a specific state allowed restaurants to open or close, restrictions for take-out only, shortened hours, and more. (H/t Data Is Plural.)
