Tag: breakthrough cases

  • The future of COVID-19 vaccines needs more data

    The future of COVID-19 vaccines needs more data

    The FDA recommends that the U.S. shifts to annual COVID-19 vaccines, with a variety of data sources feeding into decision-making. Screenshot from the VRBPAC meeting on January 26, 2023.

    On Thursday, the FDA’s Vaccines and Related Biological Products Advisory Committee (or VRBPAC) met to discuss the future of COVID-19 vaccines. While the committee readily agreed that our current, Omicron-specific shots are working well and should be used more broadly, it had a hard time answering other questions about future vaccine regimens—largely due to a lack of good data.

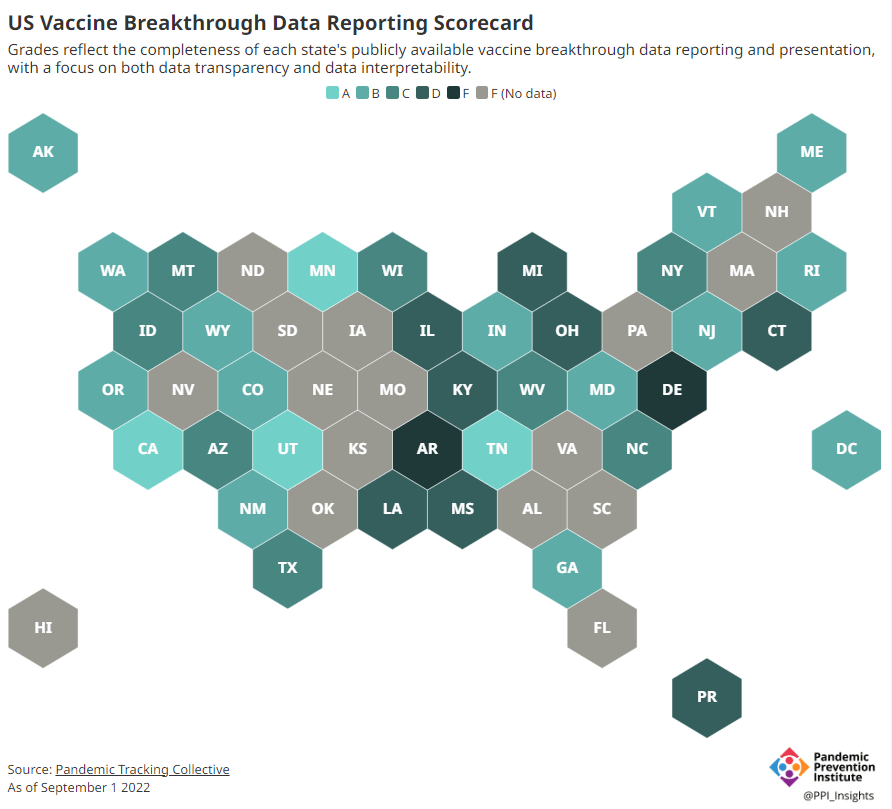
    Now, the lack of good U.S. data on vaccine effectiveness is not a new problem. I personally have been writing about this since fall 2021, to the point that I feel like a broken record for bringing it up again. To summarize: the U.S. has a fractured health system in which every state tracks vaccinations differently, with a lot of local public health departments and private companies in the mix, too. As a result, it’s challenging for researchers to determine exactly who is getting COVID-19 after vaccination and how the virus is impacting them.

    This lack of detailed vaccine effectiveness data was a problem in fall 2021, when federal officials decided on an initial round of booster shots. And it’s still a problem in winter 2023, as the same officials attempt to plot out a future in which COVID-19 is another disease that we deal with on an annual basis.

    But this week’s VRBPAC meeting revealed some other areas of data that are also lacking as we try to answer questions about future vaccines. Here’s my summary of five primary data gaps that came up at the meeting, and some suggestions for potential solutions.

    Detailed vaccine effectiveness data

    The biggest data gap, of course, is our lack of answers to the question: Who is getting sick with COVID-19 after vaccination? And related questions: How sick did they get? Which variants did they get sick with? What preexisting conditions or comorbidities did they have?

    Our lack of standardized medical data in the U.S. makes it tough to answer these questions at the population level. Analyzing variants is particularly tricky, given that variant surveillance in the U.S. tends to be entirely anonymized—with no connections between the genomic sequencing of random PCR tests and the health outcomes (or vaccination statuses) of those patients. And analyzing preexisting conditions can be crucial as officials try to decide which groups of people need extra boosters, but these conditions often are not collected in standard databases or linked to COVID-19 records.

    As a result, U.S. officials tend to rely on other countries with more comprehensive, standardized data systems for information on how well the vaccines work. We also have to rely on the pharmaceutical companies producing these vaccines, which often don’t openly share their data—they tend to present clinical trial results in press releases, over peer-reviewed studies. Companies also tend to do trials that align better with their own financial interests, rather than looking at the full scope of vaccine effectiveness.

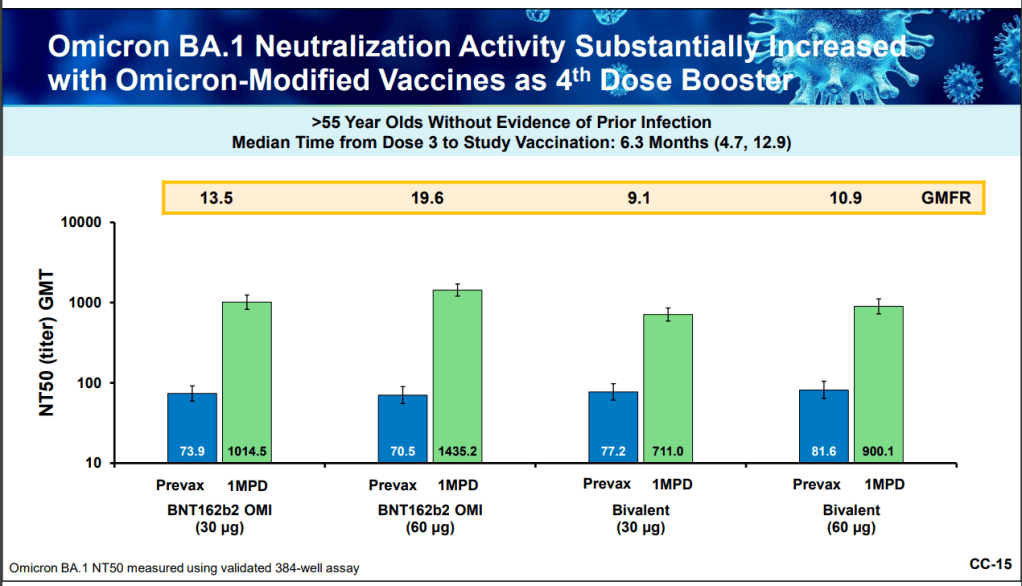
    Even in this week’s VRBPAC meeting, scientists from Moderna presented results from a clinical trial—conducted in the U.K.—that tested the company’s bivalent boosters against the original (non-Omicron) boosters.

    Better tracking of variants

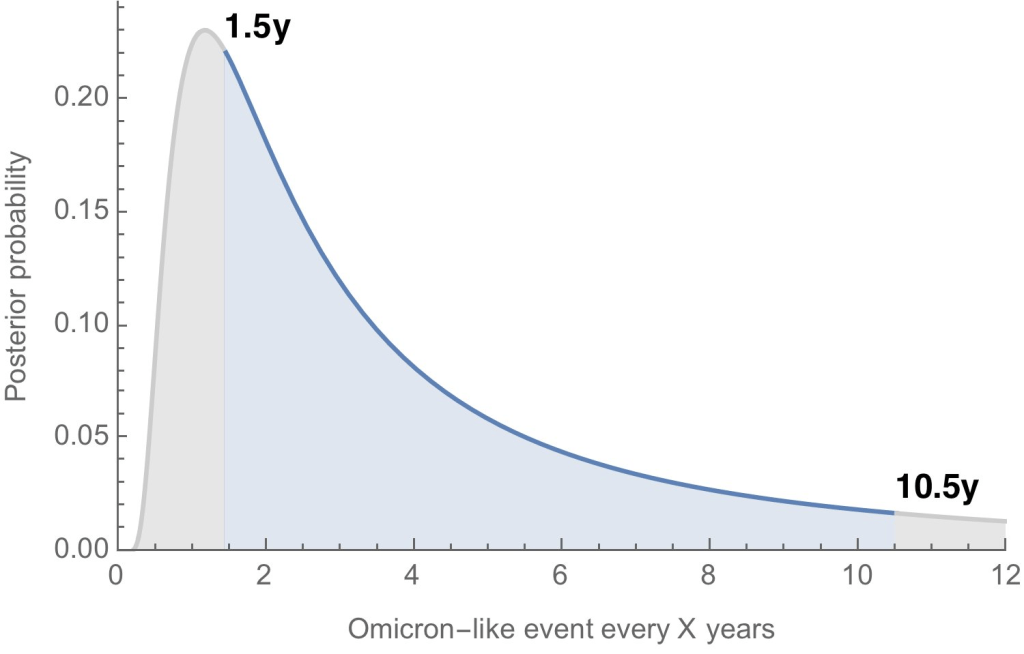
    The primary reason why our COVID-19 vaccines require updates in the first place is the coronavirus’ continued evolution. Every new lineage of Omicron that rises to prevalence is either a bit better at spreading quickly, a bit better at evading immunity from prior infection or vaccination, or both. To successfully tweak our vaccines in the future, scientists will need to know which variants are out there and how dangerous they are.

    Right now, variant tracking largely relies on PCR testing, as researchers randomly select some swab samples to sequence. But with fewer and fewer people getting PCR tests, the sample pool is dwindling. As a result, to stay ahead of new variants, the U.S. needs to diversify its surveillance options. That will likely include more variant sequencing from wastewater (as a population-level COVID-19 sample), more sequencing at hospitals and healthcare centers, and more travel surveillance focused on international variant patterns.

    Variant surveillance will also need to inform how suited U.S.-developed COVID-19 vaccines are for the rest of the world. Right now, the pharmaceutical companies that have produced the most effective vaccines (i.e. Pfizer and Moderna) are American—so American regulators are essentially dictating vaccine policy for the world, even though their priority is the U.S. FDA official Jerry Weir said as much at the meeting. U.S. hegemony over COVID-19 vaccines will continue to be a complex, fraught topic going forward.

    Tracking different types of immunity

    At the VRBPAC meeting, Moderna, Pfizer, and Novavax all presented data on how well their vaccines work against currently-dominant coronavirus variants. While they included some clinical data (case rates, hospitalization rates), the presentations mostly focused on one metric: antibody titers. To calculate if a vaccine works against a certain variant, the easiest strategy is measuring the antibodies produced after a vaccinated blood sample is exposed to that variant.

    While this is the easiest strategy, it’s far from the only way to examine how well a vaccine works. Members of the VRBPAC committee frequently asked the pharmaceutical companies for those other metrics: T cells, B cells, and more ways of measuring the immune system’s response to COVID-19. But the companies had little response to these questions. Even FDA and NIH officials at the meeting admitted that they still didn’t have a good understanding of how, exactly, our current vaccines impact our immune systems, beyond generating antibodies.

    To better evaluate future vaccines, scientists will need to get better at measuring other aspects of our immune responses. That includes future mRNA vaccines as well as next-generation vaccines in the works right now, such as nasal vaccines (recently authorized in China and India) and vaccines designed to protect against all variants (currently in development at Duke University and other institutions).

    I also think it’s worth noting that, as Katelyn Jetelina writes in her coverage of the VRBPAC meeting at Your Local Epidemiologist, the FDA could require pharmaceutical companies to study the immune system more holistically when they submit further vaccine updates for authorization. “The FDA could require sponsors to do detailed investigations, e.g. assessing lymph nodes, bone marrow, and breakthroughs,” she writes. “This would help us understand immunity better, so we can make better recommendations. It’s not clear why they aren’t pushing for this.”

    Improving vaccine safety tracking

    Two years after the first COVID-19 vaccines were authorized, we now know that the vaccines are overwhelmingly safe and effective. Most people have mild side effects following their shots, like sore arms and fatigue, but the benefits of getting vaccinated far outweigh the risks. However, some discussion at the VRBPAC meeting indicated that federal agencies could do a better job of tracking rare (yet important) serious side effects.

    For example, a safety presentation from the Kaiser Permanente Vaccine Study Center suggested that there might be a small increase in stroke risk for older adults who get vaccinated. The risk has only appeared in one vaccine safety database so far and appears to be minimal, per the FDA, but it’s still worth closer examination.

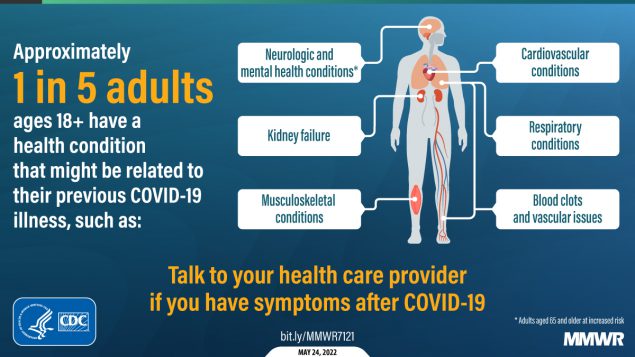
    In addition, as Helen Branswell and Matthew Herper discuss in the STAT News liveblog, the VRBPAC meeting didn’t present much new data about vaccine safety risks for children, such as myocarditis among boys and young men. Plus, we have limited data so far on whether vaccination may contribute to autoimmune conditions or Long COVID-like symptoms, a problem that has shown up in some studies and anecdotal reports.

    If public health officials are going to continue encouraging Americans to get COVID-19 shots once a year (or more), they will need to thoroughly address concerns about these potential side effects. This is particularly true for young children, a group that’s been vaccinated at fairly low numbers so far.

    Navigating COVID-19’s interactions with other vaccines

    At the VRBPAC meeting, FDA officials suggested a potential future in which most Americans get one COVID-19 vaccine per year, on a similar timeline to the annual flu shot. Variant strains might be selected in the spring or summer, with vaccines developed and produced in time for a fall vaccination campaign. Some at-risk groups (older adults, people with compromised immune systems, etc.) might get two doses each year.

    To make this possible, the VRBPAC committee members suggested that we’ll need to track how COVID-19 vaccines intersect with other vaccines. For example, if an older adult receives their flu shot and COVID-19 shot in the same doctor’s visit, does that dampen how well one or the other vaccine works? Does it increase the risks of severe side effects? We don’t know, at this point.

    Another major area of future study will be how COVID-19 vaccines may fit into regular, childhood immunization schedules for young kids. Similarly to the COVID-19 plus flu question, scientists will need to track any potential interactions between COVID-19 shots and other regular shots—along with answering questions about how many shots are needed, timing between shots, and more.

    One day, I’m sure, we will have a regular COVID-19 vaccination schedule in the U.S. that runs parallel to our flu vaccination schedule. But it will take time, discussions, and a lot more data to get there.

    More vaccination data

  • Sources and updates, December 11

    • 2022 America’s Health Rankings released: This week, the United Health Foundation released its 2022 edition of America’s Health Rankings, a comprehensive report providing data for more than 80 different health metrics at national and state levels. The 2022 report includes new metrics tailored to show COVID-related disparities; for example, Black and Hispanic Americans had higher rates of losing friends and family members to COVID-19 compared to other groups. I’ve used data from past iterations of this report in stories before, and I’m looking forward to digging into the 2022 edition.
    • FDA authorizes bivalent boosters for young kids: This week, the FDA revised the emergency use authorizations (EUAs) of both Pfizer’s and Moderna’s updated, Omicron-specific booster shots to include children between six months and five years old. Kids who previously got two shots of Moderna’s vaccine for this age group can receive a bivalent booster two months later, while kids who got two shots of Pfizer’s vaccine can receive a bivalent booster as their third dose. (Remember, Pfizer’s vaccine for this age group includes three doses.) The updated EUAs will help protect young children from Omicron infection, though uptake will likely be low.
    • CDC updates breakthrough case data: Speaking of the updated boosters: the CDC recently added data on these shots to its analysis of COVID-19 cases and deaths by vaccination status. In September, people who had received a bivalent, Omicron-specific boosters had a 15 times lower risk of dying from COVID-19 compared to unvaccinated people; and in October, bivalent-boosted people had a three times lower risk of testing positive compared to the unvaccinated. The CDC will update these data on a monthly basis.
    • Director Walensky discusses authority challenges: One bit of coverage from the Milken Future of Health Summit that caught my attention: CDC Director Dr. Rochelle Walensky talked about the agency’s limitations in collecting data from states, reports Rachel Cohrs at STAT News. Walensky specifically highlighted the challenges that the CDC might face in collecting data when the public health emergency for COVID-19 ends, something I’ve previously covered in this publication.
    • Boston establishes neighborhood-level wastewater testing: Finally, one bit of wastewater surveillance news: the city of Boston is setting up 11 new sites to test wastewater, giving local public health officials more granular information about how COVID-19 is spreading in the region. The new initiative is a partnership with Biobot Analytics, the same wastewater testing company that has long worked with Boston, the CDC, and public health institutions across the country. (Boston was one of the first cities to start doing this testing.) Also, speaking of Biobot: the company just added a nice chart of coronavirus variants in U.S. wastewater over time to its dashboard.

  • Sources and updates, December 4

    • CDC awards $3 billion to improve public health infrastructure: The CDC announced this week that it has awarded state and local public health agencies a total of $3.2 billion to support hiring and training new workers, along with other infrastructure needs. The agency published a breakdown of all the agencies that received awards, although it has not included specific details on what funds will be used for in each place. Local reporters, if your health department received funding, this might be worth looking into!
    • CDC expands wastewater testing for polio: Another notable CDC announcement this week: the agency is expanding its wastewater surveillance for polio to two new areas, Oakland County, Michigan and Philadelphia. Testing wastewater for polio is more complicated than testing it for the coronavirus, as STAT News’ Helen Branswell explains in this article; as a result, the CDC is expanding this surveillance in a more limited capacity than what it’s doing for other viruses, like monkeypox and the flu.
    • Majority of COVID-19 deaths are now among vaccinated people: A new report from the Kaiser Family Foundation explains why more than 50% of COVID-19 deaths in the U.S. in recent months were among people who had received at least two vaccine doses. According to KFF, factors driving this trend include the rising share of Americans who are vaccinated, waning protection from initial doses, and low uptake of booster shots—particularly of the Omicron-specific boosters that provide better protection against newer variants. More reason to get the new booster if you haven’t yet!
    • Paid sick leave correlates with higher vaccination rates: Speaking of vaccination: a new study from researchers at Drexel University and Boston University found that large U.S. cities with city-wide paid sick leave policies had higher vaccination rates than those without such policies. The correlation was particularly evident in neighborhoods with higher social vulnerability, the researchers found. Expanding paid sick leave could help reduce inequities in vaccination coverage, the paper’s authors recommend.
    • No monoclonal antibody drugs are currently authorized in the U.S.: This week, the FDA announced that bebtelovimab, a monoclonal antibody made by Eli Lilly, is no longer authorized for COVID-19 treatments in the U.S. The drug was designed based on older versions of the Omicron variant and doesn’t perform well against BQ.1 and BQ.1.1, the sublineages that are currently causing the majority of new cases in the U.S. As a result, no monoclonal antibodies are currently authorized, though Paxlovid and other treatments are still available.

  • Potential data fragmentation when the federal COVID-19 public health emergency ends

    Potential data fragmentation when the federal COVID-19 public health emergency ends

    About half of U.S. states have D or F grades on their breakthrough case reporting, according to the Pandemic Prevention Institute and Pandemic Tracking Collective. Other metrics could be heading in this direction next year.

    COVID-19 is still a public health emergency. At the moment, this is true according to both the general definition of this term and official declarations by the federal government. But the latter could change in the coming months, likely leading to more fragmentation in U.S. COVID-19 data.

    A reader recently asked me about the federal government’s ability to compile and report COVID-19 data, using our new anonymous Google form. They asked: “Will the CDC at some point stop reporting COVID data even though it may still be circulating, or is it a required, reportable disease?”

    It’s difficult to predict what the CDC will do, as we’ve seen in the agency’s many twists and turns throughout the pandemic. That said, my best guess here is that the CDC will always provide COVID-19 data in some form; but the agency could be severely limited in data collection and reporting based on the disease’s federal status.

    The CDC’s authority

    One crucial thing to understand here is that the CDC does not actually have much power over state and local public health departments. It can issue guidance, request data, distribute funding, and so forth, but it isn’t able to require data collection in many circumstances.

    Here’s Marc Lipsitch, an epidemiologist at Harvard’s public health school and interim director of science at the CDC’s Center for Forecasting and Outbreak Analytics, explaining this dynamic. This quote is from an interview that I conducted back in May for my FiveThirtyEight story on the new center:

    Outside of a public health emergency, CDC has no authority to require states to share data. And even in an emergency, for example, if you look on the COVID Data Tracker, there are systems that have half the states or some of the states. That’s because those were the ones that were willing to share. And that is a very big handicap of doing good modeling and good tracking… Everything you’re trying to measure, for any decision, is better if you measure it in all the states.

    Consider breakthrough cases as one example. According to the Pandemic Prevention Institute’s scorecard for breakthrough data reporting, about half of U.S. states have D or F grades, meaning that they are reporting zero or very limited data on post-vaccination COVID-19 cases. The number of states with failing grades has increased in recent months, as states reduce their COVID-19 data resources. As a result, federal agencies have an incomplete picture of vaccine effectiveness.

    Wastewater data is another example. While the CDC is able to compile data from all state and local public health departments with their own wastewater surveillance systems—and can pay Biobot to expand the surveillance network—the agency has no ability to actually require states to track COVID-19 through sewage. This lack of authority contributes to the CDC’s wastewater map still showing many empty spaces in states like Alabama and North Dakota.

    The COVID-19 public health emergency

    According to the Department of Health and Human Services (HHS), a federal public health emergency gives the HHS and CDC new funding for health measures and the authority to coordinate between states, among other expanded powers.

    During the COVID-19 pandemic, the federal emergency was specifically used to require data collection from state health departments and individual hospitals, POLITICO reported in May. According to POLITICO, the required data includes sources that have become key to our country’s ability to track the pandemic, such as:

    • PCR test results from state and local health departments;
    • Hospital capacity information from individual healthcare facilities;
    • COVID-19 patients admitted to hospitals;
    • COVID-19 cases, deaths, and vaccination status in nursing homes.

    The federal COVID-19 public health emergency is formally controlled by HHS Secretary Xavier Becerra. Becerra most recently renewed the emergency in July, with an expiration date in October. Health experts anticipate that it will be renewed again in October, because HHS has promised to give states a 60-day warning before the emergency expires and there’s been no warning for this fall. That leaves us with a new potential expiration date in January 2023.

    CDC officials are seeking to permanently expand the agency’s authority to include this data collection—with a particular priority on hospitalization data. But that hasn’t happened yet, to the best of my knowledge. So, what might happen to our data when the federal emergency ends?

    Most likely, metrics that the CDC currently requires from states will become voluntary. As we see right now with breakthrough cases and wastewater data, some states will probably continue reporting while others will not. Our federal data will become much more piecemeal, a patchwork of reporting for important sources such as hospitalizations and lab test results.

    It’s important to note here that many states have already ended their own public health emergencies, following a trend that I covered back in February. Many of these states are now devoting fewer resources to free tests, contact tracing, case investigations, public data dashboards, and other data-related efforts than they were in prior phases of the pandemic. New York was the latest state to make such a declaration, with Governor Kathy Hochul letting her emergency powers expire last week.

    How the flu gets tracked

    COVID-minimizing officials and pundits love to compare “endemic” COVID-19 to the flu. This isn’t a great comparison for many reasons, but I do think it’s helpful to look at how flu is currently tracked in the U.S. in order to get a sense of how COVID-19 may be tracked in the future.

    The U.S. does not count every flu case; that kind of precise tracking on a large scale was actually a new innovation for COVID-19. Instead, the CDC relies on surveillance networks that estimate national flu cases based on targeted tracking.

    There are about 400 labs nationwide (including public health labs in all 50 states) participating in flu surveillance via the World Health Organization’s global program, processing flu tests and sequencing cases to track viral variants. Meanwhile, about 3,000 outpatient healthcare providers in the U.S. Outpatient Influenza-like Illness Surveillance Network provide the CDC with flu-related electronic health records. You can read more about both surveillance programs here.

    Sample CDC flu reporting from spring 2020. The agency provides estimates of flu activity rather than precise case numbers.

    The CDC reports data from these surveillance programs on a dashboard called FluView. As you can see, the CDC provides estimates about flu activity by state and by different demographic groups, but the data may not be very granular (eg. no estimates by county or metro area) and are provided with significant time delays.

    Other diseases are tracked similarly. For example, the CDC will track new outbreaks of foodborne illnesses like E. coli when they arise but does not attempt to log every infection. When researchers seek to understand the burden of different diseases, they often use hospital or insurance records rather than government data.

    One metric that I’d expect to remain unchanged when the COVID-19 emergency ends is deaths: the CDC’s National Center for Health Statistics (NCHS) comprehensively tracks all deaths through its death certificate system. But even provisional data from NCHS are reported with a delay of several weeks, with complete data unavailable for at least a year.

    Epidemiologists I’ve interviewed say that we should be inspired by COVID-19 to improve surveillance for other diseases, rather than allowing COVID-19 to fall into the flu model. Wastewater data could help with this; a lot of wastewater researchers (including those at Biobot) are already working on tracking flu and other diseases. But to truly improve surveillance, we need more sustained investment in public health at all levels—and more data collection authority for the CDC and HHS.

    More federal data

  • We need more data for fall booster decisions

    We need more data for fall booster decisions

    At the FDA advisory committee meeting this week, Pfizer presented data from different options of Omicron-specific booster shots.

    This week, the FDA’s vaccine advisory committee met to discuss fall booster shots, in anticipation of another COVID-19 surge next winter. The discussion demonstrated the U.S.’s continued failure to provide the data that are really needed to make these decisions.

    I have written a lot about this topic in the past, so to avoid being too repetitive, I’ll link to a couple of past articles:

    But here’s the TL;DR: due to the fractured nature of America’s public health system, it’s difficult for researchers to connect data on different health metrics. For example, a state might have one database with vaccination records and another database with case records, and the databases might not easily link to answer questions about breakthrough cases.

    Some state health departments have figured out how to make these links, but the process is not uniform. And the breakthrough case data we do have generally aren’t linked to information on variants, or demographic data, or outcomes like Long COVID.

    The more specific the vaccine effectiveness question, the more complicated it becomes to answer. This is a bigger problem now as the FDA considers fall boosters, because the agency needs to determine the best vaccine candidate and identify priority populations for shots—while operating in a politcal climate where vaccine funding is less popular than it was a year ago.

    Here are a few questions that the FDA is trying to answer, drawing from the STAT News meeting recap:

    • Should the fall booster be a monovalent vaccine, meaning it only includes Omicron-specific genetic material? Or should it be bivalent, meaning it includes both Omicron and the original, Wuhan strain? Pfizer and Moderna presented different options; some experts say a bivalent vaccine may provide more long-term protection.
    • Should the booster shot be specific to BA.4 and BA.5? The panel agreed that it should, as these strains are now dominant in the U.S., but there’s a timing trade-off as vaccine companies have yet to do clinical trials (or provide substantial data) for a subvariant-specific vaccine.
    • Should the booster shot be another type of vaccine entirely? In addition to Pfizer and Moderna, the FDA panel also heard from Novavax. This company has developed a protein-based vaccine that hasn’t yet received FDA authorization, but panelists were impressed by its potential for long-term protection.
    • How well do the vaccines provide non-antibody-based protection? As in past advisory committee meetings, the vaccine companies primarily presented data based on antibodies generated from their shots. Experts wanted to see more data about T cells and other aspects of immunity which are harder to measure, but may be more important in the long term.
    • Who would most benefit from another booster? If the federal government isn’t able to buy enough shots for everyone, priortization will need to happen. Will Omicron-specific boosters be most useful for seniors, or for people with certain health conditions? These groups will likely get priority again, though we could still be collecting more data on how the vaccines fare for them.

    Of course, despite the dearth of data and cautions from some members of the FDA advisory committee, the U.S. government seems to be going full-speed ahead with fall boosters. The Biden administration has placed a $3.2 billion order from Pfizer for 105 million doses of whichever Omicron-specific vaccine the FDA chooses to authorize.

    More vaccine reporting

  • New Long COVID studies demonstrate danger of breakthrough cases

    New Long COVID studies demonstrate danger of breakthrough cases

    About one in five adults who have COVID-19 will face a health condition potentially related to long-term symptoms, a new CDC study found.

    Two new studies on Long COVID, published this week, provide an important reminder of the continued dangers this condition poses to people infected with the coronavirus—even after vaccination. Neither study provides wholly new information, but both are more comprehensive than many other U.S. papers on this condition as they’re based on large databases of electronic health records.

    First: a team at the Veterans Affairs (VA) Health Care System in St. Louis, Missouri used the VA’s extensive health records database to study breakthrough COVID-19 cases. The VA database includes more than 1,400 healthcare facilities serving veterans across the country; this St. Louis team has previously used it to characterize Long COVID symptoms more broadly, to study long-term heart disease risks of COVID-19, and for other research.

    In the new paper, published this week in Nature Medicine, the researchers put together a cohort of about 34,000 people who had breakthrough COVID-19 infections. They compared this group to larger control groups of people who hadn’t been infected and people who had been infected prior to vaccination, along with comparisons to the seasonal flu.

    Vaccination does reduce the risk of Long COVID, the researchers found: people with breakthrough cases were 15% less likely to report Long COVID symptoms than those who were infected prior to vaccination. Breakthrough Long COVID patients were notably less likely to have blood clots and respiratory symptoms than non-breakthrough patients.

    But a risk reduction of 15% is pretty minimal, compared to the protection that vaccination offers against COVID-related hospitalization and death. Moreover, for most Long COVID symptoms, patients who had breakthrough infections showed relatively little difference to those who had non-breakthroughs, the researchers found.

    “Overall, the burden of death and disease experienced by people with breakthrough SARS-CoV-2 infection is not trivial,” lead researcher Dr. Ziyad Al-Aly wrote in a Twitter thread summarizing the study. That’s scientist speak for, “A breakthrough COVID-19 case can really fuck you up in the long term!” Later in his thread, Dr. Al-Aly advocated for additional public health measures—beyond simply vaccines—to reduce Long COVID risks.

    And second: a paper from the CDC’s COVID-19 Emergency Response Team, published in the CDC’s Morbidity and Mortality Weekly Report (MMWR) last week, used electronic health records to examine overall Long COVID risk after an infection. These health records came from Cerner Real-World Data, a dataset including about 63.4 million records from over 100 health providers.

    The CDC researchers identified about 353,000 adults who had received either a COVID-19 diagnosis or a positive test result between March 2020 and November 2021. They matched this group of COVID-19 patients with a larger cohort of people who hadn’t tested positive, then looked at the COVID-19 patients’ risks of developing further symptoms more than a month after they were diagnosed.

    The findings are striking: About one in five COVID-19 survivors between the ages of 18 and 64 developed at least one “incident condition” (or, prolonged symptoms) that could be connected to their coronavirus infection. For COVID-19 survivors over age 65, that risk is one in four.

    Among the patients who potentially developed Long COVID, common symptoms were blockages in the lungs and other respiratory issues. Seniors were also likely to develop neurological and mental health symptoms, and the CDC researchers warned that Long COVID in this older age group could be linked to an increased risk of strokes and neurocognitive conditions, such as Alzheimers.

    In their paper, the CDC authors noted that patients represented in this health records database may not represent the U.S. overall, and that the methods used to identify possible Long COVID symptoms might be “biased toward a population that is seeking care.” Similar caveats apply to the VA study.

    Still, both studies clearly show the risk of just “letting COVID-19 rip” through the U.S. population, even after widespread vaccination. Studies like these should be headlines in every news publication, warning people that COVID-19 is not as mild as many of our leaders would like us to believe.

    Also, for journalists covering the pandemic: I highly recommend listening to this interview with Long COVID journalist and advocate Fiona Lowenstein, which aired on the WNYC show On the Media this weekend. (And I’m not just saying that because they plugged my recent story on the RECOVER study!) The Long COVID source list that Fiona and I collaborated on also continues to be a great resource for reporters covering this topic.

    More Long COVID reporting

  • The US still doesn’t have the data we need to make informed decisions on booster shots

    The US still doesn’t have the data we need to make informed decisions on booster shots

    How often will we see new variants like Omicron, that are incredibly different from other lineages that came before them? According to Trevor Bedford, it could be between 1.5 and 10.5 years.

    Last fall, I wrote—both in the COVID-19 Data Dispatch and for FiveThirtyEight—that the U.S. did not have the data we needed to make informed decisions about booster shots. Several months later, we still don’t have the data we need, as questions about a potential BA.2 wave and other future variants abound. Discussions at a recent FDA advisory committee meeting made these data gaps clear.

    Our country has a fractured public health system: every state health department has its own data systems for COVID-19 cases, vaccinations, and other metrics, and these data systems are often very difficult to link up with each other. This can make it difficult to answer questions about vaccine effectiveness, especially when you want to get specific about different age groups, preexisting conditions, or variants.

    To quote from my November FiveThirtyEight story:

    In the U.S., vaccine research is far more complicated. Rather than one singular, standardized system housing health care data, 50 different states have their own systems, along with hundreds of local health departments and thousands of hospitals. “In the U.S., everything is incredibly fragmented,” said Zoë McLaren, a health economist at the University of Maryland Baltimore County. “And so you get a very fragmented view of what’s going on in the country.”

    For example, a database on who’s tested positive in a particular city might not be connected to a database that would reveal which of those patients was vaccinated. And that database, in turn, is probably not connected to health records showing which patients have a history of diabetes, heart disease or other conditions that make people more vulnerable to COVID-19.

    Each database has its own data fields and definitions, making it difficult for researchers to integrate records from different sources. Even basic demographics such as age, sex, race and ethnicity may be logged differently from one database to the next, or they may simply be missing. The Centers for Disease Control and Prevention, for instance, is missing race and ethnicity information for 35 percent of COVID-19 cases as of Nov. 7.*

    *As of April 9, the CDC is still missing race and ethnicity information for 35% of COVID-19 cases.

    This past Wednesday, the FDA’s Vaccines and Related Biological Products Advisory Committee (VRBPAC) met to discuss the future of COVID-19 booster shots. Notably, this committee didn’t actually need to vote on anything, since the FDA and CDC had already authorized a second round of boosters for Americans over age 50 and immunocompromised people the week before. 

    When asked why the FDA hadn’t waited to hear from its advisory committee before making this authorization decision, vaccine regulator Peter Marks said that the agency had relied on data from the U.K. and Israel to demonstrate the need for more boosters—combined with concerns about a potential BA.2 wave. The FDA relied on data from the U.K. and Israel when making its booster decision in the fall, too; these countries, with centralized health systems and better-organized data, are much more equipped to track vaccine effectiveness than we are.

    With that authorization of second boosters for certain groups already a done deal, the VRBPAC meeting this past Wednesday focused more on the information we need to make future booster decisions. Should we expect annual COVID-19 shots, like we do for the flu? What about shots that are designed to combat specific variants? A lot of this is up in the air right now, the meeting discussion indicated.

    Also up in the air: will the FDA ever host a virtual VRBPAC meeting without intensive technical difficulties? The meeting had to pause for more than half an hour to sort out a livestream issue.

    Here are some vaccine data questions that came up on Wednesday, drawing from my own notes on the meeting and the STAT News liveblog:

    • How much does protection from a booster shot wane over time? We know that booster shots increase an individual’s protection from a coronavirus infection, symptoms, hospitalization, and other severe outcomes; CDC data presented during the VRBPAC meeting showed that, during the Omicron surge, Americans who were boosted were much more protected than those with fewer doses. But we don’t have a great sense of how long these different types of protection last.
    • How much does booster shot protection wane for different age groups? Waning immunity has been a bigger problem among seniors and immunocompromised people, leading to the FDA’s decision on fourth doses for these groups. But what about other age groups? What about people with other conditions that make them vulnerable to COVID-19, like diabetes or kidney disease? This is less clear.
    • To what degree is waning immunity caused by new variants as opposed to fewer antibodies over time? This has been a big question during the Delta and Omicron surges, and it can be hard to answer because of all the confounding variables involved. In the U.S., it’s difficult to link up vaccine data and case data; tacking on metrics like which variant someone was infected with or how long ago they were vaccinated often isn’t possible—or if it is possible, it’s very complicated. (The U.K. does a better job of this.)
    • Where will the next variant of concern come from, and how much will it differ from past variants? Computational biologist Trevor Bedford gave a presentation to VRBPAC that attempted to answer this question. The short answer is, it’s hard to predict how often we’ll see new events like Omicron’s emergence, in which a new variant comes in that is extremely different from the variants that preceded it. Bedford’s analysis suggests that we could see “Omicron-like” events anywhere from every 1.5 years to every 10.5 years, and we should be prepared for anything on that spectrum. The coronavirus has evolved quite quickly in the last two years, Bedford said, and will likely continue to do so; though he expects some version of Omicron will be the main variant we’re dealing with for a while.
    • What will the seasonality of COVID-19 be? The global public health system has a well-established process for developing new flu vaccines, based on monitoring circulating flu strains in the lead-up to flu seasons in different parts of the world. Eventually, we will likely get to a similar place with COVID-19 (if annual vaccines become necessary! also an open question at the moment). But right now, the waxing and waning of surges caused by new variants and human behavior makes it difficult to identify the actual seasonality of COVID-19.
    • At what point do we say the vaccine isn’t working well enough? This question was asked by VRBPAC committee member Cody Meissner of Tufts University, during the discussion portion of the meeting. So far, the most common way to measure COVID-19 vaccine effectiveness in the lab is by testing antibodies generated by a vaccine against different forms of the coronavirus. But these studies don’t account for other parts of the immune system, like T cells, that garner more long-term protection than antibodies. We need a unified method for measuring vaccine effectiveness that takes different parts of the immune system into account, along with real-world data.
    • How might vaccine safety change over time? This question was brought up by Hayley Ganz of Stanford, another VRBPAC committee member. The CDC does have an extensive system for monitoring vaccine safety; data from that system should be readily available to the experts making booster shot decisions.

    Another thing I’m wondering about right now, personally, is how the U.S.’s shifting focus away from case data might make all of this more complicated. As public health agencies scale down case investigations and contact tracing—and more people test positive on at-home, rapid tests that are never reported to these agencies—we’re losing track of how many Americans are actually getting COVID-19. And breakthrough cases, which are more likely to be mild or asymptomatic, might also be more likely to go unreported.

    So, how does the U.S. public health system study vaccine effectiveness in a comprehensive way if we simply aren’t logging many of our cases? Programs such as randomized surveillance testing and cohort studies might help, but outside of a few articles and Twitter conversations, I’m not seeing much discussion of these solutions.

    Finally: a few friends and relatives over age 50 have asked me about when (or whether) to get another booster shot, given all of the uncertainties I laid out above. If you’re in the same position, here are a couple of resources that might help:

    More vaccine data

  • All the U.S.’s COVID-19 metrics are flawed

    All the U.S.’s COVID-19 metrics are flawed

    This week, I had a big retrospective story published at FiveThirtyEight: I looked back at the major metrics that the U.S. has used to track COVID-19 over the past two years—and how our country’s fractured public health system hindered our use of each one.

    The story is split into seven sections, which I will briefly summarize here:

    • Case counts, January to March 2020: Early on in the pandemic, the U.S. had a very limited picture of COVID-19 cases due to our very limited testing: after rejecting a test made by the WHO, the CDC made its own test—which turned out to have contamination issues, further slowing down U.S. testing. In early March 2020, for example, the majority of cases in NYC were identified in hospitals, suggesting that official counts greatly underestimated the actual numbers of people infected.
    • Tests administered, March to September 2020: Test availability improved after the first wave of cases, with organizations like the COVID Tracking Project keeping a close eye on the numbers. But there were a lot of challenges with the testing data (like different units across different states) and access issues for Americans with lower socioeconomic status.
    • Hospitalizations, October to December 2020: By late 2020, many researchers and journalists were considering hospitalizations to be a more reliable COVID-19 metric than cases. But it took a long time for hospitalization data to become reliable on a national scale, as the HHS launched a new tracking system in the summer and then took months to work out kinks in this system.
    • Vaccinations, January to June 2021: When the vaccination campaign started in late 2020, it was “tempting to forget about all other COVID-19 metrics,” I wrote in the story. But the U.S.’s fractured system for tracking vaccinations made it difficult to analyze how close different parts of the country were to prospective “herd immunity,” and distracted from other public health interventions that we still needed even as people got vaccinated.
    • Breakthrough cases, July to November 2021: The Delta surge caused widespread infections in people who had been vaccinated, but the CDC—along with many state public health agencies—was not properly equipped to track these breakthrough cases. This challenge contributed to a lack of good U.S. data on vaccine effectiveness, which in turn contributed to confusion around the need for booster shots.
    • Hospitalizations (again), December to January 2022: The Omicron surge introduced a need for more nuance in hospitalization data, as many experts asked whether COVID-19 patients admitted with Omicron were actually hospitalized for their COVID-19 symptoms or for other reasons. Nuanced data can be useful in analyzing a variant’s severity; but all COVID-related hospitalizations cause strain on the healthcare system regardless of their cause.
    • New kinds of data going forward: In our post-Omicron world, a lot of public health agencies are shifting their data strategies to treat COVID-19 more like the flu: less tracking of individual cases, and more reliance on hospitalization data, along with newer sources like wastewater. At this point in the pandemic, we should be fortifying data systems “for future preparedness,” I wrote, rather than letting the systems we built up during the pandemic fall to the wayside.

    I did a lot of reporting for this piece, including interviews with some of the U.S.’s foremost COVID-19 data experts and communicators. As long as the piece is, there were a lot of metrics (and issues with these metrics) that came up in these interviews that I wasn’t able to include in the final story—so I wanted to share some bonus material from my reporting here.

    Long COVID:

    As I’ve discussed in previous issues, the U.S. has done a terrible job of collecting data on Long COVID. The NIH estimates that this condition follows a significant share of coronavirus infections (between 10% and 30%), but we have limited information on its true prevalence, risk factors, and strategies for recovery.

    Here’s Dr. Eric Topol, the prolific COVID-19 commentator and director of the Scripps Research Translational Institute, discussing this data problem:

    [Long COVID has] been given very low priority, very little awareness and recognition. And we have very little data to show for it, because it hasn’t been taken seriously. But it’s a very serious matter.

    We should have, early on, gotten at least a registry of people —a large sample, hundreds of thousands of people prospectively assessed, like is being done elsewhere [in the U.K. and other countries]. So that we could learn from them: how long the symptoms lasted, what are the symptoms, what are the triggers, what can be done to avoid it, the role of vaccines, the role of boosters, all this stuff. But we have nothing like that.

    The NIH’s RECOVER initiative may answer some of these questions, but it will take months—if not years—for the U.S. to actually collect the comprehensive data on Long COVID that we should have started gathering when the condition first began gaining attention in 2020.

    Demographic data:

    In the testing section of the story, I mention that the U.S. doesn’t provide much demographic data describing who’s getting tested for COVID-19. There is actually a little-known provision in the CARES Act that requires COVID-19 testing providers to collect certain demographic data from all people who seek tests. But the provision is not enforced, and any data that are collected on this subject aren’t making it to most state COVID-19 dashboards, much less to the CDC’s public data dashboard.

    Here’s Dr. Ellie Murray, an epidemiologist at the Boston University School of Public Health, discussing why this is an issue:

    We don’t collect reason for seeking a test. We don’t collect age, race, ethnicity, occupation of people who seek a test. Those kinds of things could provide us with some really valuable information about who is getting tested, when, and why—that could help us figure out, what are the essential occupations where people are having a lot of exposures and therefore needing to get a lot of tests? Or are there occupations where we’re seeing a lot of people end up in hospital, who have those occupations, but they’re not getting tests, because actually, the test sites are nowhere near where they need to work, or they don’t have the time to get there before they close.

    And so we don’t really know who is getting tested, and that, I think, is a bigger problem, than whether the numbers that are being tested tell us anything about the trajectory of COVID. Because we have case data, and hospitalization data, and death data to tell us about the trajectory. And the testing could really tell us more about exposure, and concern, and access—if we collected some more of this data around who is getting tested and why.

    Test positivity:

    Speaking of testing: another metric that I didn’t get into much in the story was test positivity. Test positivity—or, the share of COVID-19 tests that return a positive result—has been used from the CDC to local school districts as a key metric to determine safety levels. (For more on this metric, check out my FAQ post from this past January.)

    But even when it’s calculated correctly, test positivity faces the same challenges as case data: namely, bias in who’s getting tested. Here’s Lauren Ancel Meyers, director of the University of Texas at Austin’s COVID-19 Modeling Consortium, explaining this:

    Test positivity is just as fraught [as cases]. It’s just as difficult, because you need to know the numerator and the denominator—what’s influencing the numerator and the denominator? Who is going to get tested, who has access to tests? … It used to be, at the very beginning [of the pandemic], nobody could get a test who wanted a test. And now, today, everybody has a test in their medicine cabinet, and they don’t get reported when they test. It’s different issues that have ebbed and flowed throughout this period.

    Often, if you’re a good data analyst or a modeler, and you have all the information, you can handle those kinds of biases. But the problem is, we don’t know the biases from day to day. And so even though there are statistical tools to deal with incomplete bias, without knowing what those biases are, it’s very hard to do reliable inference, and really hard to understand what’s actually going on.

    Genetic surveillance:

    Also related to testing: genetic surveillance for coronavirus variants of concern. Genetic surveillance is important because it can help identify new variants that may be more transmissible or more likely to evade protection from vaccines. It can additionally help track the qualities of concerning variants once they are identified (if variant data is linked to hospitalization data, vaccination data, and other metrics—which is not really happening in the U.S. right now.)

    Our current genetic surveillance systems have a lot of gaps. Here’s Leo Wolansky, from the Rockefeller Foundation’s Pandemic Prevention Institute (PPI), discussing how his organization seeks to address these challenges:

    [We’re trying to understand] where our blind spots are, and the bias that we might experience with a lot of health system reporting. One of the things that PPI has been doing is identifying centers of excellence in different parts of the world that can improve the sequencing of new cases in underrepresented countries. And so for example, we’ve provided quite a bit of support to the folks in South Africa that ultimately rang the alarm on Omicron.

    We’re also doing this by actually trying to systematically assess countries’ capacity for this type of genomic surveillance. So thinking about, how many tests have been recorded? What’s that test positivity rate? Do we have confidence in the basic surveillance system of the country? And then, do we also see enough sequences, as well as sequencing facility data, to demonstrate that this country can sequence and just isn’t doing enough—or cannot sequence because it needs foundational investment in things like laboratories and devices. We’ve been mapping this capacity just to make sure that we understand where we should be investing as a global community.

    The Pandemic Prevention Institute is taking a global perspective in thinking about data gaps. But these gaps also exist within the U.S., as is clear when one looks at the differences in published coronavirus sequences from state to state. Some states, like Wyoming, Vermont, and Colorado, have sequenced more than 10% of their cumulative cases, according to the CDC. Others, like Oklahoma, Iowa, and South Dakota, have sequenced fewer than 3%. These states need additional investment in order to thoroughly monitor coronavirus transmission among their residents.

    Cohort studies:

    In a cohort study, researchers follow a group of patients over time in order to collect long-term data on specific health conditions and/or the outside factors that influence them. The U.S. has set up a few cohort studies for COVID-19, but they haven’t been designed or utilized in a way that has actually provided much useful data—unlike cohort studies in some other countries. (The U.K., for example, has several ongoing cohort studies collecting information on COVID-19 symptoms, infections in schools, seroprevalence, and more.)

    Here’s Dr. Ellie Murray explaining the lost potential of these studies in the U.S.:

    There are a number of existing cohort studies that have been asked or who asked to pivot to collecting COVID information and therefore collecting long-term COVID information on their cohorts. But there doesn’t seem to be any kind of system to [determine], what are the questions we need answered about COVID from these kinds of studies? And how do we link up people who can answer those questions with the data that we’re collecting here, and making sure we’re collecting the right data? And if this study is going to answer these questions, and this one is going to answer those questions—or, here’s how we standardize those two cohorts so that we can pull them together into one big COVID cohort.

    And so, we end up in this situation where, we don’t know what percent of people get Long COVID, even though we’ve been doing this for over two years. We don’t even really know, what are all the different symptoms that you can get from COVID? … There are all these questions that we could be sort-of systematically working our way through, getting answers and using them to inform our planning and our response. [In addition to having] standardized questions, you also need a centralized question, instead of just whatever question occurs to someone who happens to have the funding to do it.

    Excess deaths:

    Excess deaths measure the deaths that occur in a certain region, over a certain period of time, above the number of deaths that researchers expect to see in that region and time period based on modeling from past years’ data. Excess deaths are the COVID-19 metric with the longest lag time: it takes weeks from initial infection for someone to die of the disease, and can take weeks further for a death certificate to be incorporated into the public health system.

    Once that death information is available, however, it can be used to show the true toll of the pandemic—analyzing not just direct COVID-19 deaths, but also those related to isolation, financial burden, and other indirect issues—as well as who has been hit the hardest.

    Here’s Cecile Viboud, a staff scientist at the NIH who studies infectious disease mortality, discussing this metric:

    We’ve been using the excess death approach for a long time. It comes from flu research, basically starting in 1875 in the U.K. And it was used quite a lot during the 1918 pandemic. It can be especially good in examining historical records where you don’t have lab confirmation—there was no testing ability back in those days…

    So, I think it’s kind of natural to use it for a pandemic like COVID-19. Very early on, you could see how useful this method was, because there was so little testing done. In March and April 2020, you see substantial excess, even when you don’t see lab-confirmed deaths. There’s a disconnect there between the official stats, and then the excess mortality… [We can also study] the direct effect of COVID-19 versus the indirect effect of the pandemic, like how much interventions affected suicide, opioids, death, accidents, etc. The excess approach is also a good method to look at that.

    Viboud also noted that excess deaths can be useful to compare different parts of the U.S. based on their COVID-19 safety measures. For example, one can analyze excess deaths in counties with low vaccination rates compared to those with high vaccination rates. This approach can identify the pandemic’s impact even when official death counts are low—an issue that the Documenting COVID-19 project has covered in-depth.

    Again, you can read the full FiveThirtyEight story here!

    More federal data

  • Featured sources, February 20

    • COVID-19 drug order and inventory info: Rob Relyea has produced three interactive maps that show state-by-state availability for COVID-19 drugs: one for Sotrovimab, the one widely used monoclonal antibody treatment (out of three available in the U.S.) that is still effective against Omicron; one for Paxlovid, the highly effective Pfizer pill; and one for Evusheld, a monoclonal antibody drug that works preemptively for COVID-19, reducing COVID-19 risk for immunocompromised people. Click on a state to see drug provider locations and drug supplies.
    • (Updated) Vaccine Breakthrough Reporting Scorecard: A couple of months ago, I shared a scorecard from the Rockefeller Foundation and former COVID Tracking Project researchers that grades state reporting of breakthrough COVID-19 cases. This scorecard was recently updated. According to the Pandemic Prevention Institute’s twitter, as of this update: “46 states are now regularly reporting some breakthrough data. Currently, 5 states get an A, up from 4 states in January.”
    • Updated Long COVID source list: Journalists covering Long COVID can use this public database, compiled by myself and Fiona Lowenstein, to find patients, scientists, and advocates who are interested in talking to reporters for their stories. The database was published in January, but I recently updated it by adding a few new sources to the list. Read more about the resource here!

  • Featured sources, December 26

    • Holiday risk estimator: A group of data analysts at the Rockefeller Foundation’s Pandemic Prevention Institute put together this tool showing the risk of coronavirus exposure at an event or gathering, taking Omicron’s increased transmissibility into account. You can plug in your county and view your risk at 10, 20, and 30-person events, with adjustments for attendee vaccination and rapid testing. The tool will be updated daily through the end of December, according to analyst Kaitlyn Johnson, with potential further updates after that point.
    • State Reporting of Covid-19 Vaccine Breakthrough Infections: Another source from the Rockefeller Foundation: researchers from the Pandemic Tracking Collective evaluated every state’s reporting of COVID-19 breakthrough cases. The evaluations include both the data fields states report and how information is presented. Only three states (California, Colorado, and Utah) scored an A; nine states that don’t share breakthrough case data regularly scored an F.
    • POLITICO’s State Pandemic Scorecard: And another evaluation of how states fared, but much broader: POLITICO reporters compiled data about state outcomes during the COVID-19 pandemic, including health, economy, social well-being, and education. For each category, states are scored between zero and 100. “No state did well in every policy area,” the report finds; for example, some states that imposed more COVID-19 restrictions fared better on health but worse on economy and education.