Category: Uncategorized

  • National numbers, July 10

    National numbers, July 10

    Almost the entire country is currently experiencing high COVID-19 transmission, according to the old CDC guidance. And that’s just the cases we know about.

    In the past week (July 2 through 8), the U.S. reported about 750,000 new COVID-19 cases, according to the CDC. This amounts to:

    • An average of 110,000 new cases each day
    • 227 total new cases for every 100,000 Americans
    • 4% fewer new cases than last week (June 25-July 1)

    In the past week, the U.S. also reported about 36,000 new COVID-19 patients admitted to hospitals. This amounts to:

    • An average of 5,000 new admissions each day
    • 10.8 total admissions for every 100,000 Americans
    • 3% more new admissions than last week

    Additionally, the U.S. reported:

    • 1,900 new COVID-19 deaths (0.6 for every 100,000 people)
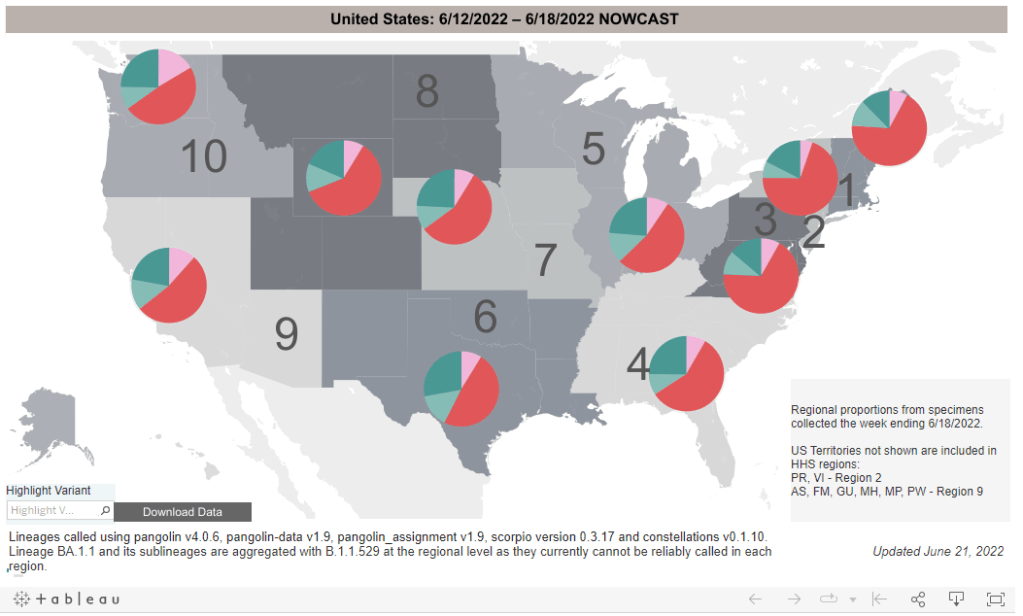
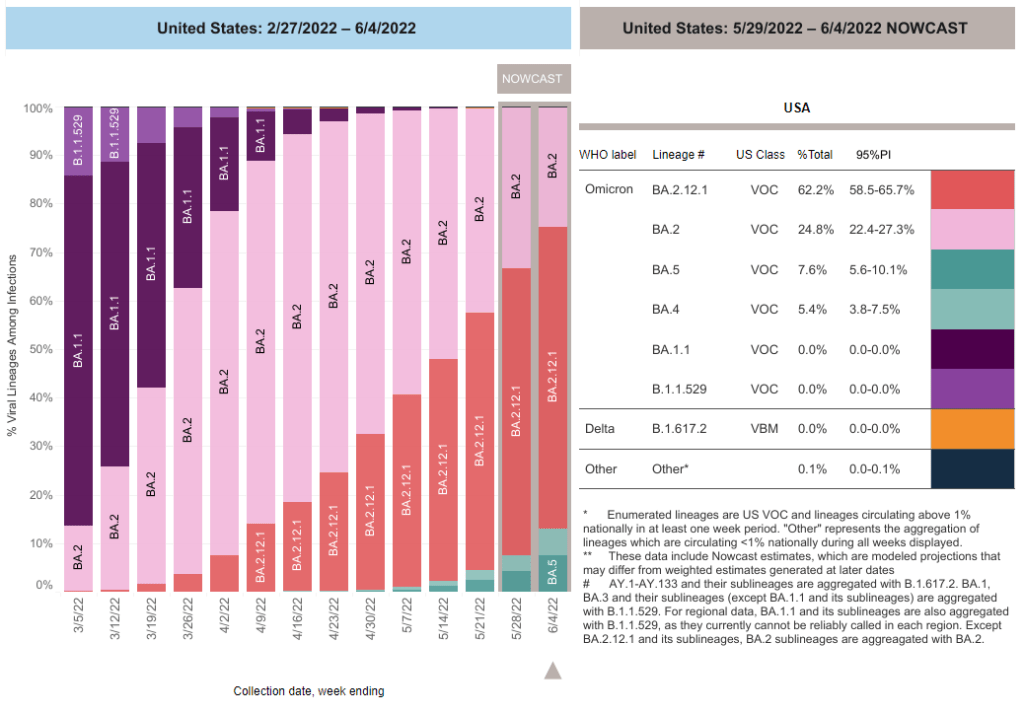
    • 27% of new cases are Omicron BA.2.12.1-caused; 70% BA.4/BA.5-caused (as of July 2)
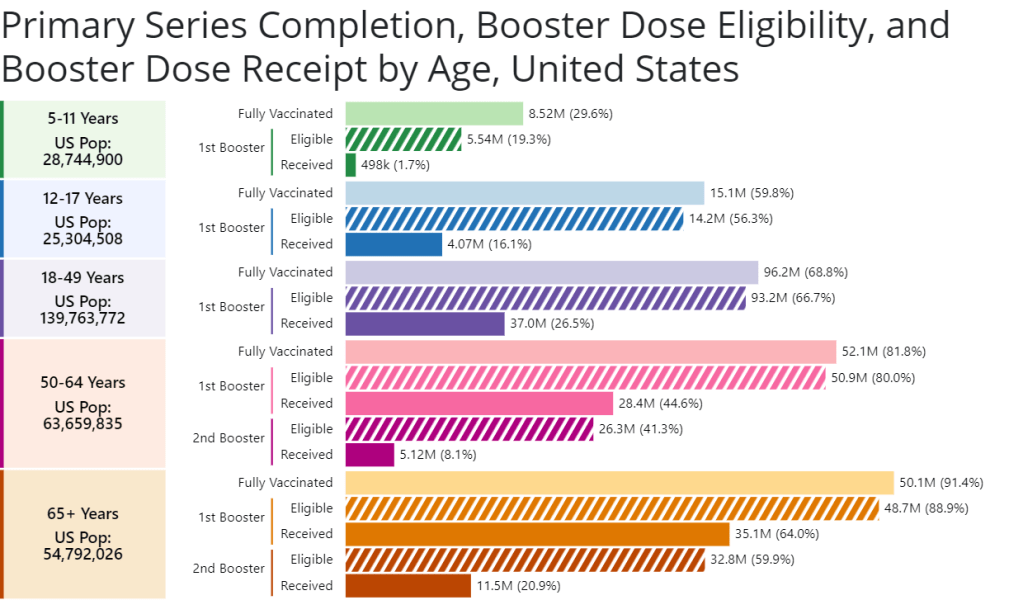
    • An average of 150,000 vaccinations per day (per Bloomberg)

    Our prolonged Omicron subvariant surge continues, now dominated clearly by BA.5. While reported COVID-19 cases dipped slightly last week at the national level, this is almost certainly a result of the July 4 holiday rather than an actual slowing in coronavirus transmission.

    As evidence, note that the number of COVID-19 patients newly reported to hospitals—a metric less impacted by holidays—continued to rise last week. About 5,000 new patients were admitted each day, double the hospitalization rate in early May.

    Anecdotally, it seems like everyone knows someone who has COVID-19, even if their cases aren’t making it into official data due to at-home tests. And many of those people sick right now already had Omicron BA.1—or even BA.2—earlier this year. Such is the power of BA.4 and BA.5, the subvariants that have taken over the U.S. and many other countries in recent weeks.

    BA.5 in particular seems to have a competitive advantage over all other Omicron subvariants. It’s now causing the majority of new COVID-19 cases in the country, with the most recent CDC estimates placing it at 54% prevalence as of July 2. This recent New York Magazine article does a good job of explaining by BA.5 is so worrying, as does this piece in the Guardian.

    To quote from Melody Schreiber’s Guardian article:

    “Covid-19 is very clearly not over. We’re seeing dramatic increases in the number of cases and hospitalizations in many places throughout the United States,” said Jason Salemi, an associate professor of epidemiology at the University of South Florida’s College of Public Health.

    As BA.5, one of the Omicron sub-variants, begins buffeting the US, “we’re headed in a bad direction”, Salemi said. “We’ve seen it coming for a while … We’ve seen it go pretty unabated.”

    More than one in three Americans live in a county at medium risk from Covid, and one in five are at high risk, according to the US Centers for Disease Control and Prevention (CDC) . That’s the highest proportion of the country facing risks since February, Salemi said.

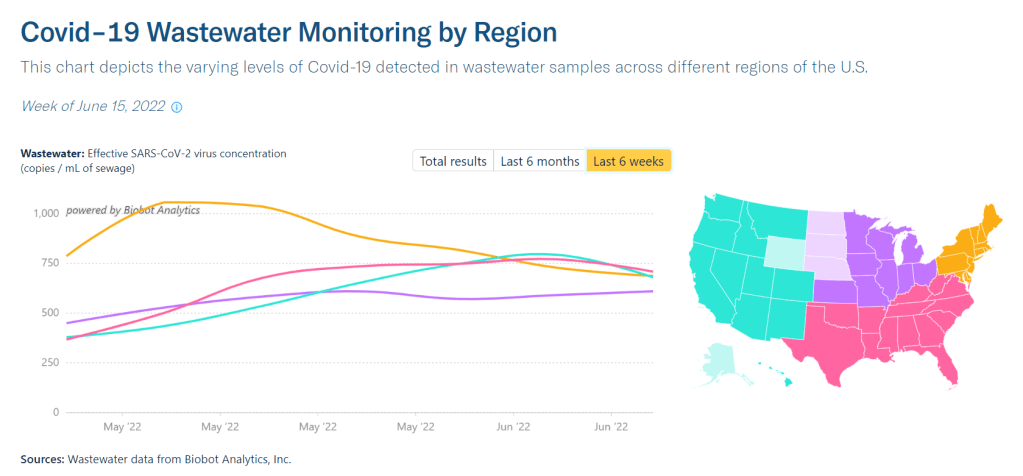
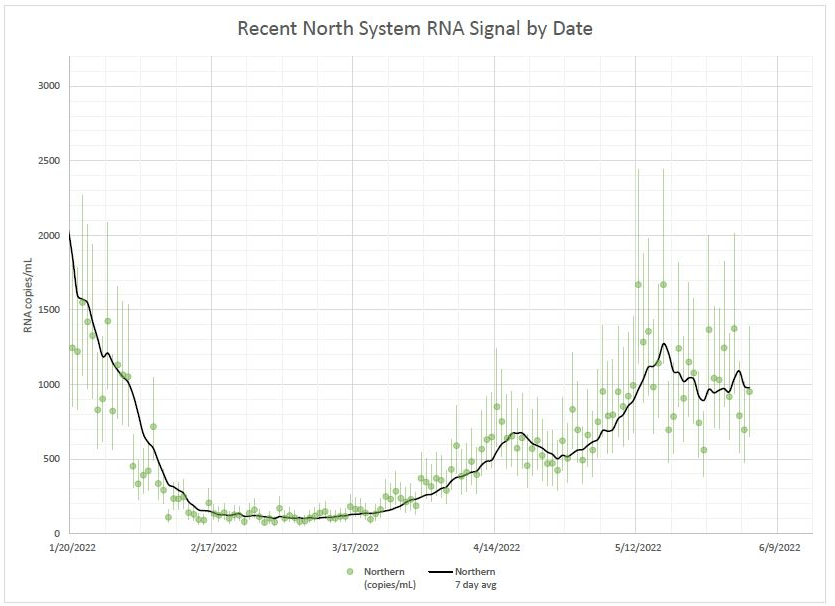
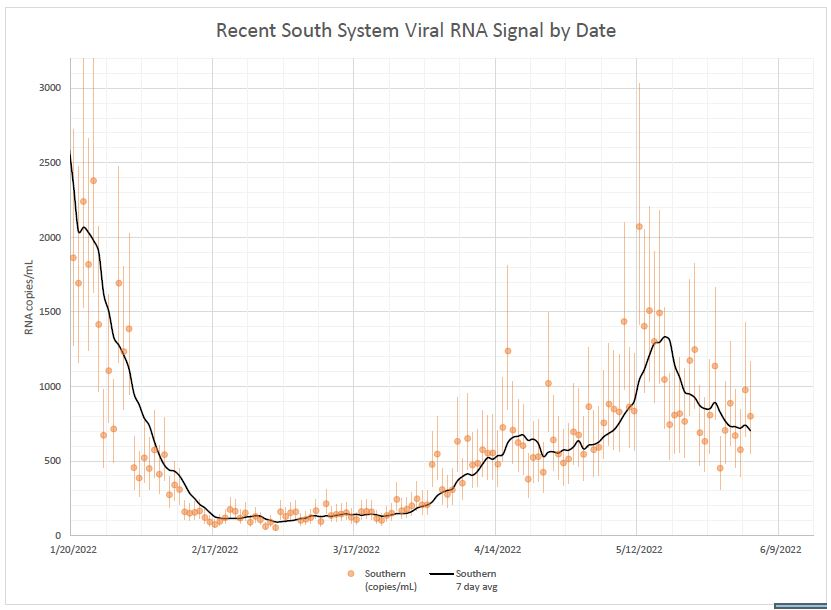
    Wastewater data from Biobot similarly shows transmission continuing to plateau or increase throughout the country. The Northeast, one region where BA.2 and BA.2.12.1 seemed to peak a couple of weeks ago, is now reporting case increases again. In New York City, for example, all five boroughs are now back in the CDC’s “high risk for hospitalizations” category.

    As this surge continues, essential workers and those who are medically vulnerable continue to be most at risk. Remember this, when you consider masking and other precautions.

  • Sources and updates, July 3

    • Report on race and ethnicity data collection: Researchers at Boston University’s Center for Antiracist Research, who worked on collecting race and ethnicity data from states during the pandemic, have produced a report about the challenges of this work. I was a long-time volunteer for the COVID Tracking Project’s Racial Data Tracker, which became the first stage of a larger project for the BU center, and I’m glad to see this report highlight the issues with destandardized, incomplete data that I remember well.
    • Global impact of vaccines in 2021: In a new paper, published in The Lancet in late June, researchers at Imperial College London evaluate the lives saved by COVID-19 vaccines on a global scale during the first year that this technology was available. Vaccines prevented about 14 million COVID-19 deaths in 185 countries and territories, the researchers found. If global health initiatives like COVAX had met their goals, the lives saved could have been far greater.
    • COVID-19 spread from a cat: Scientists in Thailand have identified the first documented case of a human getting the coronavirus from a pet cat. In this case, the cat from a family going through isolation for COVID-19 infected a veterinarian who was caring for it; genetic analysis confirmed that three humans (father, son, and veterinarian) and the cat were infected with the same viral strain. While cases like this are likely rare, the documented transmission demonstrates why we need better tracking of COVID-19 in animals, as I noted last week.
    • Potential new approach for tracking variants: A new study in the Journal of Clinical Microbiology, funded by the National Institutes of Health, presents the potential for monitoring coronavirus variants through a PCR testing-based approach. Compared to the techniques labs currently use to track variants—which involve sequencing an entire viral genome—this new approach would be faster, cheaper, and could be performed by more labs. The researchers are eager to share their work “as a public health tool,” they said in an NIH press release.

  • Sources and updates, June 26

    Sources and updates, June 26

    A new chart from the CDC shows booster shot eligibility and uptake by age. Retrieved on June 26.
    • CDC report on Paxlovid distribution: A major study from the CDC’s Morbidity and Mortality Weekly Report this week: researchers at the CDC and collaborators studied the distributions of antiviral COVID-19 drugs Paxlovid and Lagevrio (also called Molnupiravir) by ZIP code, comparing ZIP codes with the CDC’s Social Vulnerability Index. More than one million prescriptions were dispensed between late December 2021 and late May 2022, the study found. But, by the end of that period, prescription rates were twice as high in low- and medium-vulnerability ZIP codes as in high-vulnerabilty ZIP codes—indicating that these antivirals are not reaching the people who most need them.
    • CDC booster shot data update: The CDC has added a new chart to its “COVID-19 Vaccinations in the United States” page, showing booster shot eligibility and uptake by age. The chart includes two rounds of boosters for seniors; according to the data, 64% of eligible seniors have received their first booster, but only 21% have received their second booster. The data are also available for download.
    • COVID-19 vaccinations among children: I also recently learned about this CDC page focused on kids’ vaccinations, including vaccination coverage by demographic factors such as poverty status, parents’ education level, and insurance. The data come from a national survey previously used to monitor flu vaccinations among children. Data are updated monthly, and don’t yet include figures for children under 5; but existing data for children ages 5-17 affirm that vaccine uptake for kids has been low so far.
    • Guide to finding government COVID-19 documents: The Digital Public Library of America has released a free ebook with an archive of over 3,000 government documents related to the pandemic response. These documents were collected by the COVID Tracking Project during its year of work, and have been meticulously categorized and indexed in true CTP fashion. CTP alum Jennifer Clyde was the project’s editor.
    • Commonwealth Fund report on improving our public health system: A new report from healthcare-focused foundation The Commonwealth Fund provides recommendations for improving the country’s public health system. It focuses on organizing local agencies, providing more funding, improving trust, and other key topics.
    • History of exposure notification apps: Jenny Wanger, whom I interviewed about COVID-19 exposure notification apps back in spring 2021, sent me this paper she wrote about the technology, which was published earlier in June. The paper provides a report of how exposure notification protocols were developed, how states used the technology, and how limited data made it difficult to assess the technology’s success.

  • National numbers, June 26

    National numbers, June 26

    BA.4 and BA.5 (teal) are competing with BA.2.12.1 (red), with different lineages dominating in different parts of the country. CDC estimates reflect the week from June 12 to June 18.

    In the past week (June 18 through 24), the U.S. reported about 680,000 new COVID-19 cases, according to the CDC. This amounts to:

    • An average of 100,000 new cases each day
    • 208 total new cases for every 100,000 Americans
    • 6% fewer new cases than last week (June 11-17)

    In the past week, the U.S. also reported about 31,000 new COVID-19 patients admitted to hospitals. This amounts to:

    • An average of 4,400 new admissions each day
    • 9.3 total admissions for every 100,000 Americans
    • 1% more new admissions than last week

    Additionally, the U.S. reported:

    • 1,800 new COVID-19 deaths (0.5 for every 100,000 people)
    • 56% of new cases are Omicron BA.2.12.1-caused; 35% BA.4/BA.5-caused (as of June 18)
    • An average of 50,000 vaccinations per day (per Bloomberg)

    America’s Omicron subvariant surge continues to be in a plateau this week, with national COVID-19 case rates, hospitalization rates, and wastewater trends remaining fairly level or showing slight declines.

    The U.S. has reported a weekly average between 100,000 and 110,000 new cases a day since mid-May, according to the CDC. These numbers are massive undercounts, as about five times more rapid antigen tests are being conducted in the U.S. than PCR tests, so the true trend is difficult to discern—but we can safely say that there is a lot of coronavirus circulating throughout the country.

    New hospital admissions, the number of COVID-19 patients who sought treatment, rose slightly in the last week: about 4,400 patients were admitted each day nationwide, compared to 4,300 last week. Wastewater data from Biobot shows a national plateau, as coronavirus levels drop in the Northeast and West while rising in the South and remaining stagnant in the Midwest.

    Why this prolonged plateau? Most likely, the rise of immune-evading Omicron subvariants BA.4 and BA.5 is preventing a BA.2-initiated wave from truly dipping back down. Estimates from the CDC suggest that BA.4 and BA.5 may even be outcompeting BA.2.12.1: the share of U.S. cases caused by BA.2.12.1 dropped for the first time in the CDC’s latest variant prevalence update, from 63% in the week ending June 11 to 56% in the week ending June 18.

    Regions with a higher share of BA.4 and BA.5—namely, Gulf Coast states, the Midwest, and the West Coast—are also reporting case increases. A few state hotspots that stick out in the (admittedly, poor) official case counts: Hawaii, Florida, New Mexico, Alaska, and California all reported more than 250 new cases per 100,000 people in the week ending June 22.

    In the Northeast, BA.2.12.1 is still causing a majority of cases, but BA.4 and BA.5 are gaining some ground. This may explain why places like New York City are seeing case trends that simply refuse to go down as quickly as we’ve observed in past waves, though a lack of new safety measures is likely also playing a role.

    Meanwhile, vaccination rates remain the lowest they’ve been since late 2020. Fewer than 25,000 people received a first vaccine dose in the week ending June 21, according to the CDC. I was expecting to see a bump from children under five finally becoming eligible for vaccination, but it has not shown up in the data yet—likely another signal of current apathy towards COVID-19 safety.

  • Reflecting on 100 issues of COVID-19 data reporting

    Reflecting on 100 issues of COVID-19 data reporting

    The author, working on a February 2021 issue after moving apartments. Weekend newsletter writing often looks like this.

    100 weeks ago, I wrote the first issue of this newsletter on Substack.

    I wrote about a change in hospitalization data, which had just shifted from the purview of the CDC to a different team at the Department of Health and Human Services (HHS). This felt like a niche topic at the time, but I wanted to provide a clear explanation of the change after seeing some misleading articles and social media posts suggesting that the CDC was losing control of all COVID-19 data.

    At the time, my goals were simple: explain where COVID-19 data come from and how to interpret the numbers; provide tips and resources for other reporters on this complicated beat; and help people in my broader social network understand pandemic trends. The COVID-19 Data Dispatch’s aims haven’t changed too much, even as I’ve expanded it to its own website, worked with guest writers, coordinated events, and more.

    As I look back on 100 issues, I wanted to share a few lessons for other reporters still on the COVID-19 beat (and, more broadly, anyone working on public health communications). I’m also sharing a couple of notes from readers about how the publication has helped them.

    Lessons I’ve learned:

    • Lay readers can handle complicated topics! You don’t need to overly simplify things, just use clear language and examples that are easy to follow. This is honestly my entire ethos as a science writer so I found it hard to pick an example post, but one may be my piece on why U.S. Long COVID research is so difficult, which built on reporting for a Grid feature.
    • FAQs are good formats for breaking down complex topics or new information. I like to use FAQ formats and lots of subheaders whenever I’m writing about a new variant (or subvariant) of concern, like this post on BA.4 and BA.5, or when walking through the implications of a federal guidance change, like this post discussing testing and isolation with the Omicron variant.
    • Consistency is key. One thing I frequently hear from readers is that they appreciate the regularity of COVID-19 Data Dispatch issues; if they tune out of other pandemic news, they can still expect me to deliver some important updates once a week. This is definitely a built-in advantage of the newsletter format, but I try to take the consistency further by having regular sections (such as “National numbers”) with statistics reported in a similar way each week.
    • Emphasizing the same issues over and over can feel repetitive to the writer, but it’s helpful for readers. Whenever I remind readers about holiday data reporting lags, for example, I have to remind myself that most people are not constantly thinking about COVID-19 trends the way that I am—and might not be consistently reading my newsletters, either. It’s another aspect of being consistent.
    • Provide trends and context, not just isolated numbers. This is another key aspect of my “National numbers” updates: I always explain how a given week’s case or hospitalization numbers compare to previous weeks. Another important piece of context, I think, is where numbers come from: for example, reminding readers that case numbers mainly include PCR test results, not at-home antigen test results.
    • Acknowledge uncertainty! This is crucial in any kind of data reporting, especially when reporting from data systems that are as flawed and incomplete as the U.S.’s COVID-19 data systems. For example, last month’s post about interpreting limited data during our undercounted surge explains the limitations of several common sources, as well as what the sources can still tell us.
    • Provide readers with tools to see local data. This is a central reason why so many publications built COVID-19 dashboards in 2020, and why some outlets continue to maintain them now. People love to look up their states or counties! I often don’t have the bandwidth for hyperlocal visualizations myself, but point to these resources in “Featured sources” updates whenever possible.
    • Use readers’ questions to drive reporting. Some of my favorite COVID-19 Data Dispatch posts have been inspired by reader questions, from the “Your Thanksgiving could be a superspreader” post in fall 2020 to my explanation of why the CDC’s isolation guidance is not based on scientific evidence earlier this spring. If you write to me with a question, you’re probably not the only person with that question—at least, if my metrics on these posts are anything to go by.

    Testimonials from readers:

    Josh Zarrabi (software engineer at the Health Equity Tracker): “You’re, like, the only COVID news I get anymore. Every Sunday morning with my coffee.”

    Chris Persaud (data reporter, Palm Beach Post): “Thanks to your newsletter, I’ve found useful data for my news reports.”

    Jeremy Caplan (director of Teaching & Learning at Newmark J School): “COVID-19 Data Dispatch is consistently informative. I limit my COVID news diet, so it’s helpful to have this singularly focused resource for keeping up with the data.”

    My Grandma: “In our Berkeley family (C, P and me) we have relied on you and your newsletter for helping us through these difficult times.  The research, guidance and advice in your Data Dispatch, is invaluable.”

    Thank you to all of my readers for your support over the last 100 weeks. I hope the COVID-19 Data Dispatch can continue to provide you with the news and resources you need to navigate the (continuing!) pandemic.

    And of course, if you’d like to support this work, consider setting up a reoccurring donation or buying me a coffee!

  • National numbers, June 19

    National numbers, June 19

    The Omicron subvariants surge might be peaking, but it’s turning around slowly. Chart from Biobot, retrieved June 19.

    In the past week (June 11 through 17), the U.S. reported about 700,000 new COVID-19 cases, according to the CDC. This amounts to:

    • An average of 100,000 new cases each day
    • 215 total new cases for every 100,000 Americans
    • 8% fewer new cases than last week (June 4-10)

    In the past week, the U.S. also reported about 30,000 new COVID-19 patients admitted to hospitals. This amounts to:

    • An average of 4,300 new admissions each day
    • 9.2 total admissions for every 100,000 Americans
    • 5% more new admissions than last week

    Additionally, the U.S. reported:

    • 1,900 new COVID-19 deaths (0.6 for every 100,000 people)
    • 64% of new cases are Omicron BA.2.12.1-caused; 22% BA.4/BA.5-caused (as of June 11)
    • An average of 130,000 vaccinations per day (per Bloomberg)

    National COVID-19 cases appeared to plateau this week, as some parts of the country seem to have peaked in their Omicron subvariants wave while others are still reporting increasing transmission. The CDC reported an average of 100,000 cases each day—as always, this is a significant undercount of actual infections due to changing test availability.

    Major indicators are showing continued high transmission around the country. National cases have leveled off or slightly dipped, but the number of new COVID-19 patients admitted to hospitals increased by 5% compared to the prior week—continuing a trend of steady increases since early April. (Hospitalization trends usually lag case trends, but the increased unreliability in case reporting may have shifted this.)

    Wastewater surveillance also suggests that COVID-19 spread remains at high levels nationwide, with a very slight dip in the last week, according to Biobot’s tracker. The Northeast region is a couple of weeks past the point of its surge, at this point; data from individual Northeast cities like Boston, New York City, and New Haven, Connecticut back up this trend.

    West Coast, Midwest, and Southern states continue to report rising or plateauing transmission, according to Biobot. Wyoming, Nevada, Montana, and Utah reported the highest increases in official case counts this week (compared to the prior week), according to the June 16 Community Profile Report.

    Some of these Midwest and Southern states are also reporting high prevalences of BA.4 and BA.5, the latest (and, likely, most contagious) Omicron subvariants yet. The CDC estimates that these two lineages caused about 21% of new cases nationwide in the week ending June 11. But these data are always reported with a significant lag, suggesting that the true prevalence could be closer to 50%.

    As many of our local leaders, workplaces, and social circles continue to pretend that the pandemic is over—when we are actually facing one of the country’s biggest COVID-19 waves yet—remember that there are still options to protect yourself and your community. Safety measures like wearing a good mask, testing frequently, and gathering outdoors or in well-ventilated spaces are more important than ever.

  • Sources and updates, June 12

    • CDC investigating deaths from Long COVID: Researchers at the CDC’s National Center for Health Statistics are currently working to investigate potential deaths from Long COVID, according to a report from POLITICO. The researchers are reviewing death certificates from 2020 and 2021, looking for causes of death that may indicate a patient died from Long COVID symptoms rather than during the acute stage of the disease. There’s currently no death code associated with Long COVID and diagnoses can be highly variable, so the work is preliminary, but I’m really looking forward to seeing their results.
    • CDC reports on ventilation improvements in schools: And one notable CDC study that was published this week: researchers at the agency from COVID-19, occupational health, and other teams analyzed what K-12 public schools are doing to improve their ventilation. The report is based on a survey of 420 public schools in all 50 states and D.C., with results weighted to best represent all schools across the country. While a majority of schools have taken some measures to inspect their HVAC systems or increase ventilation by opening windows, holding activities outside, etc., only 39% of schools surveyed had actually replaced or upgraded their HVAC systems. A lot more work is needed in this area.
    • Results from the COVID-19 U.S. State Policy database: The Boston University team behind the COVID-19 U.S. State Policy database has published a paper in BMC Public Health sharing major findings from their work. The database (which I’ve shared in the CDD before) documents what states have done to curb COVID-19 spread and address economic hardship during the pandemic, as well as how states report COVID-19 data.  In their new paper, the BU team explains how this database may be used to analyze the impacts of these policy measures on public health.
    • Promising news about Moderna’s bivalent vaccine: Moderna, like other vaccine companies, has been working on versions of its COVID-19 vaccine that can protect better against new variants like Omicron. This week, the company announced results (in a press release, as usual) from a trial of a bivalent vaccine, which includes both genetic elements of the original SARS-CoV-2 virus and of Omicron. The bivalent vaccine works much better than Moderna’s original vaccine at protecting against Omicron infection, Moderna said; still, scientists are skeptical about how the vaccine may fare against newer subvariants (BA.2.12.1, BA.4, BA.5).
    • Call center and survey from FYLPRO: A reader who works at the Filipino Young Leaders Program (FYLPRO) requested that I share two resources from their organization. First, the program has set up a call center aimed at helping vulnerable community members with their COVID-19 questions. The call center is available on weekdays from 9 A.M. to 5 P.M. Pacific time in both English and Tagalog; while it’s geared towards the Filipino community, anyone can call in. And second, FYLPRO has launched a nationwide survey to study vaccine attitudes among Filipinos; learn more about it here.

  • CDD is almost at 100 issues: Share your favorite posts

    Next Sunday, the COVID-19 Data Dispatch reaches a major milestone: issue #100.

    When I started this project on Substack in July 2020, I did not expect to reach 100 issues. Honestly, I wasn’t thinking beyond the next federal data dump or COVID Tracking Project data entry shift. (If you’d like to read more about the CDD’s origins, see this Medium post.)

    But here we are, 100 weeks later. I’ve written hundreds of posts on data quirks, data gaps, interpretations, visualizations, and reader questions. The topics I’ve covered have ranged from superspreader events to wastewater surveillance to explainers about (so many) new variants. I’ve hosted guest articles, hired an intern, and run a series of data workshops.

    In honor of this milestone, I’d like to hear from you, dear readers. What have been your favorite issues or topics? Are there any posts that you frequently reference, or that you forwarded to friends and family members? How has this newsletter and blog helped you make sense of the pandemic? You’re also welcome to share any questions you’d like me to answer at this highly confusing time.

    If you’d like to share, please comment below! You can also email me at betsy@coviddatadispatch.com or reach out on Twitter. I’ll share a few responses (with permission) in next week’s issue.

    Also, if you’d prefer not to comment, consider sharing the COVID-19 Data Dispatch with a few friends instead! We are getting very close to my longtime goal of 1,000 free newsletter subscribers, and I would love to reach that by next week.

  • National numbers, June 12

    National numbers, June 12

    Omicron BA.4 and BA.5 (shown here in teal) have been spreading rapidly in the U.S. in the last month. CDC data are as of June 4.

    In the past week (June 4 through June 10), the U.S. reported about 760,000 new COVID-19 cases, according to the CDC. This amounts to:

    • An average of 110,000 new cases each day
    • 233 total new cases for every 100,000 Americans
    • 8% more new cases than last week (May 28-June 3)

    In the past week, the U.S. also reported about 29,000 new COVID-19 patients admitted to hospitals. This amounts to:

    • An average of 4,100 new admissions each day
    • 8.8 total admissions for every 100,000 Americans
    • 8% more new admissions than last week

    Additionally, the U.S. reported:

    • 2,100 new COVID-19 deaths (0.7 for every 100,000 people)
    • 62% of new cases are Omicron BA.2.12.1-caused; 13% BA.4/BA.5-caused (as of June 4)
    • An average of 90,000 vaccinations per day (per Bloomberg)

    As I predicted last week, the brief dip in reported COVID-19 cases was a result of the Memorial Day holiday, not an actual signal of the BA.2/BA.2.12.1 wave reaching its peak. National case counts are up again this week, with the country still reporting over 100,000 new cases a day. And remember, the true infection rate could be five or more times higher, thanks to under-testing.

    Hospital admissions, a more reliable metric (less impacted by holiday interruptions) also went up this week. The number of Americans admitted to the hospital with COVID-19 has risen steadily each week since early April.

    Even as millions of people are protected from severe symptoms by vaccination or prior infection, many are still susceptible—whether they’re too young to be vaccinated or have not yet received booster shots for which they are eligible. Plus, the U.S. continues to have next to zero data on Long COVID cases, a debilitating, long-term condition that can impact even people who are fully vaccinated and boosted.

    Highly contagious Omicron subvariants continue to drive this surge. BA.2.12.1, the subvariant first identified in New York, is now causing almost two-thirds of cases nationwide, according to the CDC’s latest estimates. Meanwhile, the agency is finally listing separate estimates for BA.4 and BA.5, subvariants with greater capacity to reinfect people (even those who already had other versions of Omicron.)

    BA.4 and BA.5 caused about 13% of cases combined in the week ending June 4, and are spreading fast. These two subvariants are currently more prevalent in parts of the Midwest and South, while BA.2.12.1 is more dominant in the Northeast. This pattern might partially explain why the Northeast is seeing virus transmission decrease or plateau, while other regions report increases.

    Wastewater data from Biobot show a similar picture: a downward trend in the Northeast, offset by upward trends in the other regions. Cities like Boston and New York City are showing somewhat confusing signals right now, as Memorial Day travel and gatherings may have interrupted the decline.

    According to the CDC’s old community transmission levels (which are based on cases, not hospitalizations), about 96% of U.S. counties are currently reporting high transmission—and should recommend masking in public. But new mask requirements or other safety measures have been few and far between as this surge remains largely invisible.

  • National numbers, June 5

    National numbers, June 5

    In the past week (May 28 through June 3), the U.S. reported about 700,000 new COVID-19 cases, according to the CDC. This amounts to:

    • An average of 100,000 new cases each day
    • 215 total new cases for every 100,000 Americans
    • 9% fewer new cases than last week (May 21-27)

    In the past week, the U.S. also reported about 27,000 new COVID-19 patients admitted to hospitals. This amounts to:

    • An average of 3,800 new admissions each day
    • 8.1 total admissions for every 100,000 Americans
    • 5% more new admissions than last week

    Additionally, the U.S. reported:

    • 1,700 new COVID-19 deaths (0.5 for every 100,000 people)
    • 94% of new cases are Omicron BA.2-caused; 59% BA.2.12.1-caused (as of May 28)
    • An average of 70,000 vaccinations per day (per Bloomberg)

    The BA.2/BA.2.12.1 surge continues. According to the CDC, the number of new cases reported nationwide dropped last week, compared to the prior week; but this drop is more likely a result of the Memorial Day holiday than of an actual slowdown in transmission. (As I frequently note in these updates, holidays always result in case reporting dips as public health workers take time off.)

    Despite the holiday, the country reported over 100,000 new cases a day last week. And, of course, this is a massive undercount. A new preprint from researchers at the City University of New York suggests that actual coronavirus infections during the BA.2/BA.2.12.1 surge may be 30 times as high as reported case counts—and that’s in New York City, which has better PCR infrastructure than most. (More on this study later in the issue.)

    Unlike official case counts, the number of COVID-19 patients newly admitted to hospitals across the country rose last week: an average of 3,800 patients were admitted each day, a 5% increase from the prior week. Hospital admissions are more reliable than case counts, especially after a holiday, suggesting that we are indeed still on the upswing of this surge.

    Similarly, coronavirus levels in the country’s wastewater keep rising. Biobot’s dashboard shows a continued national increase, as well as increases in the Midwest, West, and South regions. In the Northeast, virus levels dipped last week and now appear to be at a plateau.

    Has the Northeast peaked? Optimistically, I would like to say yes, but a combination of spotty data and the Memorial Day holiday makes it tough to say for sure. In New York City, case rates dropped last week—but so did testing. In Boston, coronavirus concentrations in wastewater seem to be on a downturn—but the data are noisy.

    And even if the Northeast is coming out of its BA.2/BA.2.12.1 surge, the rest of the country is on the opposite side of the wave. Reported case numbers in Southern and Midwest states like Missouri, Wyoming, Alabama, Utah, Mississippi, and Texas shot up by over 20% last week, while Hawaii and Florida now have the highest reported case rates, according to the June 2 Community Profile Report.

    Even the CDC’s highly lenient Community Levels are beginning to light up yellow and orange, suggesting that counties from Florida to central California should reinstate indoor mask requirements. But are any leaders actually putting these measures in place? It seems unlikely, leaving the increasingly-smaller COVID-concerned minority to fend for ourselves.