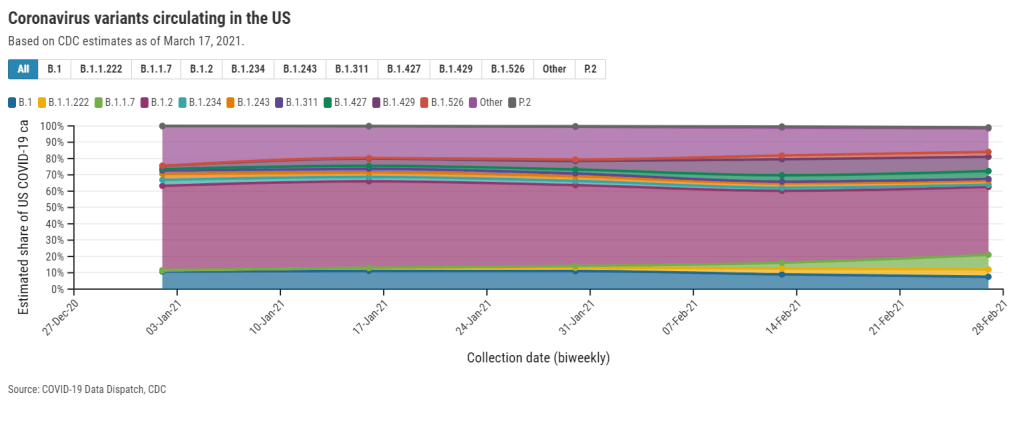
This week, the CDC published a new data page about the coronavirus variants now circulating in the U.S. The page provides estimates of how many new cases in the country may be attributed to different SARS-CoV-2 lineages, including both more familiar, wild-type variants (B.1. and B.1.2) and newer variants of concern.
This new page is a welcome addition to the CDC’s library, as their “Cases Caused by Variants” page only provides numbers of variant cases reported to the agency—which, as we have repeatedly stated at the CDD, represent huge undercounts.
However, the page still has three big problems:
First, the data are old. The CDC is currently reporting data for four two-week periods, the most recent of which ends February 27. That’s a full three weeks ago—a pretty significant lag when several “variants of concern” are concerning precisely because they are more infectious, meaning they can spread through the population more quickly.
The CDC’s B.1.1.7 estimate (about 9% as of Feb. 27) particularly sticks out. CoVariants, a variant tracker run by independent researcher Emma Hodcroft, also puts B.1.1.7 prevalence in the U.S. at about 10% in late February… but estimates this variant accounts for 22% of sequences as of March 8. These estimates indicate that B.1.1.7 may have doubled its case counts in the two weeks after the CDC’s data stop.
Second, the CDC data reveal geographic gaps in our current sequencing strategy. The CDC is providing state-by-state prevalence estimates for 19 select states—or, those states that are doing a lot of genomic sequencing. Of course, this includes big states such as California and New York, but excludes much of the Midwest and other smaller, less scientifically-endowed states.
Michigan, that state currently facing a concerning surge, is not represented—even though the state has one of the highest raw counts of B.1.1.7 cases, as of this week. We can gather from a footnote that Michigan did not submit at least 300 sequences to the CDC between January 13 and February 13; still, this exclusion poses a challenge for researchers watching that surge.
And finally, the data are presented in a confusing manner. When I shared this page with a couple of COVID Tracking Project friends on Friday, it took the group a lot of close-reading and back-and-forth to unpack those first two problems. And we’re all used to puzzling through confusing data portals! The CDC claims this page is an up-to-date tracker, “used to inform national and state public health actions related to variants,” but its data are weeks old and represent less than half of the country.
The CDC needs to improve its communication of data gaps, lags, and uncertainties, especially on such an alarming topic as variants. And, of course, we need better variant data to begin with. The U.S. is aiming to sequence 25,000 samples per week, but that’s still far from the 5% of new cases we would need to sequence in order to develop an accurate picture of variant spread in the U.S.
On that note: you may notice that we now have a new category for variant posts on the CDD website. I expect that this will continue to be a major topic for us going forward.

Leave a comment