When the Department of Health and Human Services (HHS) started reporting hospitalization data at the state level back in July, I wistfully told a friend that I wished the agency would report facility-level numbers. Another federal agency had recently started reporting this type of data for nursing homes, and I appreciated the flexibility and granularity with which I was able to analyze how the pandemic was impacting nursing home patients and staff. I wanted to see the pandemic’s impact on hospitals in the same way.
At the time, I considered this a pipe dream. The HHS was already facing major challenges: implementing a new data pipeline across the country, navigating bureaucratic issues with state public health departments, and working with individual hospitals to help them report more accurately and more often. Plus, transparency issues and political scandals plagued the agency. Making more data public seemed to be the least of its priorities.
But I’m happy to say that this week, my pipe dream came true. On Monday, the HHS published a new hospitalization dataset including capacity, new admissions, and other COVID-19-related numbers—for over 4,000 individual facilities across America.
This is, as I put it in a COVID Tracking Project blog post analyzing the dataset, a big deal. Project lead Alexis Madrigal called it “probably the single most important data release that we’ve seen from the Federal government.” I, in somewhat less professional terms, texted my girlfriend:

Let me explain why this new dataset is so exciting—not just for a nerd like me, but for any American following the pandemic. I’m drawing on a COVID Tracking Project blog post unpacking the dataset, to which I contributed some explanatory copy.
- Hyperlocal data: At a time when hospitals are overwhelmed across the nation, it is incredibly useful to see precisely which hospitals are the worst off and how COVID-19 is impacting them. Data scientists can pinpoint specific patterns and connections between regions. National aid groups can determine where to send PPE and other supplies. Journalists can see which hospitals should be the focus of local stories. The stories that can be told with this dataset are endless.
- Aggregating to different geographies: The individual facility is the most detailed possible level of reporting for COVID-19 hospitalizations. But this HHS dataset also includes the state, county, and ZIP code for each hospital, along with unique codes that identify hospitals in the Medicare and Medicaid system. The data for specific facilities can thus be combined to make comparisons on a variety of geographic levels. I tried out a county-level visualization, for example; some counties are not represented, but you can still see a much more granular picture of hospital capacity than you would in a state-level map.
- Time series back to August: HHS didn’t just provide data on how hospitals are coping with COVID-19 right now. They provided a full time series going back to the first week of August, with data starting shortly after the HHS began collecting information from hospitals. These historical data allow researchers to make more detailed comparisons between the nation’s last major COVID-19 peak and our current outbreak. There are some reporting errors from hospitals in the early weeks of the dataset; COVID Tracking Project analysis has shown that these errors become less significant in the week of August 28.
- Includes coverage details: The dataset includes fields that can help researchers check the quality of an individual hospital’s reporting. These fields, called “coverage” numbers, show the number of days in a given week on which data were reported. A value of six for total_adult_patients_hospitalized_confirmed_and_suspected_covid_7_day_coverage, for example, indicates that this hospital reported how many adult COVID-19 patients it was treating on six of seven days in the past week. Many hospitals are now reporting all major metrics on six or seven days a week—HHS has really stepped up to encourage this level of reporting in recent months. For more information on hospital reporting coverage, see HHS Protect.
- Admissions broken out by age: The HHS began reporting hospital COVID-19 admissions, or new COVID-19 patients entering the hospital, at the state level in November. The new dataset includes this information, at the facility level, for every week going back until August, and breaks out those new patients by age group. You can see exactly who is coming to the hospital with COVID-19 in age brackets of 18-19, ten-year ranges from 20 to 79, and 80+. Several other metrics in the dataset are also broken out by adult and children patients.
- New fields: This dataset reports counts of emergency department visits, including both total visits for any reason and visits specifically related to COVID-19. (The HHS data dictionary defines this as “meets suspected or confirmed definition or presents for COVID diagnostic testing.”) These figures allow researchers to calculate the share of emergency department visits at a given hospital that are COVID-related, a new metric that wasn’t available from previous HHS reporting.
- Signifies major effort from the HHS: When it comes to reporting hospitalization data, this agency has come a long way from the errors and transparency questions of the summer. Last week, the COVID Tracking Project published an analysis finding that HHS counts of COVID-19 patients are now in close proximity to similar counts reported by state public health departments—signifying that the federal data may be a useful, reliable complement to state data. (I discussed this analysis in last week’s issue.) The new facility-level dataset indicates that HHS data scientists understand the needs of COVID-19 researchers and communicators, and are working to make important data public. I will continue to carefully watch this agency, as will many of my fellow reporters. But I can’t deny that this data release was a major step for transparency and trust.
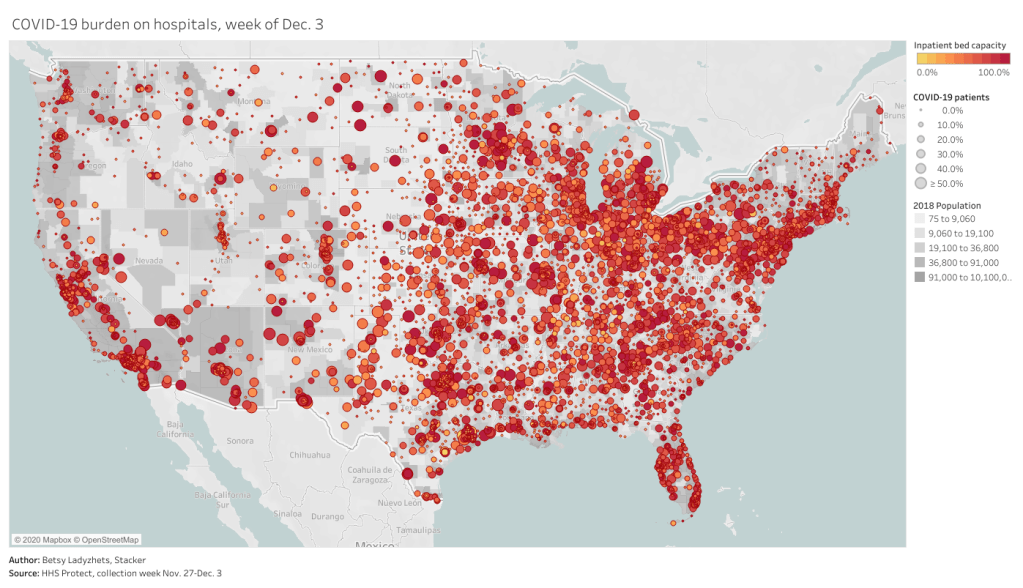
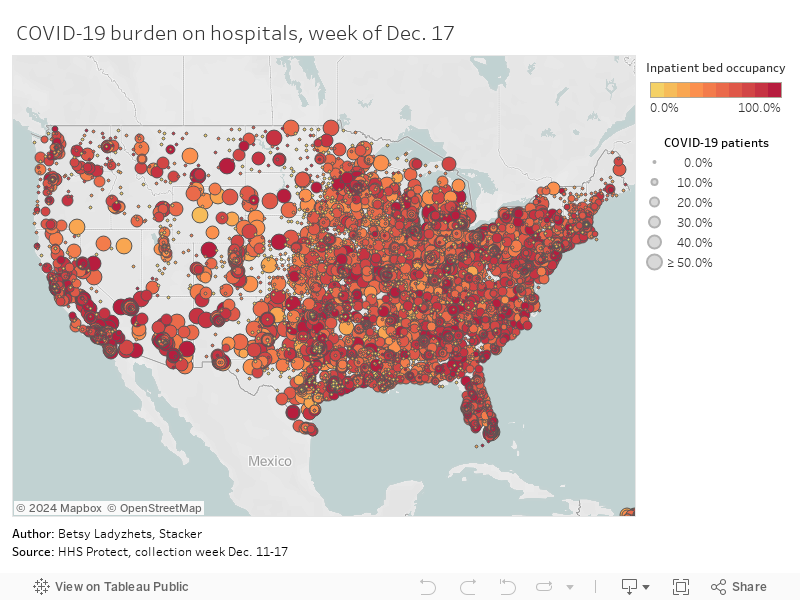
To get started with this dataset, you can zoom in to look at your community on this Tableau dashboard I made, visualizing the most recent week of data. (That most recent week of data reflects November 27 through December 3. As the dataset was first published last Monday, December 7, I’m anticipating an update tomorrow.)
Or, if you’d like to see more technical details on how to use the dataset, check out this community FAQ page created by data journalists and researchers at Careset Systems, the University of Minnesota, COVID Exit Strategy, and others.
Finally, for more exploration of the research possibilities I outlined above, you can read the COVID Tracking Project’s analysis. The post includes some pretty striking comparisons from summer outbreaks to now.

Leave a comment