
Since mid-December, the Department of Health and Human Services has published a dataset on how the pandemic is impacting individual hospitals across the country. (You can read the CDD’s detailed description of that dataset here.) One of the most useful—and, in my opinion, most under-utilized—aspects of this facility dataset is that it provides COVID-19 hospital admissions broken out by age, allowing data users to discern which age groups are getting hardest hit by severe COVID-19 cases in different parts of the country.
This week, the HHS made it much easier to do that analysis. The agency added hospital admissions by age to its state-level hospitalization dataset. Now, if you want to see a patient breakdown for your state, you can simply look at the state-level info already compiled by HHS data experts, rather than summing up numbers from the facility-level info yourself.
Besides that convenience factor, there are two big advantages of the state-level info:
- The state-level dataset is updated daily, while the facility-level dataset is updated weekly. More frequent data updates allow for more specific time series analysis.
- Low patient numbers aren’t suppressed. In the facility-level dataset, patient numbers between 1 and 4 are suppressed with an error value (-999999) to protect patient privacy. In the age data, this happens at a lot of facilities, so it’s impossible for an outside data user to calculate accurate totals for a given city, county, or state. On the other hand, with HHS experts doing the aggregation in the state-level dataset, no values need to be obscured—basically, these state-level figures are much more accurate.
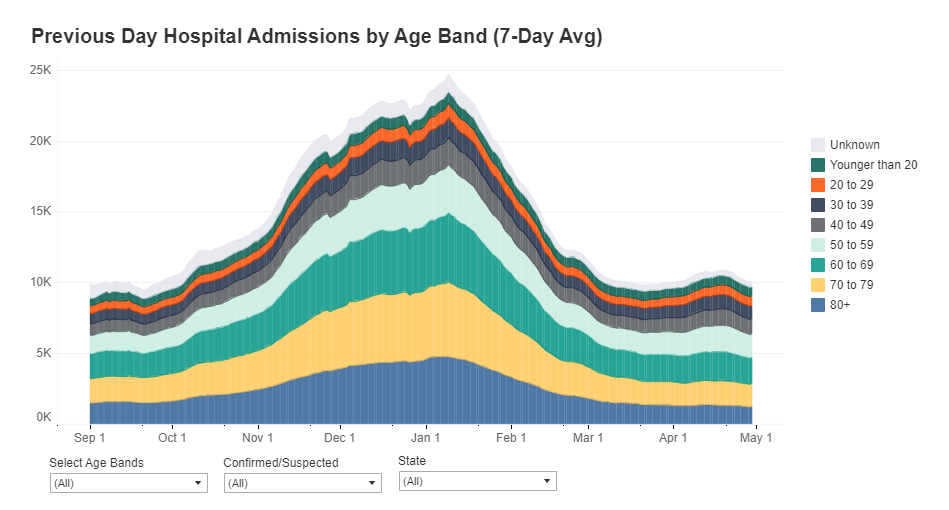
The age groups in the state-level dataset match those available in the facility-level dataset: pediatric COVID-19 patients, patients age 18-19, patients in ten-year age ranges from 20 to 79, and patients age 80 or older. HHS also splits the patient counts into those who have confirmed COVID-19 cases (meaning their diagnosis is verified by a PCR test) and those who have suspected cases (meaning the patients have COVID-19 symptoms or a positive result on a non-PCR test.)
You can find these new data in two places:
- COVID-19 Reported Patient Impact and Hospital Capacity by State (daily updates), which includes data for the most recent day only.
- COVID-19 Reported Patient Impact and Hospital Capacity by State Timeseries, which includes a full state-by-state time series going back to July 2020.
Also, Conor Kelly, COVID Tracking Project volunteer and COVID-19 visualizer extraordinaire, has added these new data to his COVID-19 Tableau dashboard. (See “Hosp. Admissions Over Time,” then “Admissions by Age.”) Highly recommend checking out that dashboard and exploring the trends for your state.
(Finally, it is possible I’m a little annoyed that the HHS made this lovely update immediately after I turned in an assignment in which I did this analysis the long way, with the facility-level dataset. Look out for that story early next week.)

Leave a comment