Tag: XBB.1.5

  • National numbers, April 23

    National numbers, April 23

    Coronavirus concentrations are trending down in Boston’s wastewater, a promising signal.

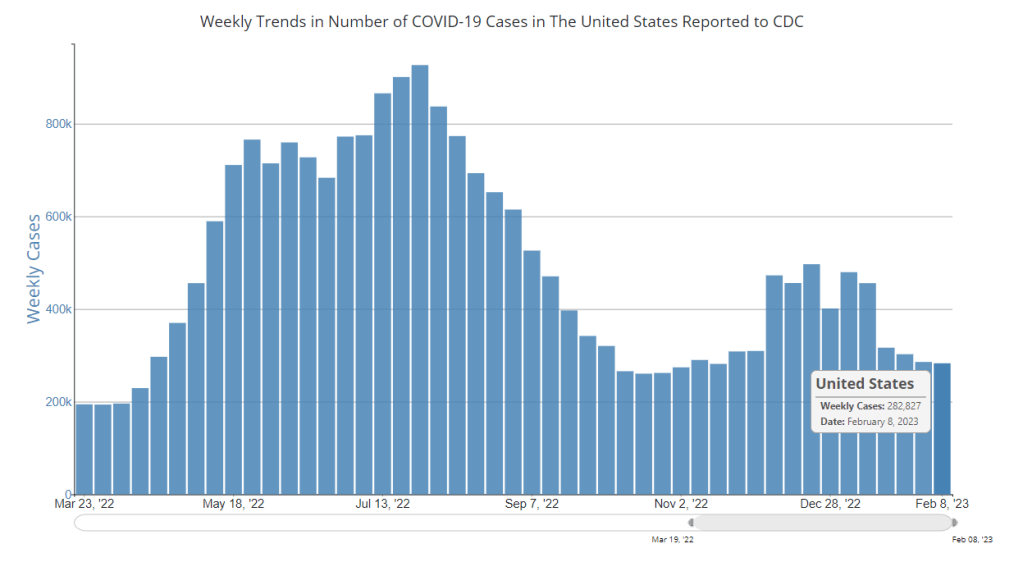
    In the past week (April 13 through 19), the U.S. officially reported about 94,000 new COVID-19 cases, according to the CDC. This amounts to:

    • An average of 13,000 new cases each day
    • 7% fewer new cases than last week (April 6-12)

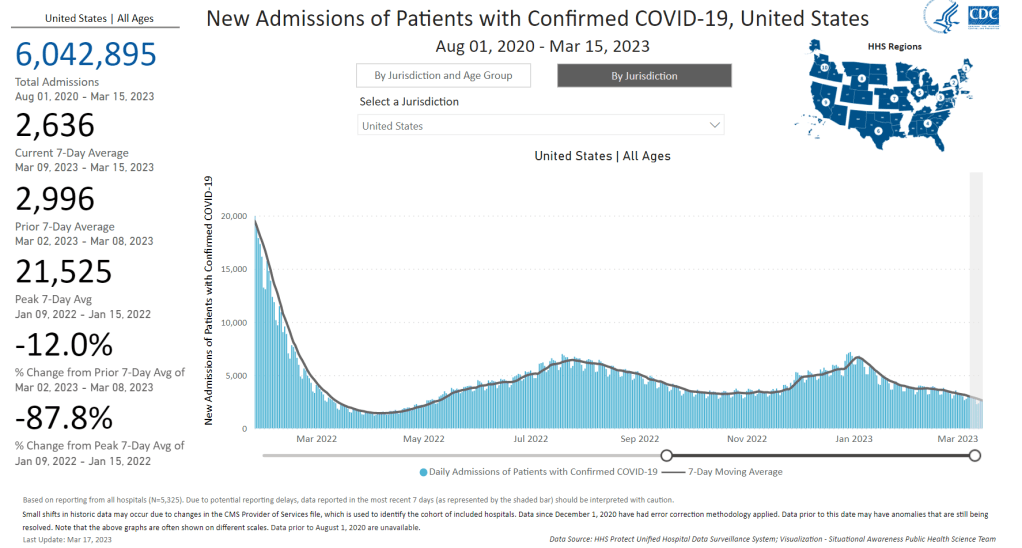
    In the past week, the U.S. also reported about 12,000 new COVID-19 patients admitted to hospitals. This amounts to:

    • An average of 1,700 new admissions each day
    • 3.7 total admissions for every 100,000 Americans
    • 8% fewer new admissions than last week

    Additionally, the U.S. reported:

    • 1,200 new COVID-19 deaths (170 per day)
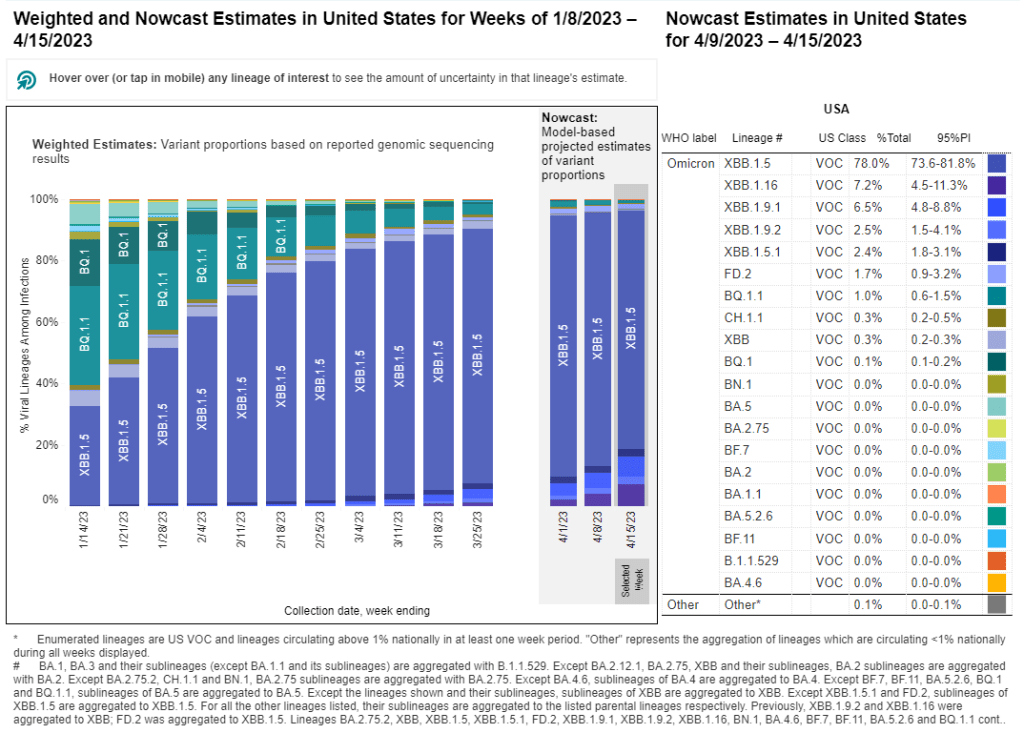
    • 74% of new cases are caused by Omicron XBB.1.5; 11% by XBB.1.9; 10% by XBB.1.16 (as of April 22)
    • An average of 35,000 vaccinations per day

    Across the U.S., COVID-19 spread continues at a moderately high plateau as newer versions of Omicron compete with XBB.1.5. Officially-reported cases and new hospitalizations declined by 7% and 8% respectively, compared to the prior week.

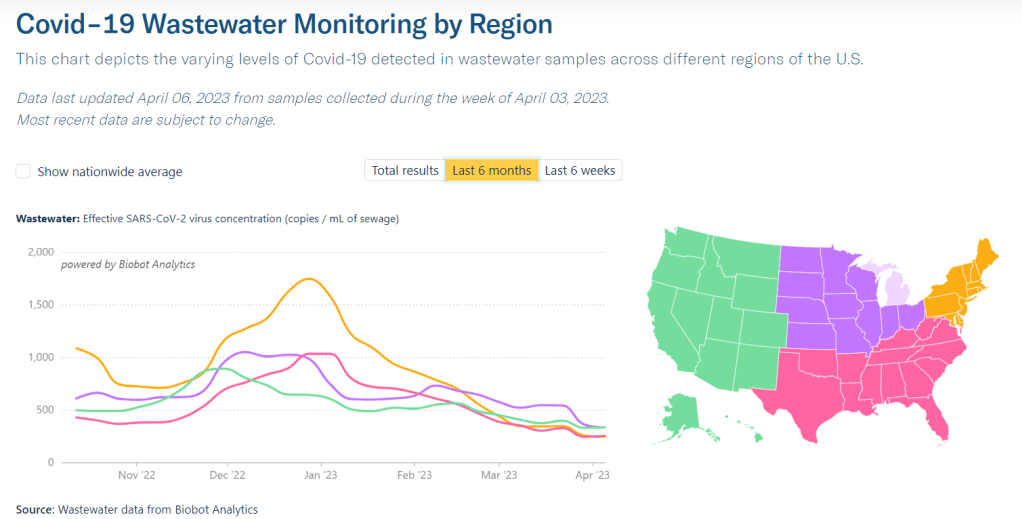
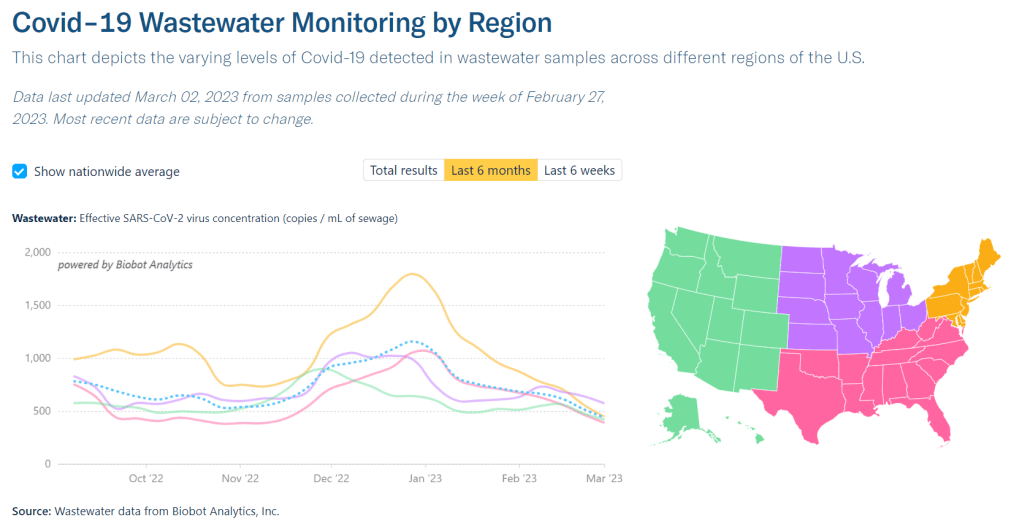
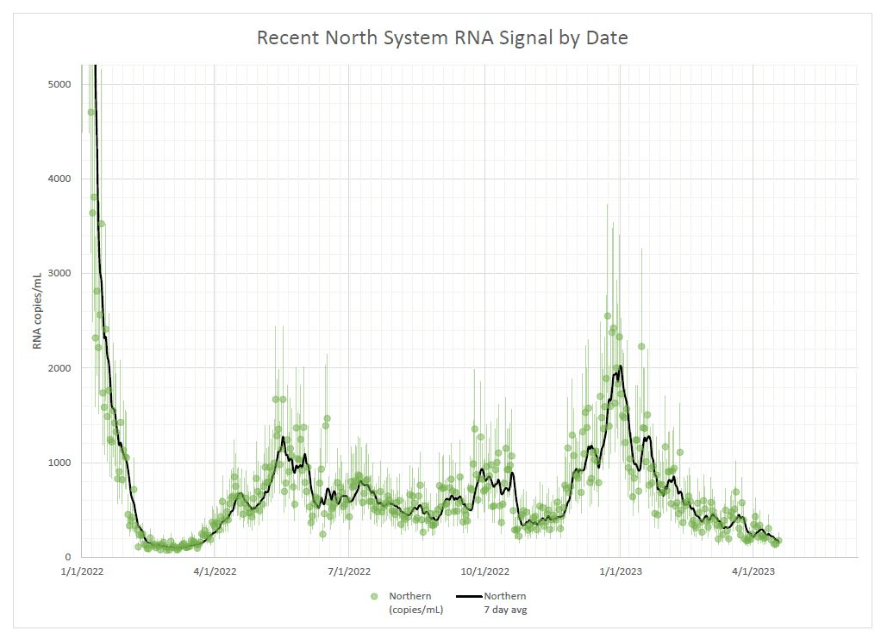
    Wastewater surveillance data from Biobot and from the CDC similarly show that COVID-19 spread is at a plateau. Nationally, coronavirus concentrations in sewage are higher than they were at this point in 2021 (when the initial vaccine rollout was in full swing), but lower than at this point in 2022 (when BA.2 had started spreading widely).

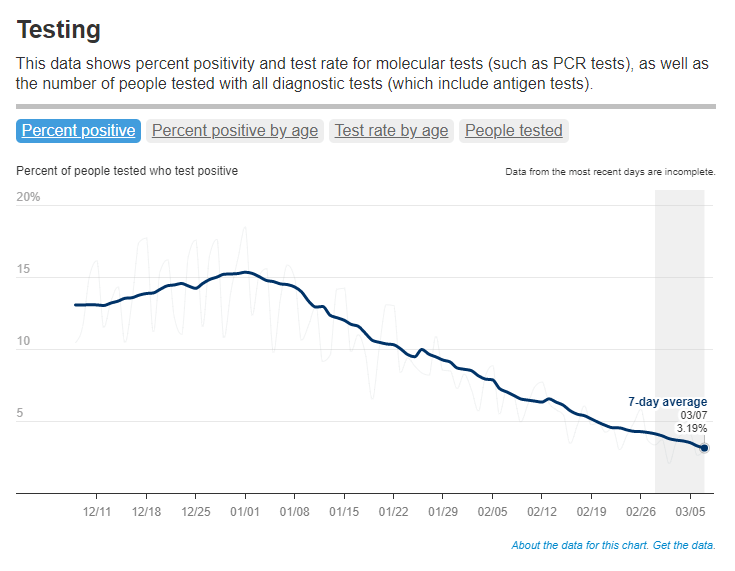
    Of course, it’s important to flag that official case counts are becoming even more unreliable these days, as PCR testing becomes increasingly difficult to access and state health departments no longer prioritize timely reporting to the CDC. According to CDC, five states didn’t report COVID-19 cases and deaths last week: Arkansas, Florida, Iowa, Mississippi, and Pennsylvania. (Iowa has permanently stopped reporting.)

    These case reporting issues are likely to continue—and perhaps accelerate—when the federal public health emergency ends next month. I’m thinking about how to adjust these National Numbers reports when that happens; that will likely involve foregrounding wastewater data and hospitalizations rather than cases.

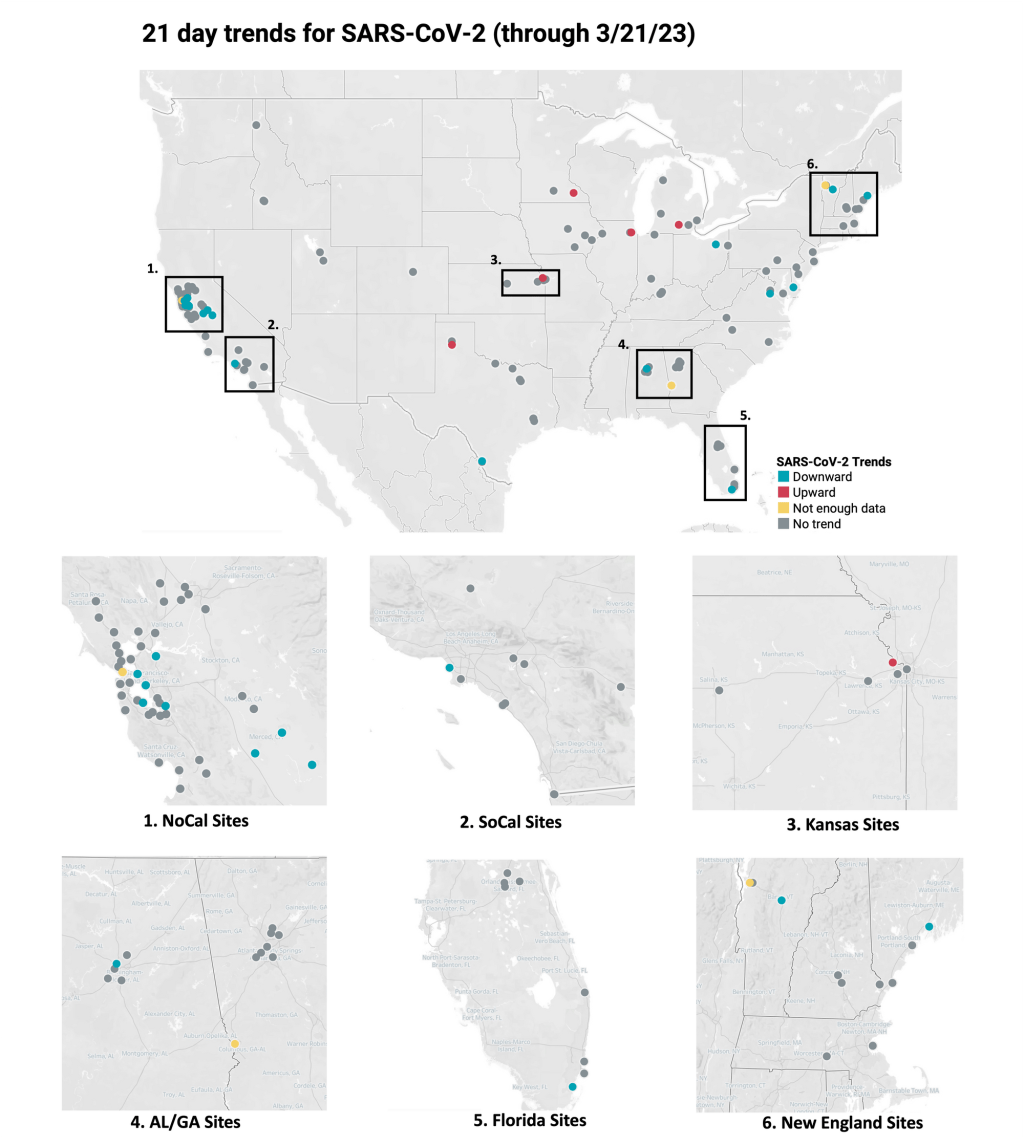
    Regionally, Biobot’s surveillance shows a slight uptick in coronavirus spread on the West Coast and declines in the other major regions. Some counties in California have reported recent increases in wastewater, according to Biobot and WastewaterSCAN, but it’s currently tough to tell if this is a sustained surge or isolated outbreaks.

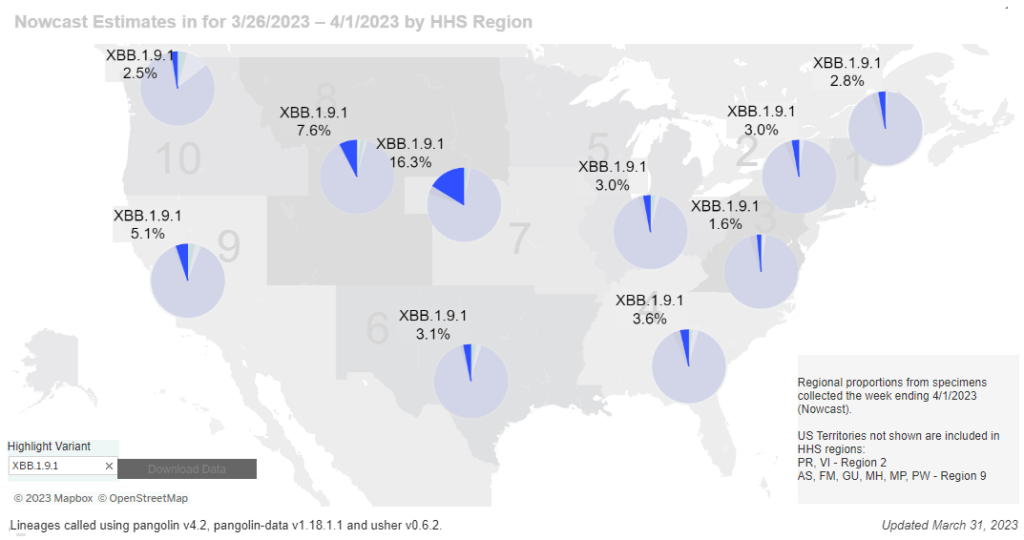
    The West Coast and Midwest continue to be hotspots for newer versions of Omicron, according to the CDC’s estimates, with XBB.1.9 still most prevalent by far in the region including Iowa, Kansas, Missouri, and Nebraska. Nationwide, the CDC estimates that XBB.1.9 caused about 11% of new cases in the last week and that XBB.1.16 caused 10% of new cases.

    XBB.1.16 (also called “Arcturus”) was recently classified as a variant of interest by the World Health Organization because it can spread significantly faster than other Omicron lineages. The variant is likely to “spread globally and contribute to an increase in case incidence,” according to the WHO.

    While I’m wary of the new variants, I have been heartened to see coronavirus levels in wastewater remain mostly at plateaus—or even decline—in many places across the U.S. In Boston, for example, coronavirus levels have been on a downward trend since early 2023. I hope to see this trend continue. 

  • National numbers, April 16

    National numbers, April 16

    New subvariants XBB.1.16, XBB.1.9.1, and XBB.1.9.2 are on the rise, according to the CDC’s estimates.

    In the past week (April 6 through 12), the U.S. officially reported about 100,000 new COVID-19 cases, according to the CDC. This amounts to:

    • An average of 15,000 new cases each day
    • 17% fewer new cases than last week (March 30-April 5)

    In the past week, the U.S. also reported about 13,000 new COVID-19 patients admitted to hospitals. This amounts to:

    • An average of 1,900 new admissions each day
    • 3.9 total admissions for every 100,000 Americans
    • 14% fewer new admissions than last week

    Additionally, the U.S. reported:

    • 1,300 new COVID-19 deaths (190 per day)
    • 78% of new cases are caused by Omicron XBB.1.5; 9% by XBB.1.9; 7% by XBB.1.16 (as of April 15)
    • An average of 35,000 vaccinations per day (CDC link)

    COVID-19 spread appears to be at a continued plateau nationally, with slight declines in cases, hospitalizations, and viral concentrations in wastewater. New variants are on the horizon, though, at a time when data are becoming increasingly less reliable. 

    The CDC reported about 100,000 new cases this week, the lowest this number has been since early summer 2021. Unlike that period, however, PCR tests are much less available and reporting infrastructures are being dismantled.

    Wastewater surveillance data from Biobot show that transmission is actually several times higher now than it was at that previous low point. We’re in an undercounted plateau, rather than a real lull. Even so, less COVID-19 is spreading now than we’ve seen throughout the last few months.

    To get a more accurate picture of potential COVID-19 case counts in your area, I recommend going to the Iowa COVID-19 Tracker, an independent dashboard run by Sara Anne Willette. Willette has mapped out “likely cases per 100,000 people” by county, by multiplying the CDC’s data by 20 to account for underreporting.

    Wastewater data suggest that most parts of the U.S. are seeing steady (though slight) declines in transmission, with the exception of the West coast. Some counties in California have reported increased coronavirus levels in wastewater in the last week, according to Biobot and WastewaterSCAN, including parts of the Bay Area.

    One culprit for the increases could be newer Omicron subvariants, particularly XBB.1.9 and XBB.1.16. The CDC added XBB.1.16—which has drawn international concern, due to its connection with a recent surge in India—to its variant proportion estimates, along with XBB.1.9.2, a relative of XBB.1.9.1. (Yes, we’re getting into alphabet soup territory again here.)

    Nationally, the CDC estimates that XBB.1.16 caused about 7% of new cases in the last week, while the XBB.1.9s together caused 9%. At the regional level, XBB.1.16 is more prevalent in the West and Southwest (at over 20% of new cases in the region including Texas and other Gulf coast states), while the XBB.1.9s are more prevalent in the Midwest.

    The CDC published its second-to-last data update yesterday (which is still called the “Weekly Review,” even though it is far from weekly at this point). According to this update, most of the CDC’s public COVID-19 data “won’t be affected by the end of the public health emergency,” though the agency says it’ll provide more details in its final update on May 12.

    I personally expect that, while the national data systems might remain in place, more state and local health agencies will stop reporting, as we saw from Iowa recently. This will, of course, make the numbers less and less reliable.

  • National numbers, April 9

    National numbers, April 9

    COVID-19 spread is at a plateau in all four major regions of the U.S., according to wastewater data from Biobot.

    In the past week (March 30 through April 5), the U.S. officially reported about 120,000 new COVID-19 cases, according to the CDC. This amounts to:

    • An average of 17,000 new cases each day
    • 37 total new cases for every 100,000 Americans
    • 12% fewer new cases than last week (March 23-29)

    In the past week, the U.S. also reported about 15,000 new COVID-19 patients admitted to hospitals. This amounts to:

    • An average of 2,100 new admissions each day
    • 4.5 total admissions for every 100,000 Americans
    • 12% fewer new admissions than last week

    Additionally, the U.S. reported:

    • 1,800 new COVID-19 deaths (250 per day)
    • 88% of new cases are caused by Omicron XBB.1.5; 5% by XBB.1.9.1; 2% by XBB.1.5.1; 0.4% by CH.1.1 (as of April 8)
    • An average of 40,000 vaccinations per day

    COVID-19 spread in the U.S. remains at a high plateau, according to reported cases, hospitalizations, and wastewater surveillance. Experts are watching new variants that mutated from XBB as potential drivers of more transmission this spring.

    While the case numbers may seem low, remember that cases are now severely undercounted—potentially by up to 20 times. So, when the CDC reported about 37 new cases per 100,000 people last week, the true number could be closer to 700 new cases per 100,000. It’s becoming harder and harder to get a PCR test, as sites shut down and the federal health emergency’s end approaches, which will further drive undercounting.

    Wastewater data, on the other hand, continue to show that coronavirus levels in the U.S. are significantly higher than they were at this time in 2022 and 2021. Last week, I wrote that Biobot’s dashboard showed a slight increase in COVID-19 spread across the country; after this week’s data updates, that appears to have been a blip, with the company’s national surveillance again showing a plateau.

    Biobot’s regional data also indicates that COVID-19 spread has remained relatively consistent in the last few weeks. The Northeast and Midwest have slightly higher coronavirus levels than the South and West, but there aren’t significant differences between these regions.

    As I wrote last week, new subvariant XBB.1.9.1 remains more prevalent in the Midwest, particularly the region including Iowa, Kansas, Missouri, and Nebraska (where it caused about 18% of new cases in the last week, per CDC estimates). Some wastewater testing sites in these states have reported increases recently, but there isn’t a consistent increase across the board.

    Nationally, the CDC estimates that XBB.1.9.1 caused about 5% of new cases nationwide in the week ending April 8, compared to 88% caused by XBB.1.5. XBB.1.9.1 has been growing relatively slowly, so it may be a few more weeks before we see it either outcompete XBB.1.5 or die out at low levels. Experts are also watching XBB.1.16, which drove a surge in India recently but has not shown up in large numbers in the U.S. yet.

    Will the U.S. see a new surge this spring? It seems possible, thanks to Omicron’s continued evolution and our lack of collective safety measures. But continued declines in data reporting will make it harder to see this surge than it’s ever been.

    In this environment, wastewater surveillance is growing more and more valuable. It’s also probably a good idea to keep taking some basic precautions (like masking in public indoor spaces, or regularly testing) no matter how low the reported cases get in your community.

  • National numbers, April 2

    National numbers, April 2

    New subvariant Omicron XBB.1.9.1 is most prevalent in the Midwest, according to CDC estimates.

    In the past week (March 23 through 29), the U.S. officially reported about 140,000 new COVID-19 cases, according to the CDC. This amounts to:

    • An average of 20,000 new cases each day
    • 43 total new cases for every 100,000 Americans
    • 9% fewer new cases than last week (March 16-22)

    In the past week, the U.S. also reported about 17,000 new COVID-19 patients admitted to hospitals. This amounts to:

    • An average of 2,400 new admissions each day
    • 5.1 total admissions for every 100,000 Americans
    • 5% fewer new admissions than last week

    Additionally, the U.S. reported:

    • 1,600 new COVID-19 deaths (230 per day)
    • 88% of new cases are caused by Omicron XBB.1.5; 5% by XBB.1.9.1; 2% by XBB.1.5.1; 0.4% by CH.1.1 (as of March 18)
    • An average of 40,000 vaccinations per day

    While official COVID-19 cases and hospitalizations continue to trend ever-so-slightly downward, wastewater surveillance data show potential new upticks in transmission. Despite continued minimal safety measures in most places, we have to remain wary of a potential spring surge.

    Official data from the CDC suggested that cases and new hospital admissions dropped very slightly last week, compared to the week prior. But case data continue to be plagued with reporting delays; again this week, multiple states (Florida, Delaware, Mississippi, Oklahoma) reported no cases or had other issues. These delays make it difficult to assess patterns at state or county levels.

    Wastewater surveillance data provide more accurate early warnings about potential rising transmission. This week, Biobot’s data suggest slight increases in all four major regions of the country. It’s worth noting, though, that Biobot’s most recent data are preliminary. I’ll be closely watching the dashboard’s next updates, this coming Tuesday and Thursday.

    The latest Omicron variant of concern, XBB.1.9.1, could be one reason for increasing coronavirus levels. This subvariant caused an estimated 5% of new cases across the country nationwide last week, according to the CDC’s Nowcast analysis. At the same time, XBB.1.5 has declined for the first time since it emerged a couple of months ago, suggesting XBB.1.9.1 might slowly outcompete it.

    XBB.1.9.1 is most prevalent in the Midwest, particularly the region including Iowa, Kansas, Missouri, and Nebraska. Some counties in this region are also reporting significant coronavirus increases in their wastewater, according to Biobot and WastewaterSCAN. Missouri’s wastewater dashboard similarly shows increases across the state.

    In our current era of high background coronavirus spread (and few-to-no widespread safety measures), a new variant can easily cause concerning outbreaks. It’s important to remember that, no matter how much the virus evolves, simple measures like masks and ventilation can still make transmission less likely.

  • National numbers, March 26

    National numbers, March 26

    Data from WastewaterSCAN suggest that most sites in its network saw downward coronavirus trends or plateaus in recent weeks.

    In the past week (March 16 through 22), the U.S. officially reported about 130,000 new COVID-19 cases, according to the CDC. This amounts to:

    • An average of 19,000 new cases each day
    • 41 total new cases for every 100,000 Americans
    • 13% fewer new cases than last week (March 9-15)

    In the past week, the U.S. also reported about 17,000 new COVID-19 patients admitted to hospitals. This amounts to:

    • An average of 2,400 new admissions each day
    • 5.2 total admissions for every 100,000 Americans
    • 9% fewer new admissions than last week

    Additionally, the U.S. reported:

    • 2,000 new COVID-19 deaths (300 per day)
    • 90% of new cases are caused by Omicron XBB.1.5; 3% by XBB.1.9.1; 2% by XBB.1.5.1; 0.4% by CH.1.1 (as of March 18)
    • An average of 40,000 vaccinations per day

    Nationally, we continue to see the same slow decline of COVID-19 spread across the U.S., as shown by official case data, hospitalizations, and wastewater surveillance.

    Reported cases dropped by 13% last week compared to the week prior, while new hospital admissions dropped by 9%. As I’ve noted in the last couple of updates, the CDC continues to deal with reporting delays from different state health departments. This week, Texas, Arkansas, Florida, and Indiana did not report cases to the CDC.

    Wastewater surveillance data from Biobot and the WastewaterSCAN project suggest that COVID-19 levels are at slow declines or plateaus in most parts of the country, but some places may be seeing small increases. Biobot’s dashboard shows slight upticks in the Northeast, Midwest, and West coast regions, as of its March 22 update. 

    Overall, Biobot’s data suggests that national coronavirus concentrations are lower than they’ve been in about a year—but still higher than we’ve seen at this point in 2021 and 2022. The low case numbers that health departments are putting out mask a high baseline of infections, in which many people are not getting PCR tests or reporting their cases to the healthcare system.

    Data from the WastewaterSCAN project suggest that most of the project’s 148 monitoring sites reported downward trends or plateaus in coronavirus levels over the last three weeks. A few places have reported upticks, though, including sites in Kansas, Michigan, South Carolina, Massachusetts, and Oklahoma. 

    One reason for these upticks could be XBB.1.9.1, the latest Omicron subvariant to draw concern among virologists. The CDC started reporting estimates for XBB.1.9.1 in its latest variant update (this Friday): the agency estimates that this variant caused 2.5% of new cases nationwide last week, with higher prevalence (about 13%) in the Midwest region that includes Iowa, Kansas, Missouri, and Nebraska.

    XBB.1.9.1 is doubling “roughly every 8 days,” according to Marc Johnson, a virologist at the University of Missouri who leads the state’s wastewater surveillance program. Johnson predicts that this subvariant will be dominant in the U.S. by the end of April, but it could face competition from XBB.1.16—another descendant of XBB that has been spreading rapidly in India. 

    Could the spread of these XBB sublineages across the U.S. cause a significant rise in cases and hospitalizations? It’s hard to say, given the complex picture of immunity in the country, with millions of people recently infected by a variety of variants. “Future waves are getting harder and harder to forecast,” Katelyn Jetelina wrote in Your Local Epidemiologist this week. Regardless, the same safety measures (masks, testing, etc.) continue to work against all new versions of the virus.

  • National numbers, March 19

    National numbers, March 19

    New hospital admissions have fallen significantly from their recent peak in January, but are still much higher than at this time last year. Chart from the CDC.

    In the past week (March 9 through 15), the U.S. officially reported about 150,000 new COVID-19 cases, according to the CDC. This amounts to:

    • An average of 21,000 new cases each day
    • 46 total new cases for every 100,000 Americans
    • 20% fewer new cases than last week (March 2-8)

    In the past week, the U.S. also reported about 19,000 new COVID-19 patients admitted to hospitals. This amounts to:

    • An average of 2,800 new admissions each day
    • 5.9 total admissions for every 100,000 Americans
    • 10% fewer new admissions than last week

    Additionally, the U.S. reported:

    • 1,700 new COVID-19 deaths (240 per day)
    • 90% of new cases are caused by Omicron XBB.1.5; 2% by XBB.1.5.1; 0.5% by CH.1.1 (as of March 18)
    • An average of 40,000 vaccinations per day

    The trend continues: COVID-19 spread is still on the decline across the U.S., but it’s a slow decline. These updates are getting pretty repetitive to write, as we’ve been seeing this pattern since late January—which, honestly, I’m taking as a good sign.

    Last week, I noted that the drop in official COVID-19 cases (reported to the CDC) was exaggerated slightly because of data delays; three states didn’t report cases in the week ending March 8. This week, the same thing happened for three different states: Texas, Arkansas, and Indiana. We’ll likely continue to see reporting issues like this, as state and local health departments put fewer resources into tracking COVID-19.

    Even so, the official case data, hospital admissions, and wastewater surveillance all point to continued decreases in coronavirus transmission. National hospital admissions dropped by about 12% this week compared to the week prior. But there are still a lot of Americans getting severe COVID-19 symptoms, with more than 3,000 people newly hospitalized each week for the last month.

    Wastewater surveillance data from Biobot suggest that coronavirus spread is getting lower, but it’s still at much higher levels nationally than we saw at this time in 2021 and 2022. Regionally, the Midwest now has slightly more virus circulating than other parts of the country, but all four major regions are seeing slow declines or plateaus.

    In other good news: flu activity is still low nationally, according to the CDC’s flu surveillance. Experts had worried we might see a second flu surge, driven by a different strain of the influenza virus, after the initial surge died down in January. But so far, that hasn’t happened. Almost every state reported moderate or low levels of influenza-like activity in the week ending March 11.

    XBB.1.5 continues to be the dominant coronavirus lineage in the U.S., causing an estimated 90% of cases nationwide in the week ending March 18. XBB.1.5.1, a descendant of XBB.1.5, is growing slowly (it caused an estimated 2% of cases nationwide this week) and doesn’t seem to be very competitive yet. The CDC also has yet to break out XBB.1.9 or XBB.1.16, other subvariants that mutated from XBB.

    Yesterday, I spoke about wastewater surveillance at New York City School of Data, a civic conference that’s part of the city’s Open Data Week. While the conference wasn’t focused on health or science topics, the organizers required masks and checked attendees’ vaccinations. I also brought my CO2 monitor to the event, and found ventilation was generally good in the session rooms. This conference was a nice reminder that some organizations are still following the data and science on COVID-19 precautions.

  • National numbers, March 12

    National numbers, March 12

    In New York City, where I live, COVID-19 test positivity is the lowest it’s been since early spring 2022. Chart from the NYC health department.

    In the past week (March 2 through 8), the U.S. officially reported about 170,000 new COVID-19 cases, according to the CDC. This amounts to:

    • An average of 24,000 new cases each day
    • 52 total new cases for every 100,000 Americans
    • 25% fewer new cases than last week (February 23-March 1)

    In the past week, the U.S. also reported about 20,000 new COVID-19 patients admitted to hospitals. This amounts to:

    • An average of 2,800 new admissions each day
    • 6.1 total admissions for every 100,000 Americans
    • 13% fewer new admissions than last week

    Additionally, the U.S. reported:

    • 1,900 new COVID-19 deaths (270 per day)
    • 90% of new cases are caused by Omicron XBB.1.5; 2% by XBB.1.5.1; 1% by CH.1.1 (as of March 11)
    • An average of 50,000 vaccinations per day

    Following the same pattern we’ve seen for the last few weeks, COVID-19 spread is still on the decline nationally. Official case counts, hospital admissions, and wastewater surveillance data all continue to point in this direction.

    This week, the decline in CDC-reported cases was sharper than it’s been in a couple of months (with 25% fewer cases reported than the prior week). But this may be due to reporting issues, rather than an actual change in transmission patterns: the CDC’s case trends page explains that Florida, Washington State, and Utah all did not report cases in the week ending March 8.

    Still, I’m heartened by the fact that hospital admissions—which are reported more reliably—dropped by 13% this week, compared to smaller week-over-week changes over the last month. Wastewater surveillance data from Biobot also continue to show steady declines, though we’re still not close to the national lows observed during this time in 2021 and 2022.

    Biobot’s data suggest declining surveillance in all four major regions of the country, with coronavirus levels in the Northeast now dropping below the Midwest, South, and West coast. Some individual counties in the Midwest are still reporting increased viral concentrations in their wastewater; I specifically noted Sheridan County and Teton County, Wyoming in Biobot’s data.

    Omicron XBB.1.5 has been the dominant variant in the U.S. since mid-January, and we have yet to see a new subvariant rise to meaningfully compete with it. CH.1.1, which has driven increased transmission in other parts of the world, has remained under 2% of new cases nationally, per the CDC’s estimates.

    The CDC’s latest variant update also breaks out XBB.1.5.1, an offshoot of XBB.1.5, at about 2% of new cases nationally. I have yet to see much discussion of this offshoot or how it differs from XBB.1.5; I’ll cover it more in future issues as we learn more. In addition, variant experts are keeping an eye on XBB.1.9, XBB.1.16, and other subvariants that have further mutated from the XBB lineage.

    In his latest Substack newsletter, long-time COVID-19 commentator Eric Topol suggests that the U.S. might be in a welcome “break from COVID-19 waves.” He points to XBB.1.5’s dominance and the fact that its rise “was not associated with a surge of COVID-19 hospitalizations or deaths in the United States or elsewhere in the world” despite the subvariant’s increased capacity to spread.

    At the same time, Topol explains the problem with our current “high baseline” of continued COVID-19 spread, which leads to continued severe cases among vulnerable people and the ongoing risk of Long COVID. He also explores the potential for another Omicron-like event, which would potentially cause another major surge. His article is helpful for understanding our current COVID-19 moment.

    In NYC, where I live, COVID-19 case rates and test positivity are lower than they’ve been since early 2022—while still much higher than we saw last spring post-Omicron BA.1, or in spring 2021 as vaccines were widely rolled out. And the numbers are likely going to get more unreliable soon, as the city begins to wind down public testing sites.

  • National numbers, March 5

    National numbers, March 5

    Wastewater data from Biobot suggest that COVID-19 spread is still declining throughout the country, but slowly.

    In the past week (February 23 through March 1), the U.S. officially reported about 230,000 new COVID-19 cases, according to the CDC. This amounts to:

    • An average of 32,000 new cases each day
    • 69 total new cases for every 100,000 Americans
    • 5% fewer new cases than last week (February 16-22)

    In the past week, the U.S. also reported about 23,000 new COVID-19 patients admitted to hospitals. This amounts to:

    • An average of 3,300 new admissions each day
    • 7.1 total admissions for every 100,000 Americans
    • 8% fewer new admissions than last week

    Additionally, the U.S. reported:

    • 2,300 new COVID-19 deaths (330 per day)
    • 90% of new cases are caused by Omicron XBB.1.5; 8% by BQ.1 and BQ.1.1; 1% by CH.1.1 (as of March 4)
    • An average of 50,000 vaccinations per day

    At the national level, major COVID-19 metrics continue to indicate slow declines in transmission. As I’ve been writing for the last few weeks, we’re at a “low tide” point in COVID-19 spread: clearly lower than the peaks that occur after holidays or new variants, but much higher than the baselines that we experienced before the Omicron era.

    Official cases reported by the CDC dropped by 5% last week compared to the week prior, while new hospital admissions dropped by 8%. Wastewater data from Biobot show declining coronavirus levels nationally, but viral concentrations in wastewater are twice as high as they were at this point in 2021 or 2022.

    Biobot’s regional data suggest that the Midwest has overtaken the Northeast in coronavirus concentrations for the first time since late summer 2022. Both regions are seeing declines, but the declining spread in the Northeast has accelerated a bit faster than that in the Midwest.

    While most individual states and counties are reporting COVID-19 declines as well, a few have reported increased coronavirus in their wastewater in recent weeks. This includes counties in Idaho, Wyoming, Montana, Florida, Texas, and others in the Midwest and South.

    Omicron XBB.1.5 continues to be the dominant variant in the U.S., now accounting for about 90% of new cases in the last week, per CDC estimates. Viral evolution experts will be watching to see if XBB.1.5 mutates further, or if some other variant arrives to compete with it.

    As we head into the spring, U.S. COVID-19 data continue to get harder to find and less reliable. Last week, the Department of Health and Human Services announced that it would retire its Community Profile Reports, which I used to rely on as a regular source for this newsletter.

    Meanwhile, a study from Denis Nash and his team at the City University of New York that estimated true COVID-19 prevalence during the BA.4/BA.5 surge last summer was recently published in the journal Preventative Medicine. I covered this study when it was released as a preprint last fall, and find it striking that no other estimates like this have emerged since then.

  • Sources and updates, February 26

    • Deaths in U.S. prisons: Throughout the pandemic, the UCLA COVID Behind Bars Data Project has been a leading source for data on COVID-19 cases and deaths in carceral settings. As COVID-specific data on prisons and jails have become more sporadic, the project recently turned its attention to overall mortality data in these settings. Last week, the UCLA team released a new dataset sharing all-cause deaths in prisons through 2020, which combines data from public reports and records requests. The full dataset is available on GitHub, and a summary of this project’s findings on all-cause mortality was published in the New York Times last weekend.
    • BIOFIRE syndromic trends data: BIOFIRE Diagnostics is a biotech company focused on diagnostic testing, offering tests for a variety of viruses, bacteria, and other pathogens. The company publishes anonymized test results from its labs on its Syndromic Trends dashboard; this dashboard is a helpful way to get an overview of test positivity for COVID-19 compared to other common diseases. (H/t Force of Infection.)
    • R&D roadmap for COVID-19 vaccines: The University of Minnesota’s Center for Infectious Disease Research and Policy has published a new report outlining the research and development steps needed for the world to produce coronavirus vaccines that are “broadly protective,” not tied to a specific variant. It includes recommendations for research on virology, immunology, and vaccine technologies, along with information on using animal models and guidance on vaccine policy. Related: the CDC’s Advisory Community on Immunization Practices met this week to discuss COVID-19 and other vaccines.
    • CDC reports on travel surveillance: Two new studies about COVID-19 among international travelers to the U.S. were published in this week’s CDC Morbidity and Mortality Weekly Report. Both studies describe results from the agency’s Travel Surveillance program, which is a collaboration with biotech company Ginkgo Bioworks and testing company XpresCheck. One report compares traveler test results from before and after the U.S. ended its pre-departure testing requirement for international flights, finding that travelers were much more likely to have COVID-19 after the requirement was lifted. The second report provides results from a pilot program testing airplane wastewater at JFK Airport; this report found that the vast majority of plane samples tested were positive for SARS-CoV-2, and researchers identified a variety of Omicron variants. More work is needed to really get airplane wastewater testing going in the U.S., but it’s good to see early results showing this program’s feasibility.
    • Early data from XBB.1.5 in NYC: Another notable study in CDC MMWR this week provided analysis from New York City’s health department on Omicron XBB.1.5. The subvariant was first identified in the city in October 2022 (though it may have evolved somewhere else), and quickly spread through the region; it accounted for 81% of sequenced COVID-19 test samples by early January. The NYC health department linked sequencing data with patient outcomes data, finding that people infected with XBB.1.5 were not significantly more likely to be hospitalized or to die from COVID-19 compared to those infected with other variants. In other words, XBB.1.5 appears to not cause more severe disease, based on this report.
    • Predicting COVID-19 cases based on wastewater results: One more newsworthy study to share this week: researchers at Hokkaido University developed a mathematical model to predict COVID-19 cases based on coronavirus concentration levels in Sapporo, Japan. I’m always on the lookout for studies like this, as wastewater data become increasingly important to track true infection numbers. (Here’s a prior example, from the University of Florida.) Of course, it’s worth noting that the Hokkaido researchers had consistent wastewater and case data from spring 2020 through 2022 to use for their model; for wastewater researchers working in the U.S. now, that consistency is often harder to achieve.

  • National numbers, February 12

    National numbers, February 12

    National COVID-19 cases have reached a plateau. Note that the cases reported to the CDC are a significant undercount of actual infections.

    In the past week (February 2 through 8), the U.S. officially reported about 280,000 new COVID-19 cases, according to the CDC. This amounts to:

    • An average of 40,000 new cases each day
    • 86 total new cases for every 100,000 Americans
    • 1% fewer new cases than last week (January 26-February 1)

    In the past week, the U.S. also reported about 26,000 new COVID-19 patients admitted to hospitals. This amounts to:

    • An average of 3,700 new admissions each day
    • 7.8 total admissions for every 100,000 Americans
    • 6% fewer new admissions than last week

    Additionally, the U.S. reported:

    • 3,200 new COVID-19 deaths (450 per day)
    • 75% of new cases are caused by Omicron XBB.1.5; 20% by BQ.1 and BQ.1.1; 1% by CH.1.1 (as of February 11)
    • An average of 80,000 vaccinations per day

    Nationwide, COVID-19 spread appears to be in a plateau: not substantially increasing, but not substantially decreasing, either. Officially-reported cases dropped by only 1% this week compared to the week prior, while wastewater data shows that the coronavirus concentration in our sewage hasn’t changed significantly for the last month.

    Hospitalizations continue to decline for flu and RSV as well as COVID-19, according to the CDC’s data from emergency departments. But the COVID-19 decline has slowed, remaining consistent at a higher level than the flu and RSV declines. About 3,700 people were newly hospitalized for COVID-19 every day last week.

    At the regional level, COVID-19 spread is still declining (from a relatively higher winter peak) in the Northeast, and is solidly in a plateau in the South and West, per Biobot’s regional data. The Midwest reported a slight uptick this past week, continuing a trend that I noted in last weekend’s National Numbers.

    Some of the highest case, wastewater, and hospitalization increases reported right now are coming from the upper Midwest: Montana, North Dakota, South Dakota, and Idaho. COVID-19 spread is also trending up in Alabama, Kansas, New Hampshire, and West Virginia, along with other states in the Midwest and South, per the latest Community Profile Report.

    Omicron XBB.1.5, the latest and most contagious version of the virus, is spreading across these regions and may be contributing to increased cases. According to the CDC’s latest estimates, XBB.1.5 now accounts for more than half of new cases in every region of the country, and about 75% of new cases nationwide.

    No other variants are trending up right now; XBB.1.5 has solidly outcompeted the rest of the “variant soup” in the U.S. Experts will doubtless be watching for this subvariant to further evolve, while we also look out for any new variants from other parts of the world.

    Meanwhile, the daily average of new COVID-19 vaccinations in the U.S. has dropped under 100,000 for the first time since the country’s vaccination campaign started in winter 2020. New booster doses continue to be heavily underutilized.