
In the past week (April 6 through 12), the U.S. officially reported about 100,000 new COVID-19 cases, according to the CDC. This amounts to:
- An average of 15,000 new cases each day
- 17% fewer new cases than last week (March 30-April 5)
In the past week, the U.S. also reported about 13,000 new COVID-19 patients admitted to hospitals. This amounts to:
- An average of 1,900 new admissions each day
- 3.9 total admissions for every 100,000 Americans
- 14% fewer new admissions than last week
Additionally, the U.S. reported:
- 1,300 new COVID-19 deaths (190 per day)
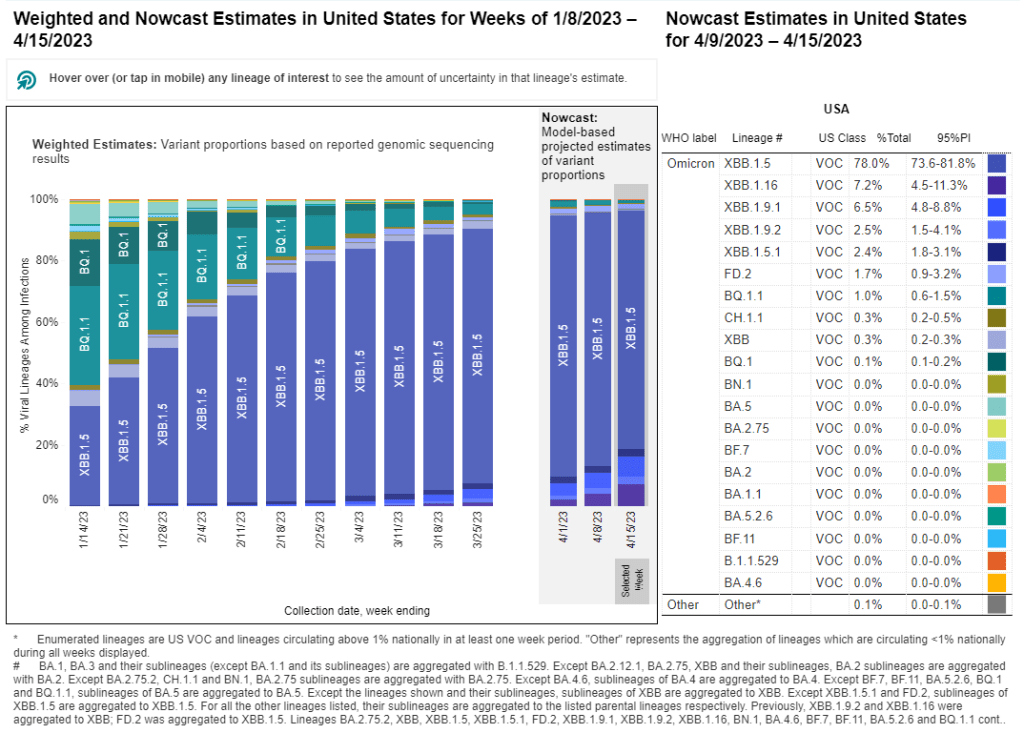
- 78% of new cases are caused by Omicron XBB.1.5; 9% by XBB.1.9; 7% by XBB.1.16 (as of April 15)
- An average of 35,000 vaccinations per day (CDC link)
COVID-19 spread appears to be at a continued plateau nationally, with slight declines in cases, hospitalizations, and viral concentrations in wastewater. New variants are on the horizon, though, at a time when data are becoming increasingly less reliable.
The CDC reported about 100,000 new cases this week, the lowest this number has been since early summer 2021. Unlike that period, however, PCR tests are much less available and reporting infrastructures are being dismantled.
Wastewater surveillance data from Biobot show that transmission is actually several times higher now than it was at that previous low point. We’re in an undercounted plateau, rather than a real lull. Even so, less COVID-19 is spreading now than we’ve seen throughout the last few months.
To get a more accurate picture of potential COVID-19 case counts in your area, I recommend going to the Iowa COVID-19 Tracker, an independent dashboard run by Sara Anne Willette. Willette has mapped out “likely cases per 100,000 people” by county, by multiplying the CDC’s data by 20 to account for underreporting.
Wastewater data suggest that most parts of the U.S. are seeing steady (though slight) declines in transmission, with the exception of the West coast. Some counties in California have reported increased coronavirus levels in wastewater in the last week, according to Biobot and WastewaterSCAN, including parts of the Bay Area.
One culprit for the increases could be newer Omicron subvariants, particularly XBB.1.9 and XBB.1.16. The CDC added XBB.1.16—which has drawn international concern, due to its connection with a recent surge in India—to its variant proportion estimates, along with XBB.1.9.2, a relative of XBB.1.9.1. (Yes, we’re getting into alphabet soup territory again here.)
Nationally, the CDC estimates that XBB.1.16 caused about 7% of new cases in the last week, while the XBB.1.9s together caused 9%. At the regional level, XBB.1.16 is more prevalent in the West and Southwest (at over 20% of new cases in the region including Texas and other Gulf coast states), while the XBB.1.9s are more prevalent in the Midwest.
The CDC published its second-to-last data update yesterday (which is still called the “Weekly Review,” even though it is far from weekly at this point). According to this update, most of the CDC’s public COVID-19 data “won’t be affected by the end of the public health emergency,” though the agency says it’ll provide more details in its final update on May 12.
I personally expect that, while the national data systems might remain in place, more state and local health agencies will stop reporting, as we saw from Iowa recently. This will, of course, make the numbers less and less reliable.

Leave a comment