During the most recent week of data available (August 13-19), the U.S. reported about 15,100 new COVID-19 patients admitted to hospitals, according to the CDC. This amounts to:
An average of 2,200 new admissions each day
4.6 total admissions for every 100,000 Americans
19% more new admissions than the prior week (August 6-12)
Additionally, the U.S. reported:
14.9% of tests in the CDC’s surveillance network came back positive
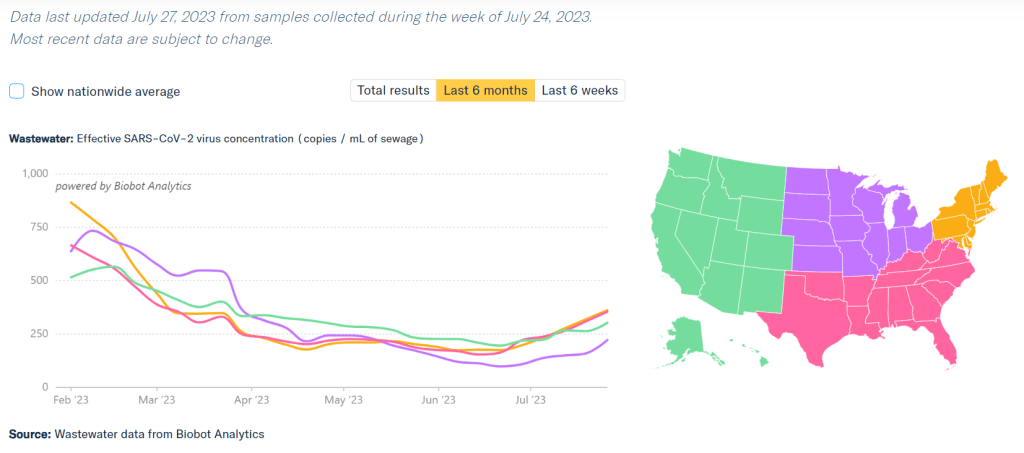
A 3% higher concentration of SARS-CoV-2 in wastewater than last week (as of August 30, per Biobot’s dashboard)
23% of new cases are caused by Omicron XBB.1.6; 22% by EG.5; 15% by FL.1.5.1 (as of September 2)
The late-summer COVID-19 surge is still in full swing, with all major metrics showing further increases in disease spread this week. BA.2.86 isn’t spreading widely yet but is worth continued surveillance.
Last week, I wrote that wastewater data from Biobot Analytics showed a potential plateau—but cautioned those data were tentative. Unfortunately, further updates this week suggest that COVID-19 transmission is still increasing, albeit not as dramatically as it was in July.
Data from WastewaterSCAN show a similar pattern: a sharp increase in COVID-19 spread from late June through July, followed by a slight leveling off, and then followed by further increase. This could be caused by a newer variant entering the picture, driven by behaviors, or (most likely) some combination of the two.
Regional data from both Biobot and WastewaterSCAN indicate that COVID-19 transmission might be approaching plateaus in the South and Midwest, but is going up sharply in the Northeast and West coast. The Midwest, after showing decreases in Biobot’s data over recent weeks, is now trending up again.
The CDC’s test positivity and hospitalization numbers continue to rise as well. New hospital admissions for COVID-19 reached 2,000 per day during the week ending August 19, and are likely still higher now. Test positivity is up to 15%, the highest this metric has been since last winter’s holiday surge.
In the CDC’s latest variant estimates (posted on Saturday), EG.5 and XBB.1.6 continue to dominate in a crowded landscape of Omicron XBB relatives. The agency hasn’t yet found enough BA.2.86 for this new variant to be included in the update. However, this could indicate low testing rather than an actual low prevalence of BA.2.86.
The CDC often takes COVID-19 reporting breaks over holiday weekends, and this one is no exception: the agency will not update its dashboard on Monday, according to a note posted at the top of the page. Hospitalizations, test positivity, and other metrics will be updated later in the week.
Of course, the coronavirus doesn’t care about holidays—in fact, it usually spreads more widely when people travel and gather. Fully understanding this Labor Day weekend’s impact could take several weeks, at our current pace of data reporting.
COVID-19 is spreading more in all regions of the country, according to Biobot’s data. Data as of July 27, based on samples collected the week of July 24.
During the most recent week of data available (July 9 through 15), the U.S. reported about 7,100 new COVID-19 patients admitted to hospitals, according to the CDC. This amounts to:
An average of 1,000 new admissions each day
2.2 total admissions for every 100,000 Americans
10% more new admissions than the prior week (July 2-8)
Additionally, the U.S. reported:
7.6% of tests in the CDC’s surveillance network came back positive
A 17% higher concentration of SARS-CoV-2 in wastewater than last week (as of July 26, per Biobot’s dashboard)
24% of new cases are caused by Omicron XBB.1.6; 19% by XBB.1.9; 13% by XBB.2.3 (as of July 22)
Several major metrics continue to point to a summer increase in COVID-19 spread. Coronavirus levels in wastewater are up in all major regions, as is test positivity from the CDC’s network. Hospitalizations have started ticking up as well.
Nationally, coronavirus levels in wastewater have doubled in the last month, according to Biobot Analytics. Viral levels are on par with this period in summer 2021, at the start of that year’s Delta surge, and are the highest they’ve been since this year’s holiday surge concluded.
Data from the WastewaterSCAN network similarly shows COVID-19 upticks in the last month, though the team’s latest national update notes that current levels are still low compared to the start of 2023. WastewaterSCAN recently added national wastewater levels to its dashboard, making it easier to track broad trends from this sewage testing network.
Test positivity data from the CDC’s respiratory lab network are still increasing as well. National test positivity was 7.6% in the week ending July 22, compared to 4.5% about a month ago, an increase of about 70%.
The CDC’s hospitalization data are also showing an increase now: new COVID-19 patients admitted to hospitals went up by about 10% from the week ending July 8 to the week ending July 15. These are the most recent hospitalization numbers available, as the CDC is still reporting this metric with a delay.
Wastewater and positivity data suggest that COVID-19 spread is increasing in all major regions of the country. All regions are also dealing with the virus’ continued evolution, as a variety of XBB lineages circulate and compete with each other.
Several national publications reported on these COVID-19 increases in the last week, pointing to the potential for a summer surge. I personally liked this article from Dylan Scott at Vox, which also covers implications for COVID-19 this winter.
But the COVID-19 Data Dispatch was on this potential surge weeks before any mainstream media news site. If you appreciate our early warnings, please donate to support this work!
I wanted to highlight a couple of questions (and comments) that I’ve received recently from readers, hoping that they will be useful for others.
Interpreting wastewater surveillance data
One reader asked about how to interpret wastewater surveillance data, specifically looking at a California county on the WastewaterSCAN dashboard. She noticed that the dashboard includes both line charts (showing coronavirus trends over time) and heat maps (showing coronavirus levels), and asked: “I’m wondering what the difference is, and which is most relevant to following actual infection rates and trends?”
My response: Wastewater data can be messy because environmental factors can interfere with the results, and what may appear to be a trend may quickly change or reverse course (this FiveThirtyEight article I wrote last spring on the topic continues to be relevant). So a lot of dashboards use some kind of “risk level” metric in addition to showing linear trends in order to give users something a bit easier to interpret. See the “virus levels” categories on the CDC dashboard, for instance.
Personally, I like to look at trends over time to see if there might be an uptick in a particular location that I should worry about, but I find the risk level metrics to be more useful for actually following infection rates. Of course, every dashboard has its own process for calculating these levels—and we don’t yet have a good understanding of how wastewater data actually correlate to true community infections—so it’s helpful to also check out other metrics, like hospitalizations in your county.
Rapid test accuracy
Another reader asked: “Is there any data on the effectiveness of rapid tests for current variants like Arcturus? I’m hearing more and more that they are working less and less well as COVID evolves.”
My response: Unfortunately, I’m not aware of any specific data on rapid test effectiveness for recent variants. Early in the Omicron period, there were a few studies that showed the rapid tests still worked for that variant. The virus has obviously evolved a lot since then, but there is less interest in and fewer resources for evaluating these questions at this point in the pandemic, so it’s hard to say whether the continued mutations have had a significant impact on test effectiveness.
I think it’s important to flag, though, that rapid tests have never been highly accurate. People have tested negative on rapids—only to get a positive PCR the next day—since these tests were first introduced in spring 2021. The tests can be helpful for identifying if someone is contagious, with a high viral load, but are less accurate for people without symptoms. So, my recommendation with these tests is always to test multiple times, and to get a PCR if you have access to that. (Acknowledging there is less and less PCR access these days.) Also, if you were recently exposed to COVID-19, wait a few days to start rapid testing; see more details in this post from last year.
Double dose of Paxlovid
Another reader wrote in to share their experience with accessing Paxlovid during a recent COVID-19 case. The reader received a Paxlovid prescription, which led to a serious alleviation of symptoms. But when she experienced a rebound of symptoms after finishing the Paxlovid course, she had a hard time getting a second prescription.
“Fauci, Biden, head of Pfizer and CDC director got a second course of Paxlovid prescribed to them,” the reader wrote. “When I attempted to get this, my doctors pretended I was crazy and said this was never done.” She added that she’d like to publicize the two-course Paxlovid option.
My response: I appreciate this reader sharing her experience, and I hope others can consider getting multiple Paxlovid prescriptions for a COVID-19 case. The FDA just provided full approval to Pfizer for the drug, which should alleviate some bureaucratic hurdles to access. I also know that current clinical trials testing Paxlovid as a potential Long COVID treatment are using a longer course; 15 days rather than five days. The results of those trials may provide some evidence to support a longer course overall.
If you have a COVID-19 question, please send me an email and I’ll respond in a future issue!
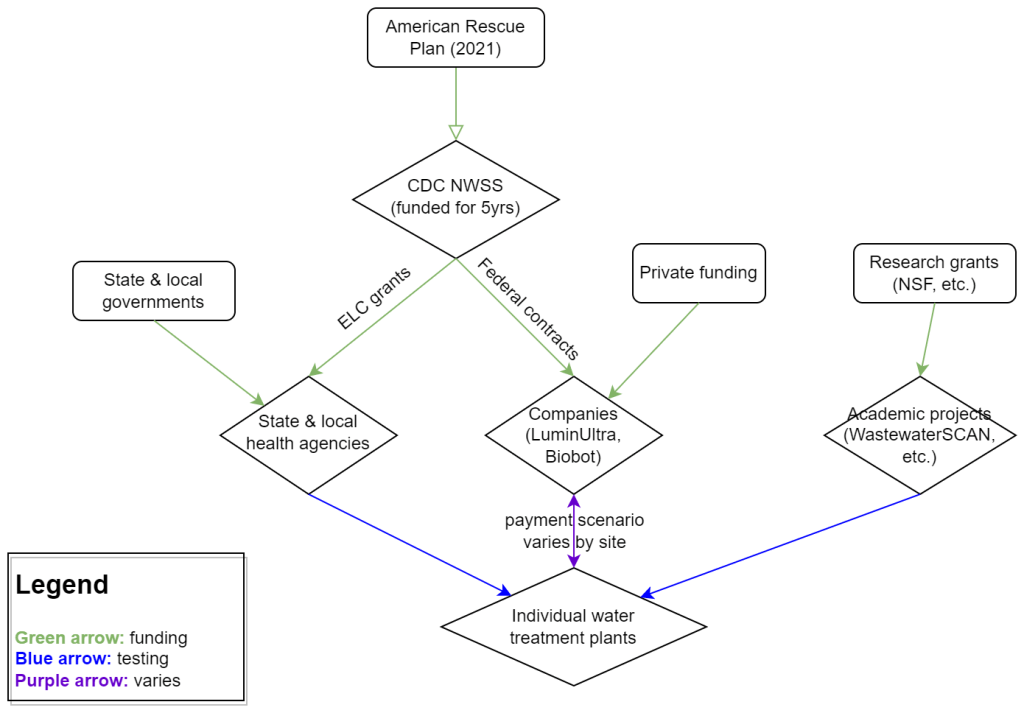
My attempt to explain the wastewater surveillance funding ecosystem in one diagram. (Credit: Betsy Ladyzhets)
This week, I have a new story out in Scientific American about why the wastewater surveillance infrastructure built during the pandemic may not last in the long term. While current monitoring projects aren’t likely to go anywhere right now, issues with funding, uneven commitments at state and local levels, and the overall novelty of this field may lead those programs to shut down in the coming years.
Here’s the story’s opening paragraphs:
During the past three years of the pandemic, testing sewage water for the virus that causes COVID has become a valuable tool: it has spotted surging infections and new variants weeks before they showed up in medical clinics, for instance. The technology has also warned of other health threats such as seasonal viruses and increased opioid use.
But now its long-term ability to protect public health is in jeopardy. Funding uncertainty from the federal government and uneven commitments from state health departments have raised the specter that wastewater monitoring programs may shut down in the future.
The U.S. Centers for Disease Control and Prevention’s National Wastewater Surveillance System (NWSS), which includes the majority of wastewater testing sites in the U.S., is “fully funded through 2025,” says Amy Kirby, director of the program. But after that, “new sources of sustainable funding” are needed, Kirby says, ideally through the CDC’s regular budget rather than resources tied to COVID. Uncertainty about money—along with logistical challenges and questions about how to interpret data from this relatively novel source—has made some state governments hesitant to invest in the technology, leading to an uneven national system.
My reporting for this piece involved interviews with the CDC, state and local public health agencies, and other major wastewater organizations (Biobot, WastewaterSCAN). I learned a lot about the overall ecosystem for funding wastewater surveillance, including a lot of somewhat-technical details that didn’t make it into the SciAm story. So, I’m sharing some of those details here.
Where wastewater surveillance funding comes from:
The primary funder for wastewater monitoring programs across the U.S. is CDC NWSS. The CDC itself received funding through the American Rescue Plan in 2021, sufficient to fully fund NWSS through 2025.
That CDC funding has gone in two main directions. First, the CDC has funded state and local public health agencies to set up (and maintain) their own wastewater testing projects. This is how most of the states with robust programs (places like New York, Utah, Virginia, Ohio) have funded their efforts. State and local health agencies may also receive funding from their own local governments, though most of the agencies I talked to for my story said they were primarily relying on the CDC. New York State is one major example of a state government funding wastewater surveillance right now.
And second, the CDC has set up national contracts with wastewater testing companies to supplement NWSS in places where monitoring otherwise might not be happening. The agency first contracted with LuminUltra in early 2022, then switched to Biobot Analytics last spring. Earlier this year, Biobot’s contract with the CDC was extended for six months, through July. After that, the agency plans to enter a new, five-year contract with a wastewater testing company that will cover COVID-19 as well as other emerging diseases, like mpox. This contract could go to Biobot or another company; the CDC is currently going through an application process.
Biobot and other private companies like it are also receiving funding from private sources, such as venture capital firms. In addition, individual water treatment facilities, local governments, and even businesses might set up contracts with private companies to help them test the wastewater in their jurisdiction. For example, Toronto’s Pearson Airport has contracted with LuminUltra to test wastewater from the airport terminals. In these cases, funding is coming from the specific organization that wants testing, rather than a larger program. Biobot also tests at hundreds of sites for free through its Biobot Network, in exchange for sharing the data publicly.
Finally, there’s a whole separate ecosystem of academic wastewater surveillance efforts, mostly run by university labs or research centers. WastewaterSCAN is the biggest example of this right now; the project was founded at Stanford and Emory Universities, but has since expanded through grants and philanthropic funding to cover about 150 sites across the country. Most academic projects either partner with specific treatment facilities in their areas or test the sewage on their campuses—SCAN is an exception with its broader scale.
Concerns for wastewater surveillance’s long-term future:
As you can probably tell by this description of the funding landscape, wastewater surveillance in the U.S. is pretty complicated. When scientists started testing wastewater for SARS-CoV-2 in spring 2020, this was basically a grassroots effort with different research projects across the country trying out different things. CDC NWSS has worked hard to compile data into one national system and develop standards, but the system is still far from unified.
For the CDC program to continue its efforts, the agency needs more long-term funding—and this funding shouldn’t be tied to COVID-19. The potential for wastewater surveillance to inform public health decisions goes far beyond this pandemic, and funding should reflect that potential; also, no COVID-specific funding packages have passed Congress since the American Rescue Plan, in 2021.
One way Congress could do this would be by expanding a funding system called “Epidemiology and Laboratory Capacity for Prevention and Control of Emerging Infectious Diseases,” or ELC. Most wastewater grants to state and local health agencies over the last couple of years have gone through ELC, though the funding came from the American Rescue Plan. Many of the health officials I talked to for my story like ELC, know how to fill out the annual applications, and would want to keep using it to receive wastewater funding.
Before the pandemic, the ELC program was drastically underfunded, I learned from experts at the Association of Public Health Laboratories (APHL). States’ applications historically “vastly exceed the money that CDC is given to put out for them,” APHL policy officer Peter Kyriacopoulos told me. APHL recommends that Congress should expand the program’s funding from $300 million per year (its pre-pandemic benchmark) to $800 million per year, or more. The ELC program is up for renewal this year, which could be an opportunity for Congress to add more permanent funding for wastewater surveillance and other epidemiological efforts.
More permanent funding could go a long way in convincing more state health agencies to invest in wastewater surveillance programs, rather than relying on outside assistance from companies like Biobot or academic partners. More data and guidance on how to actually use wastewater data to inform public health decisions would help, too, since many agencies are still figuring this out. Such investment at the state level would help make the country’s wastewater infrastructure more comprehensive, and more capable of responding to new health threats.
Instead, right now, we have an uneven system. Some places are regularly monitoring for COVID-19 and easily able to expand to new testing targets, while others might lose this valuable data source in the next year or two. For any local reporters reading this, I highly recommend digging into your community’s wastewater surveillance system, and figuring out whether it’s set up for the long term.
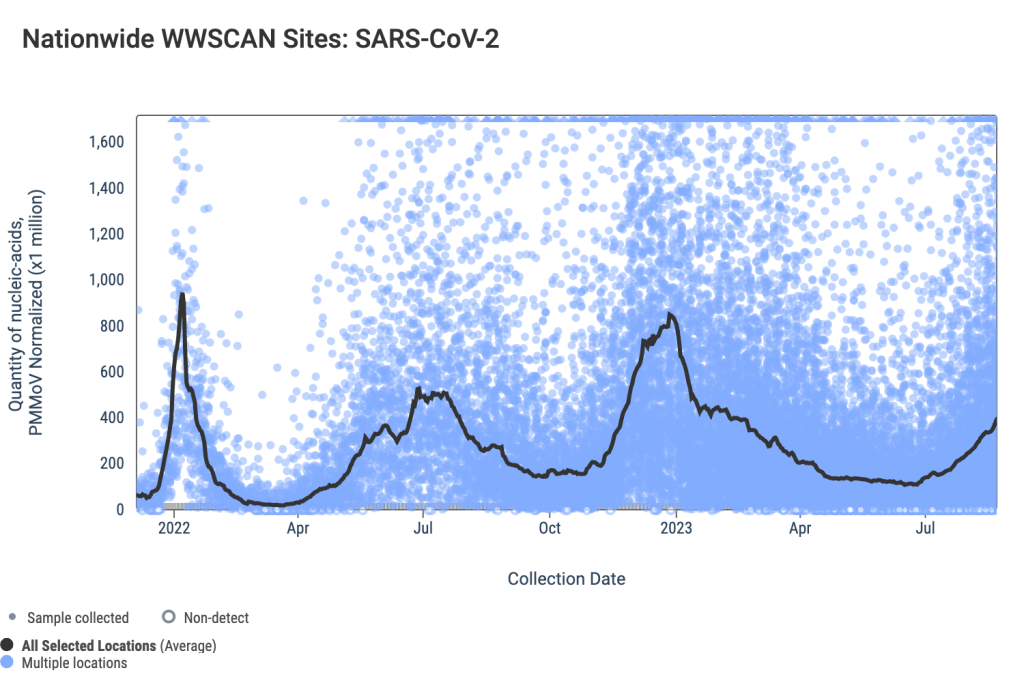
A few weeks ago, I learned that the WastewaterSCAN project has a newsletter, which shares updates about COVID-19 and other diseases nationally and for the Bay Area in California. It’s a helpful resource for following infectious disease trends.
WastewaterSCAN, for any readers who might be unfamiliar, is a wastewater surveillance project founded by researchers at Stanford and Emory Universities. The project started in 2020 by monitoring wastewater in the Bay Area for SARS-CoV-2, but has since expanded to about 150 sites nationwide and six testing targets: the coronavirus, flu, RSV, mpox, norovirus, and human metapneumovirus (HMPV).
In the newsletter, the SCAN team shares summary data about all of these diseases, as well as some variant analysis for SARS-CoV-2. The language is sometimes a bit technical (as its primary audience is the team’s academic and public health partners), but still very useful for seeing where diseases are rising or falling. SCAN’s local updates are especially helpful for anyone living in the Bay Area.
Also, the SCAN team recently had a paper published in the Lancetdiscussing their work monitoring wastewater for diseases beyond COVID-19. The new article shows this technology’s potential for broader public health surveillance.
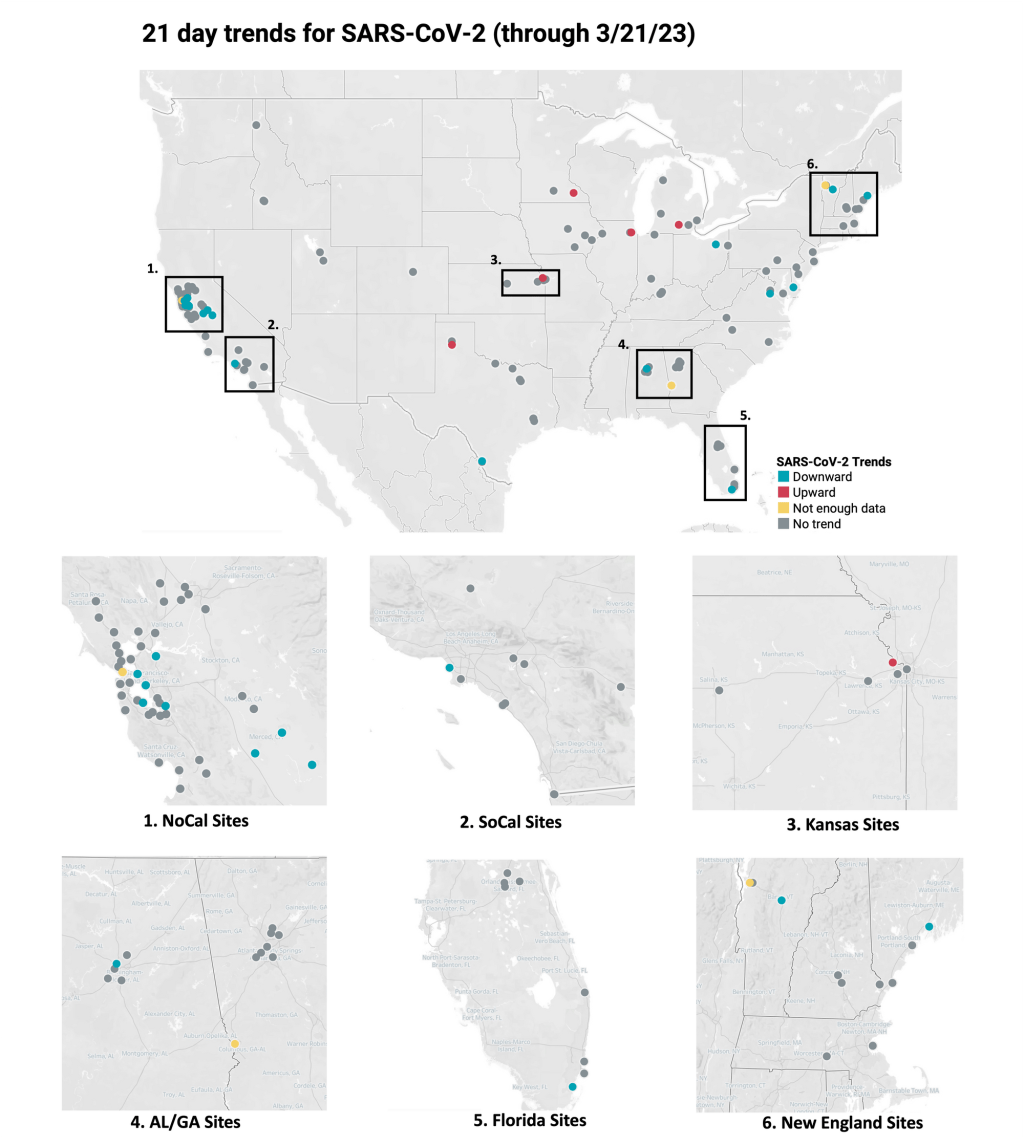
Data from WastewaterSCAN suggest that most sites in its network saw downward coronavirus trends or plateaus in recent weeks.
In the past week (March 16 through 22), the U.S. officially reported about 130,000 new COVID-19 cases, according to the CDC. This amounts to:
An average of 19,000 new cases each day
41 total new cases for every 100,000 Americans
13% fewer new cases than last week (March 9-15)
In the past week, the U.S. also reported about 17,000 new COVID-19 patients admitted to hospitals. This amounts to:
An average of 2,400 new admissions each day
5.2 total admissions for every 100,000 Americans
9% fewer new admissions than last week
Additionally, the U.S. reported:
2,000 new COVID-19 deaths (300 per day)
90% of new cases are caused by Omicron XBB.1.5; 3% by XBB.1.9.1; 2% by XBB.1.5.1; 0.4% by CH.1.1 (as of March 18)
An average of 40,000 vaccinations per day
Nationally, we continue to see the same slow decline of COVID-19 spread across the U.S., as shown by official case data, hospitalizations, and wastewater surveillance.
Reported cases dropped by 13% last week compared to the week prior, while new hospital admissions dropped by 9%. As I’ve noted in the last couple of updates, the CDC continues to deal with reporting delays from different state health departments. This week, Texas, Arkansas, Florida, and Indiana did not report cases to the CDC.
Wastewater surveillance data from Biobot and the WastewaterSCAN project suggest that COVID-19 levels are at slow declines or plateaus in most parts of the country, but some places may be seeing small increases. Biobot’s dashboard shows slight upticks in the Northeast, Midwest, and West coast regions, as of its March 22 update.
Overall, Biobot’s data suggests that national coronavirus concentrations are lower than they’ve been in about a year—but still higher than we’ve seen at this point in 2021 and 2022. The low case numbers that health departments are putting out mask a high baseline of infections, in which many people are not getting PCR tests or reporting their cases to the healthcare system.
Our US #SARSCoV2#wastewater concentration is now at its lowest point in almost a year, but remains above levels seen in previous years at this time. As we enter Spring, we will be monitoring for any indication of a potential springtime wave. https://t.co/GBL4twvGGTpic.twitter.com/qempsPrS5P
Data from the WastewaterSCAN project suggest that most of the project’s 148 monitoring sites reported downward trends or plateaus in coronavirus levels over the last three weeks. A few places have reported upticks, though, including sites in Kansas, Michigan, South Carolina, Massachusetts, and Oklahoma.
One reason for these upticks could be XBB.1.9.1, the latest Omicron subvariant to draw concern among virologists. The CDC started reporting estimates for XBB.1.9.1 in its latest variant update (this Friday): the agency estimates that this variant caused 2.5% of new cases nationwide last week, with higher prevalence (about 13%) in the Midwest region that includes Iowa, Kansas, Missouri, and Nebraska.
XBB.1.9.1 is doubling “roughly every 8 days,” according to Marc Johnson, a virologist at the University of Missouri who leads the state’s wastewater surveillance program. Johnson predicts that this subvariant will be dominant in the U.S. by the end of April, but it could face competition from XBB.1.16—another descendant of XBB that has been spreading rapidly in India.
What's next for COVID?
I projected a few weeks ago that XBB.1.9* would be the next dominant lineage in the US.
This lineage was a little over 4% of US sequences over the last 2 weeks, and the numbers are doubling roughly every 8 days.
Could the spread of these XBB sublineages across the U.S. cause a significant rise in cases and hospitalizations? It’s hard to say, given the complex picture of immunity in the country, with millions of people recently infected by a variety of variants. “Future waves are getting harder and harder to forecast,” Katelyn Jetelina wrote in Your Local Epidemiologist this week. Regardless, the same safety measures (masks, testing, etc.) continue to work against all new versions of the virus.
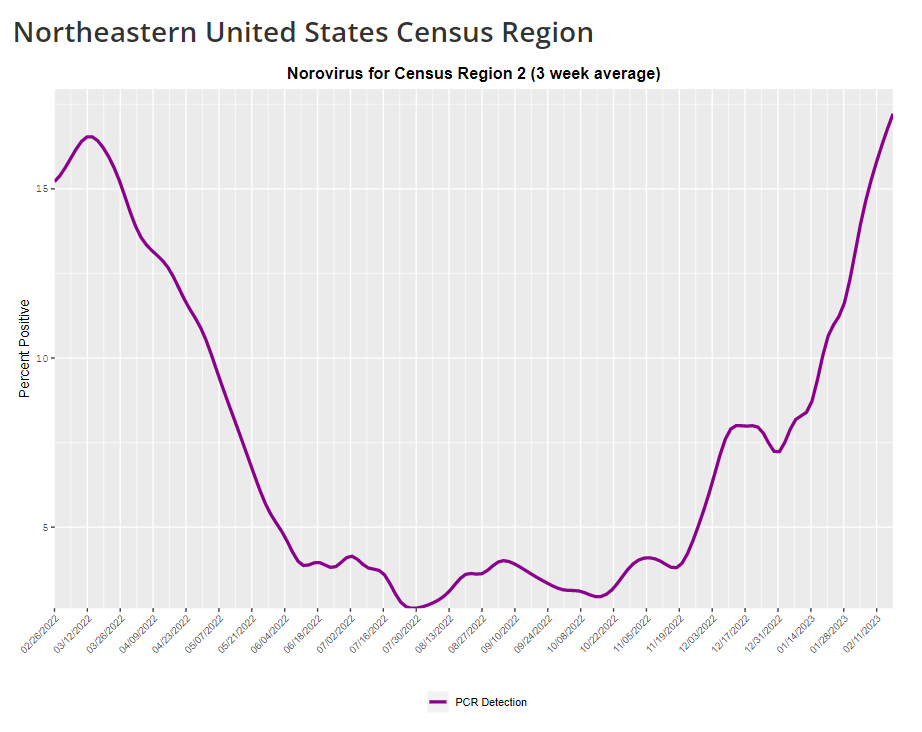
The CDC provides norovirus test positivity data from a select number of labs that report test results for this virus. Due to limited reporting, data are only available at the regional level.
This week, I have a new story out in Gothamist and WNYC (New York City’s public radio station) about norovirus, a nasty stomach bug that appears to be spreading a lot in the U.S. right now. The story shares some NYC-specific norovirus information, but it also talks more broadly about why it’s difficult to find precise data on this virus despite its major implications for public health.
Reporting this story led me to reflect on how COVID-19 has revealed cracks in the country’s infrastructure for tracking a lot of common pathogens. I’ve written previously about how the U.S. public health system monitored COVID-19 more comprehensively than any other disease in history; the scale of testing, contact tracing, and innovation into new surveillance technologies went far beyond the previous standards. Now, people who’ve gotten used to detailed data on COVID-19 have been surprised to find out that such data aren’t available for other common pathogens, like the flu or norovirus.
It might feel disappointing to realize how little we actually know about the impacts of endemic diseases. But I choose to see this as an opportunity: as COVID-19 revealed gaps in public health surveillance, it inspired development in potential avenues to close those gaps. Wastewater surveillance is one big example, along with the rise of at-home tests and self-reporting mechanisms, better connectivity between health systems, mobility data, exposure notifications, and more.
Norovirus is a good example of this trend. Here are a few main findings from my story:
People who become infected with norovirus are often hesitant to seek medical care, because the symptoms are disgusting and embarrassing. Think projectile vomit, paired with intense diarrhea.
Even when patients do seek medical care, norovirus tests are not widely available, and there isn’t a ton of incentive for doctors to ask for them. Testing usually requires a stool sample, which patients are often hesitant to do, one expert told me.
The virus is not a “reportable illness” for the CDC, meaning that health agencies and individual doctors aren’t required to report norovirus cases to a national monitoring system. (So even when a patient tests positive for norovirus, that result might not actually go to a health agency.)
The CDC does require health agencies and providers to report norovirus outbreaks (i.e. two or more cases from the same source), but national outbreak estimates are considered to be a vast undercount of true numbers.
Even in NYC, where the city’s health agency does require reporting of norovirus cases, there’s no recent public data from test results or outbreaks. (The latest data is from 2020.)
It seems like the lack of a requirement and the difficulty of tracking kind-of play into each other, where it’s not required because it’s hard to track—but it’s also hard to track because it’s not required.
The lack of detailed data on pathogens like norovirus can be frustrating on an individual level, for health-conscious people who might want to know what’s spreading in their community so that they can take appropriate precautions. (For norovirus, precautions primarily include rigorous handwashing—hand sanitizer doesn’t work against it—along with cleaning surfaces and care around food.)
These data gaps can also be a challenge for public officials, as more detailed information about where exactly a virus is spreading or who’s getting sick could inform specific public health responses. For example, if the NYC health department knew which neighborhoods were seeing the most norovirus, they could direct handwashing PSAs to those areas. In addition, scientists who are developing norovirus vaccines could use better data to estimate the value of those products, and determine who would most benefit.
So, how do we improve surveillance for norovirus and other viruses like it? Here are a few options I found in my reporting:
Wastewater surveillance, of course. The WastewaterSCAN project is already tracking norovirus along with coronavirus and several other common viruses; its data from this winter has aligned with other sources showing a national norovirus surge, one of the project’s principal investigators told me.
Better surveillance based on people’s symptoms. The Kinsa HealthWeather project offers one example; it aggregates anonymous information from smart thermometers and a symptom-tracking app to provide detailed data on respiratory illnesses and stomach bugs.
At-home tests, if they’re paired with a mechanism for people to report their results to a local public health agency. Even without a reporting mechanism, at-home tests could help curb outbreaks by helping people recognize their illness when they might be asymptomatic.
Simply increasing awareness and access to the tests that we already have. If more people go to the doctor for gastrointestinal symptoms and more doctors test for norovirus, our existing data would get more comprehensive.
Are there other options I’ve missed? Is there another pathogen that might be a good example of common surveillance issues? Reach out and let me know.
Washington’s dashboard includes coronavirus concentration levels over time from a selection of wastewater treatment plants in the state, with data going back to early 2022. It also includes some helpful notes about how to interpret wastewater data and maps showing the service areas for each treatment plant.
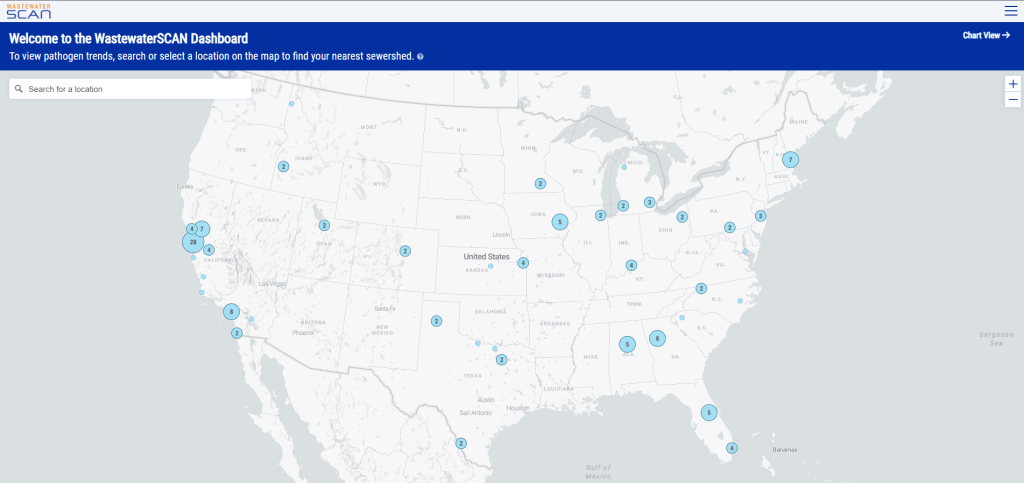
I also recently learned that WastewaterSCAN has released a new, upgraded dashboard to share its surveillance data. WastewaterSCAN is a project started by researchers at Stanford and Emory universities (with a focus on sites in California) that has since expanded across the country. The new dashboard makes it easier for users to find SCAN testing sites in their areas and answer specific questions with the data.
As official case numbers become less and less reliable, I’m glad to see public agencies and research efforts step up to make wastewater surveillance more accessible. Both the Washington dashboard and new WastewaterSCAN link are now included on my wastewater data resource page.
It’s the fourth year of the pandemic. I’ve written this statement in a few pitches and planning documents recently, and was struck by how it feels simultaneously unbelievable—wasn’t March 2020, like, yesterday?—and not believable enough—haven’t we been doing this pandemic thing for an eternity already?
As someone who’s been reporting on COVID-19 since the beginning, a new year is a good opportunity to parse out that feels-like-eternity. So this week, I reflected on the major trends and topics I hope to cover in 2023—both building on my work from prior years and taking it in new directions.
(Note: I actually planned to do this post last week, but then XBB.1.5 took higher priority. Hence its arrival two weeks into the new year.)
Expansions of wastewater, and other new forms of disease surveillance
As 2022 brought on the decline of large-scale PCR testing, wastewater surveillance has proven itself as a way to more accurately track COVID-19 at the population level—even as some health departments remain wary of its utility. We also saw the technology’s use for tracking monkeypox, polio, and other conditions: the WastewaterSCAN project, for example, now reports on six different diseases.
This year, I expect that wastewater researchers and public agencies will continue expanding their use of this surveillance technology. That will likely mean more diseases as well as more specific testing locations, in addition to entire sewersheds. For example, we’re already seeing wastewater testing on airplanes. I’m also interested in following other, newer methods for tracking diseases, such as air quality monitors and wearable devices.
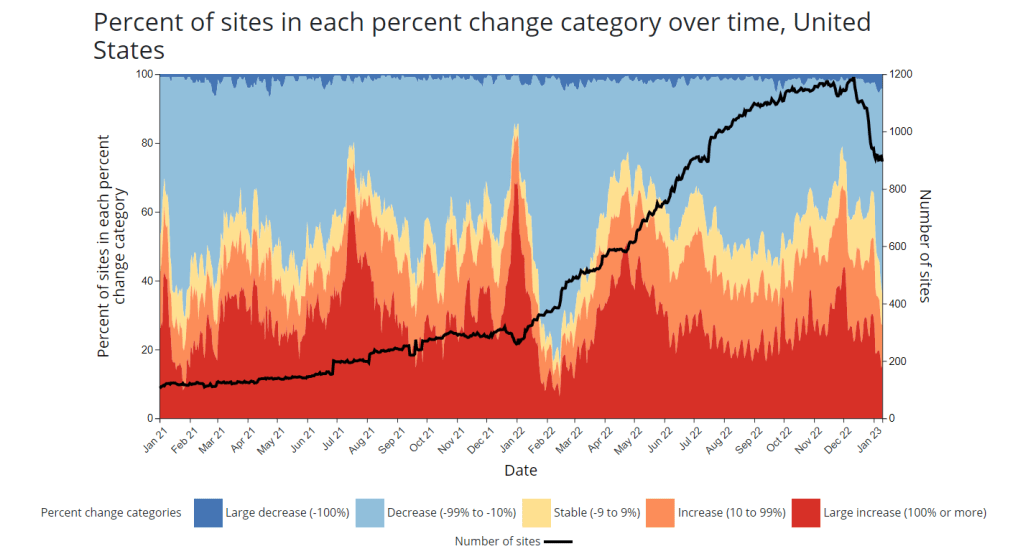
At the same time, these surveillance technologies will continue to face challenges around standardization and public buy-in. The CDC’s big contract with Biobot expires this month, and I’ve already noticed a decline in sites with recent data on the agency’s dashboard—will CDC officials and local agencies step in to fill gaps, or will wastewater testing become even more sporadic?
New variants, and how we track them
For scientists who track the coronavirus’ continued evolution, 2022 was the year of Omicron. We didn’t see all-new virus lineages sweeping the world; instead, Omicron just kept mutating, and mutating, and mutating. It seems likely that this pattern will continue in 2023, but experts need to continue watching the mutation landscape and preparing for anything truly concerning.
With declining PCR testing, public agencies and companies that track variants have fewer samples to sequence. (This led to challenges for the CDC team tracking XBB.1.5 over the holidays.) As a result, I believe 2023 will see increased creativity in how we keep an eye on these variants—whether that’s sequencing wastewater samples, taking samples directly from healthcare settings, increased focus on travel surveillance, or other methods.
Public health experts—and journalists like myself—also need to rethink how we communicate about variants. It’s no longer true that every new, somewhat-more-contagious variant warrants alarm bells: variants can take off in some countries or regions while having relatively little impact in others, thanks to differences in prior immunity, seasonality, behavior, etc. But new variants still contribute to continued reinfections, severe symptoms, Long COVID, and other impacts of COVID-19. Grid’s Jonathan Lambert recently wrote a helpful article exploring these communication challenges.
Long COVID and related chronic diseases
As regular readers likely know, Long COVID has been an increased topic of interest for me over the last two years. I’ve covered everything from disability benefits to mental health challenges, and am now leading a major project at MuckRock that will focus on government accountability for the Long COVID crisis.
Long COVID is the epidemic following the pandemic. Millions of Americans are disabled by this condition, whether they’ve been pushed out of work or are managing milder lingering symptoms. Some people are approaching their three-year anniversary of first getting sick, yet they’ve received a fraction of the government response that acute COVID-19 got. Major research projects are going in the wrong directions, while major media publications often publish articles with incorrect science.
For me, seeing poor Long COVID coverage elsewhere is great motivation to continue reporting on this topic myself, at MuckRock and other outlets. I’m also planning to spend more time reading about (and hopefully covering) other chronic diseases that are co-diagnosed with Long COVID, like ME/CFS and dysautonomia.
Ending the federal public health emergency.
Last year, we saw many state and local health agencies transition from treating COVID-19 as a health emergency to treating it as an endemic disease, like the many others that they respond to on a routine basis. This transition often accompanied changes in data reporting, such as shifts from daily to weekly COVID-19 updates.
This year, the federal government will likely do the same thing. POLITICO reported this week that the Biden administration is renewing the federal public health emergency in January, but will likely allow it to expire in the spring or summer. The Department of Health and Human Services has committed to telling state leaders about this expiration 60 days before it happens.
I previously wrote about what the end of the federal emergency could mean for COVID-19 data: changes will include less authority for the CDC, less funding for state and local health departments, and vaccines and treatments controlled by private markets rather than the federal government. I anticipate following up on this reporting when the emergency actually ends.
Transforming the U.S. public health system
Finally, I intend to follow how public health agencies learn from—or fail to learn from—the pandemic. COVID-19 exposed so many cracks in America’s public health system, from out-of-date electronic records systems to communication and trust issues. The pandemic should be a wakeup call for agencies to get their act together, before a new crisis hits.
But will that actually happen? Rachel Cohrs has a great piece in STAT this week about the challenges that systemic public health reform faces, including a lack of funding from Congress and disagreements among experts on what changes are necessary. Still, the window for change is open right now, and it may not be at this point in 2024.
As we head into the holidays with limited COVID-19 testing and undercounted case numbers, wastewater surveillance is the best way to evaluate how much the virus is spreading in your region. And it’s now available in more places than ever, thanks to the many research groups and public health agencies setting up sewage testing.
Let’s review the options. First, there are now three national dashboards with U.S. wastewater data, each covering a different set of locations.
The CDC’s National Wastewater Surveillance System is the biggest, including more than 1,000 sites from almost every state, though some states have far better coverage than others. Click on an individual site to see coronavirus trends for that location.
Biobot Analytics is the biggest private company doing wastewater surveillance; it provides analysis for hundreds of sites in the CDC NWSS network as well as its own, separate network. Biobot’s national and regional data (which include NWSS sites) are particularly helpful for large-scale trends.
WastewaterSCAN is a project that started from an academic partnership between Stanford University, Emory University, the University of Michigan, and communities in California. It’s since expanded to include sites in about 20 states, and participating sewersheds are tested for monkeypox, flu, and RSV in addition to the coronavirus.
Second, 21 states currently have their own wastewater dashboards or reporting systems. If this is available in your area, I highly recommend looking at your local dashboard in addition to the national options. State and local dashboards tend to include more detailed and/or more frequently updated data, and are often tailored to their community’s needs more closely.
These are the states with wastewater dashboards; see the resource page for links and more info:
California, Colorado, Georgia, Hawaii, Idaho, Indiana, Maine, Maryland, Massachusetts, Michigan, Minnesota, Missouri, Nebraska, New York State, North Carolina, Ohio, Oklahoma, Oregon, Utah, West Virginia, Wisconsin.
Wastewater trends do not correspond directly to infection trends, because people sick with COVID-19 might shed the virus at different rates (based on where they are in their infection, variants, and other factors). Some researchers are working to better understand the correlation between wastewater trends and cases, but for now, the sewage data are best understood as a broad indicator of risk—not a precise estimate of how many people in your community are sick.