Tag: school data

  • School data update, Sept. 20

    • The CDC was busy last week. In addition to their vaccination playbook, the agency released indicators for COVID-19 in schools intended to help school administrators make decisions about the safety of in-person learning. The indicators provide a five-tier system, from “lowest risk of transmission” (under 5 cases per 100,000 people, under 3% test positivity) to “highest risk” (over 200 cases per 100,000 people, over 10% test positivity). It is unclear what utility these guidelines will have for the many school districts that have already started their fall semesters, but, uh, maybe New York City can use them?
    • Speaking of New York: the state’s dashboard on COVID-19 in schools that I described in last week’s issue is now live. Users can search for a specific school district, then view case and test numbers for that district’s students and staff. At least, they should be able to; many districts, including New York City, are not yet reporting data. (The NYC district page reports zeros for all values as of my sending this issue.)
    • Los Angeles Unified, the nation’s second-largest school district, is building its own dashboard, the Los Angeles Times reported last week. The district plans to open for in-person instruction in November or later, at which point all students and staff will be tested for COVID-19. Test results down to the classroom level will be available on a public dashboard.
    • Wisconsin journalists have stepped in to monitor COVID-19 outbreaks in schools, as the state has so far failed to report these data. A public dashboard available via the Milwaukee Journal Sentinel and the USA Today Network allows users to see case counts and resulting quarantine and cleaning actions at K-12 schools across the state. Wisconsin residents can submit additional cases through a Google form.
    • According to the COVID Monitor, states that report K-12 COVID-19 case counts now include: ArkansasHawaiiKentuckyLouisianaMississippiNew HampshireOhioSouth CarolinaSouth DakotaTennesseeTexas, and Utah. Some of these state reports are far more precise than others; Texas and Utah, for example, both report only total case counts. The COVID Monitor reports over 10,000 COVID-19 confirmed cases in K-12 schools as of September 20, with another 17,000 reported cases pending.
    • recent article in the Chronicle of Higher Education by Michael Vasquez explains common issues with reporting COVID-19 cases on college and university campuses: inconsistencies across school dashboards, administrations unwilling to report data, and other challenges.
  • New York’s school COVID-19 dashboard looks incredible… but where is it?

    I wrote in last week’s issue that New York state is launching a dashboard that will provide data on COVID-19 in public schools.

    New York Governor Andrew Cuomo discussed this dashboard in his online briefing last Tuesday, September 8. (If you’d like to watch, start at about 18:00.) He explained that every school district is now required to report test and case numbers daily to New York’s Department of Health. Local public health departments and state labs performing testing are also required to report these numbers, so that the state department can cross-check against three different sources. Cases and tests will be published by school on the new dashboard, called the COVID Report Card.

    In his briefing, Governor Cuomo showed a mockup of what the Report Card will look like. The available data includes positive cases by date, tests administered by the school (including test type, lab used, and test wait time), the school’s opening status (i.e. is it operating remotely, in person, or with a hybrid model), and the percentage of on-site students and staff who test positive.

    This dataset promises to be much more complete than any other state’s reporting on COVID-19 in schools. But I haven’t been able to closely examine these data yet, because the dashboard has yet to come online.

    According to reporting from Gothamist, state officials planned for the dashboard to begin showing data on September 9. As I send this newsletter on September 13, however, the dashboard provides only a message stating that the COVID Report Card will be live “when the reporting starts to come back.”

    “The facts give people comfort,” Governor Cuomo said in his briefing. So, Governor, where are the facts? Where are the data? When will New York students, parents, and teachers be able to follow COVID-19 in their schools? My calls to Governor Cuomo’s office and the New York State Department of Health have as yet gone unanswered, and subsequent press releases have not issued updates on the status of these data.

    I hope to return with an update on this dashboard next week. In the meantime, for a thorough look at why school COVID-19 data are so important and the barriers that such data collection has faced so far, I highly recommend this POLITICO feature by Biana Quilantan and Dan Goldberg.

  • School data update, Sept. 6

    Since last week’s issue, four more forms of official state reporting on COVID-19 in schools have come to my attention:

    • New Hampshire is publishing school-associated case data, including active cases, recovered cases, and outbreak status (not clearly defined) on a page of the state’s dashboard, updated daily.
    • Mississippi is publishing a weekly report on cases, quarantines, and outbreaks among students, teachers, and staff, aggregated by county. So far, the state has released reports on the weeks ending August 21 and August 28.
    • Hawaii’s state Department of Education is publishing a page on COVID-19 in the school district, updated weekly. (Did you know that the entire state of Hawaii is comprised of one school district?)
    • New York is launching a public dashboard on COVID-19 in schools; this dashboard will be available starting on September 9. So far, the page states that, “New York school districts will be required to provide the Department of Health with daily data on the number of people who have tested positive for COVID-19 beginning Tuesday, September 8th.” Last week, Mayor Bill de Blasio announced that classes in New York City would be delayed by two weeks to allow for more extensive safety precautions.

    In addition, the nonprofit civic data initiative USAFacts has compiled a dataset of reopening plans in America’s 225 largest public school districts. The dataset classifies reopening plans as online, hybrid, in-person, or other, with information as of August 17.

    Meanwhile, on the higher education front:

    • Education reporter (and friend of this newsletter!) Benjy Renton has launched a dashboard keeping track of COVID-19 outbreaks on college and university campuses. The dashboard organizes outbreaks according to their alert level, based on new cases in the past week.
    • I am continuing to monitor the COVID-19 metrics reported by college and university dashboards in my comparison spreadsheet. I haven’t had the chance to expand this analysis much in the past week, but it continues to be an ongoing project.
  • COVID-19 K-12 data continue to be patchwork

    Since I reviewed COVID-19 data in public school systems last week, a few things have changed:

    • Alisha Morris’ crowd-sourced spreadsheet of COVID-19 cases, closures, and other reopening plan changes in K-12 schools has leveled up, thanks to collaboration with the National Education Association. Concerned students, parents, and teachers can now explore the data and report cases on a new NEA-run website. This NPR article explains more of the project’s background and findings.
    • Brown University and national education organizations are working together to track school pandemic responses. Their findings, planned to be released in a dashboard this September, will include: enrollment, poverty level, internet access, COVID-19 cases, and district opening status.
    • Duval County Public Schools, a district in Florida, was barred from reporting school-related COVID-19 cases by the county’s public health department. According to the Florida Times-Union, the county stated that the school district could not publish “school specific data related to COVID-19” without the state health department’s permission.
    • Meanwhile, in Kentucky: this state’s COVID-19 dashboard now includes both a K-12 school public health report and a college and university public health report. Both reports, published daily, include active cases, deaths, and other statistics.
  • Data on schools reopening lag the actual reopening of schools

    Data on schools reopening lag the actual reopening of schools

    Reported COVID-19 cases in K-12 schools, compiled by Alisha Morris and other volunteers. Screenshot via Jon W.’s Tableau dashboard.

    As I wrote in my coverage of the congressional subcommittee hearing on national COVID-19 response a few weeks ago, everyone wants to reopen the schools.

    Politicians on both sides of the aisle, along with public health leaders such as the CDC’s Dr. Robert Redfield and NIAID’s Dr. Anthony Fauci, agree that returning to in-person learning is crucial for public health. Many children rely on food and health resources provided by schools. Parents rely on childcare. Without in-person schools, it is difficult for teachers and other mandated reporters to identify cases of child abuse. And all school students, from kindergarteners to college kids, are facing the mental health deterioration that comes from limited social interaction with their peers.

    But in deciding whether and how to return to in-person learning, school districts around the country are facing the same challenge that states faced early in the pandemic: they’re on their own. Some districts may have guidance from local government; in New York, for example, schools are allowed to reopen if they are located in an area with a under 5% of COVID-19 tests returning positive results. Every county in the state meets this guideline, and the state as a whole has had a positivity rate under 1% for weeks.

    Still, low community transmission does not indicate that a state is necessarily safe for reopening. Teachers in New York City have protested the city’s plan for school reopening, citing poor ventilation, no plan for regular testing, and other health concerns. Teachers in Detroit, outside of Phoenix, and other districts across the country are considering strikes. Earlier this week, the White House formally declared that teachers are essential workers—meaning they could continue working after exposure to COVID-19—which Randi Weingarten, president of the American Federation of Teachers, called a move to “threaten, bully, and coerce” teachers back into their unsafe classrooms. Meanwhile, many colleges and universities are planning to bring students from out of state into the communities around their campuses.

    As conversations on school reopening heighten at both national and local levels, a data journalist like myself has to ask: what data do we have on the topic? Is it possible to track how school reopening is impacting COVID-19 outbreaks, or vice versa?

    The answer is, as with any national question about COVID-19, the data are spotty. It’s possible to track cases and deaths at the county level, but no source comprehensively tracks testing at a level more local than the state. It is impossible to compare percent positivity rates—that crucial metric many districts are using to determine whether they can safely reopen—both broadly and precisely across the country.

    The best a data journalist can do is represented in this New York Times analysis. The Times pulled together county-level data from local public health departments and evaluated whether schools in each county could safely open based on new cases per 100,000 people and test positivity rates. Test positivity rates are difficult to standardize across states, however, because different states report their tests in different units. And, if you look closely at this story’s interactive map, you’ll find that some states—such as Ohio, New Hampshire, and Utah—are not reporting testing data at the county level at all.

    Still, some research projects and volunteer efforts are cropping up to document COVID-19 in schools as best they can. I will outline the data sources I’ve found here, and I invite readers to send me any similar sources that I’ve missed so that I can feature them in future issues.

    How schools are reopening

    • COVID-19 Testing in US Colleges: Sina Booeshaghi and Lior Pachter, two researchers from CalTech, put together a database documenting testing plans at over 500 colleges and universities throughout the U.S. The database is open for updates; anyone who would like to suggest an edit or contribute testing information on a new school can contact the researchers, whose emails are listed in the spreadsheet. Booeshaghi and Pachter wrote a paper on their findings, which is available in preprint form on medRxiv (it has not yet been reviewed by other scientists).
    • The College Crisis Initiative: Davidson College’s College Crisis Initiative (or C2i) maps out fall 2020 plans for about 3,000 colleges and universities. Clicking on a college in the interactive map leads users to see a brief description of the school’s opening policy, along with a link to the school’s website. Corrections may be submitted via a Google form.
    • District Budget Decisions: Edunomics Lab at Georgetown University has compiled a database of choices school districts are making about how to change their budgets and hiring during the COVID-19 pandemic. The database includes 302 districts at the time I send this newsletter; district choices are categorized as budget trimming, salary reductions, benefits adjustment, furloughs, and layoffs.

    Reporting COVID-19 in schools and districts

    • COVID-19 in Iowa: Iowa’s state dashboard includes a page which specifically allows users to check the test positivity rates in the state’s school districts. Click a school district in the table on the left, and the table on the right will automatically filter to show how testing is progressing in the counties encompassed by this district. So far, Iowa is the only state to make such data available in an accessible manner; other states should follow its lead.
    • NYT COVID-19 cases in colleges: Journalists at the New York Times surveyed public and private four-year colleges in late July. The analysis found at least 6,600 cases tied to 270 colleges since March. This dataset is not being actively updated, but it is an informative indicator of the schools that faced outbreaks in the spring and summer.
    • Individual school dashboards: Any large college or university that chooses to reopen, even in a partial capacity, must inform its students of COVID-19’s progress on campus. Some schools are communicating through regular emails, while others have put together school-specific dashboards for students, professors, and staff. Two examples of school dashboards can be found at Boston University and West Virginia University; at other schools, such as Georgia Tech, students have spun up their own dashboards based on school reports.

    Reopening gone wrong

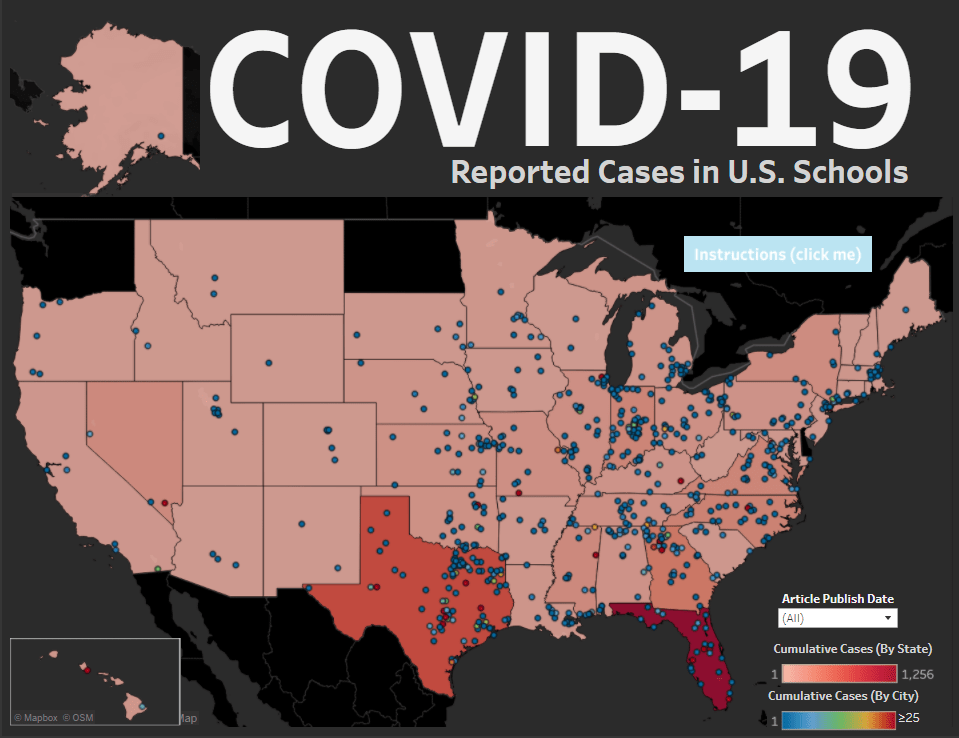
    • K-12 school closures, quarantines, and/or deaths: Weeks ago, Alisha Morris, a theater teacher in Kansas, started compiling news reports on instances of COVID-19 causing schools to stall or alter reopening plans. Morris’ project grew into a national spreadsheet with hundreds of COVID-19 school case reports spanning every U.S. state. She now manages the sheet with other volunteers, and the sheet’s “Home” tab advertises a new site coming soon. You can explore the dataset through a Tableau dashboard created by one volunteer.

    Datasets under development

    • FinMango and Florida COVID Action collaboration: FinMango, a global nonprofit which has pivoted to help COVID-19 researchers, has partnered with Florida COVID Action, a data project led by whistleblower Rebekah Jones, to track COVID-19 cases in K-12 schools. The project, called the COVID Monitor, has already been compiling reports from media and members of the public since July. It includes about 1,300 schools with confirmed or reported COVID-19 cases so far, 200 of which are in the project’s home state of Florida.
    • ProPublica school reopening survey: A new initiative from ProPublica asks students, parents, educators, and staff to report on their schools’ reopening plans. Readers who might prefer to share information with ProPublica through more private means can get in touch on Signal or visit the publication’s tips page.
    • Nature university reopening survey: Similarly to ProPublica, Nature News is surveying its readers on their reopening experience. This survey specifically calls on research scientists to share how they will be teaching and if they agree with the approach their university has taken on reopening. Respondents who wish for more privacy can use Signal or WhatsApp.