Tag: SARS-CoV-2 variants

  • How to talk about breakthrough cases

    How to talk about breakthrough cases

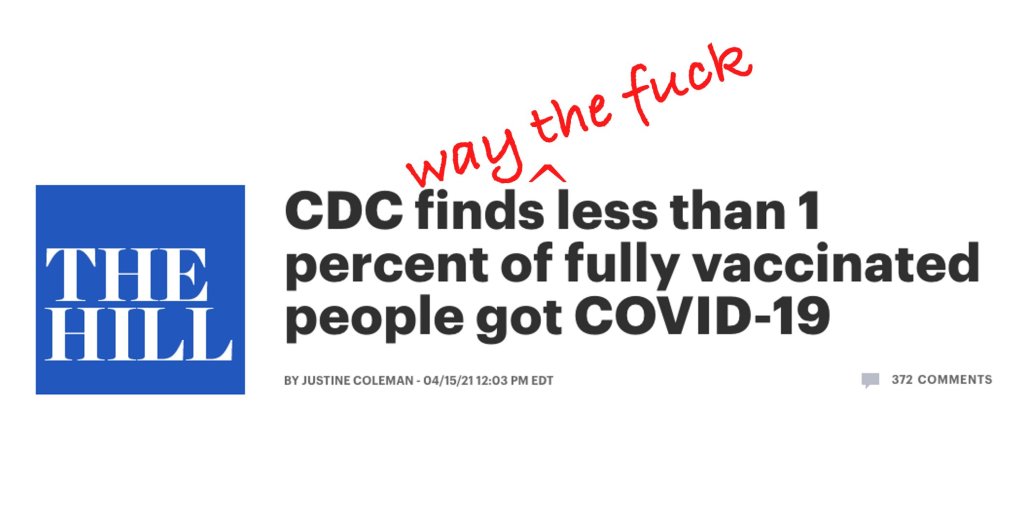
    This week, The Hill posted an article with a rather misleading headline: “CDC finds less than 1 percent of fully vaccinated people got COVID-19.” If you actually click into the piece, you’ll find that the precise number is less than 0.008%. Less than 0.0005% have been hospitalized and less than 0.0001% have died.

    This headline reflects a common issue with vaccine reporting that I’ve seen in the past few weeks. A lot of journalists, especially those who aren’t familiar with the science/health beat, may be inclined to publish news of breakthrough cases as surprising or monumental. In fact, these cases—referring to a COVID-19 infection that occurs after someone has been fully vaccinated—are entirely normal, yet incredibly rare.

    No vaccine is perfect. Even the Pfizer and Moderna vaccines, which both demonstrated 95% efficacy in their late-stage clinical trials and over 90% effectiveness in the real world, are not perfect. Scientists still expect a few COVID-19 infections to slip through the immune system defenses built up by these vaccines and cause illness in a small number of patients.

    And it really is a small number: 129 million Americans have received at least one dose of a COVID-19 vaccine as of yesterday, per the CDC, and 82 million have been fully vaccinated. The agency has only documented 5,800 breakthrough cases. Less than 0.008% of those people who have been fully vaccinated. That’s the equivalent of one-quarter of a seat in Queens’ Citi Field baseball stadium (which seats about 42,000).

    So, if you’re a journalist reporting on this issue—whether it’s nationally or in your community—it’s important to stress that denominator. 82 million fully vaccinated, 5,800 breakthrough cases. Emphasizing the difference in magnitude between these numbers can show readers that, while they should still maintain some caution after getting vaccinated, the vaccines are overwhelmingly safe and effective.

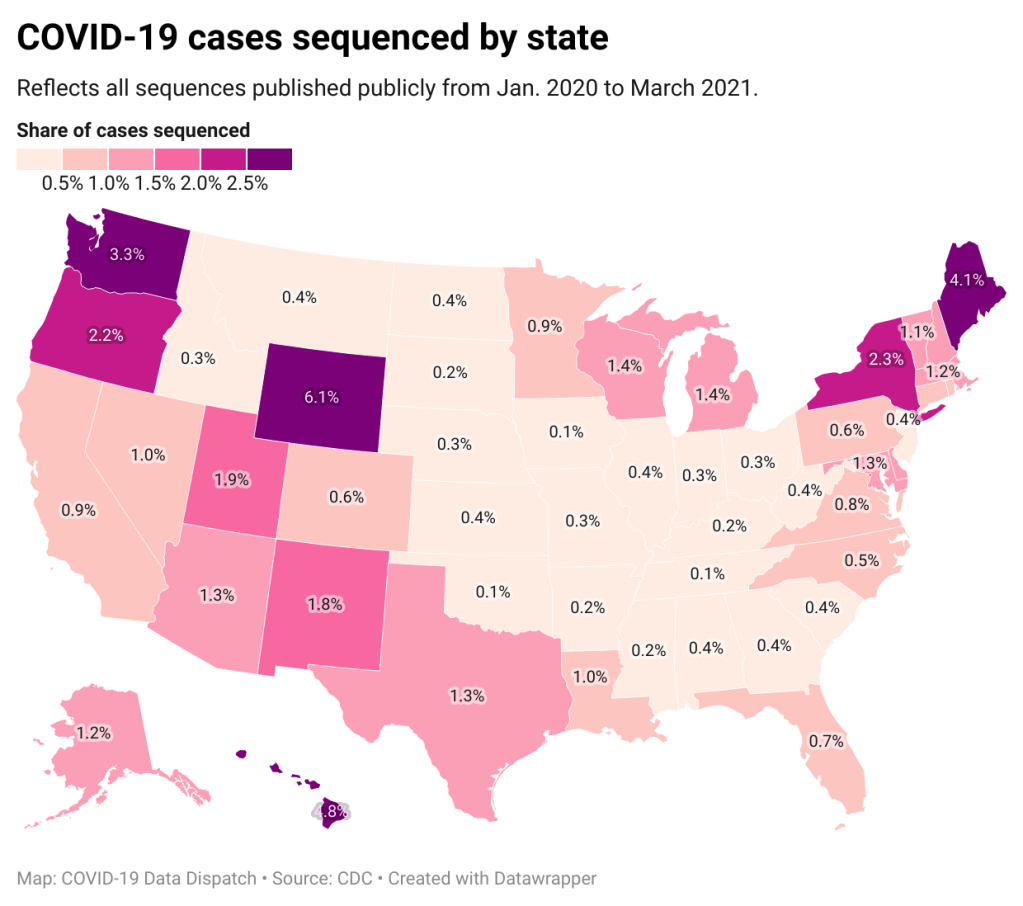
    Small as the breakthrough case numbers are, though, it is important that we still talk about them. A new article by ProPublica’s Caroline Chen discusses how a failure to collect data on breakthrough cases is making it harder for COVID-19 researchers to understand what causes them. Specifically: we should be sequencing the genomes of the coronavirus strains that caused these cases, and by and large, we aren’t.

    Chen describes how many state health departments aren’t getting breakthrough case samples to sequence, whether that’s due to testing labs failing to store the test samples or cases being identified through rapid tests, which do not have established pipelines. Plus, in some cases, we aren’t even recording whether the patients went to the hospital or died—key data points in the U.S.’s continued vaccine monitoring.

    I definitely recommend you read the full piece, but here’s a section that will give you the big idea:

    In many instances, patients’ samples are not sequenced to find out if a variant might have been involved; some labs are throwing out test samples before an analysis can be done; hospitals and clinics aren’t always collecting new samples to analyze them. That means that for so many people, nobody will ever know if a variant was involved, leaving public health officials without data to be able to examine the extent to which variants are contributing to breakthrough cases.

    “It’s alarming that we can’t sequence more of the virus than we’re able to now — that’s something we need to resolve,” said Brian Castrucci, chief executive officer at the de Beaumont Foundation, a health philanthropy. “The more we know, the better we can react. We want to know the information so that we can make the right policy and health decisions.”

    While the CDC has an info page on breakthrough cases, no data on these cases are available on the agency’s COVID-19 dashboard. Reporters need to walk a delicate line on this issue: pursue the data, but report it in a careful, conscientious way that appropriately puts the tiny breakthrough case numbers in context.

    More vaccine news

    • Sources and updates, November 12
      Sources and updates for the week of November 12 include new vaccination data, a rapid test receiving FDA approval, treatment guidelines, and more.
    • How is the CDC tracking the latest round of COVID-19 vaccines?
      Following the end of the federal public health emergency in May, the CDC has lost its authority to collect vaccination data from all state and local health agencies that keep immunization records. As a result, the CDC is no longer providing comprehensive vaccination numbers on its COVID-19 dashboards. But we still have some information about this year’s vaccination campaign, thanks to continued CDC efforts as well as reporting by other health agencies and research organizations.
    • Sources and updates, October 8
      Sources and updates for the week of October 8 include new papers about booster shot uptake, at-home tests, and Long COVID symptoms.
    • COVID source shout-out: Novavax’s booster is now available
      This week, the FDA authorized Novavax’s updated COVID-19 vaccine. Here’s why some people are excited to get Novavax’s vaccine this fall, as opposed to Pfizer’s or Moderna’s.
  • CDC stepped up sequencing, but the data haven’t kept pace

    CDC stepped up sequencing, but the data haven’t kept pace

    If the U.S. does see a fourth surge this spring, one of the main culprits will be variants. Three months after the first B.1.1.7-caused case was detected in this country, that variant now causes about one third of new COVID-19 cases nationwide. The B.1.1.7 variant, first detected in the U.K., spreads more readily and may pose a higher risk of hospitalization and death.

    Meanwhile, other variants have taken root. There’s the variant that originated in California, B.1.427/B.1.429, which now accounts for over half of cases in the state. There’s the variant that originated in New York City, B.1.526, which is quickly spreading in New York and likely in neighboring states. And there’s the variant that originated in Brazil, P.1; this variant has only been identified about 200 times in the U.S. so far, but it’s wreaking havoc in Brazil and some worry that it may be only a matter of time before we see it spread here.

    The thing about viral variants—especially those more-transmissible variants—is, they’re like tribbles. They might seem innocuous at first, but if left to multiply, they’ll soon take over your starship, eat all your food, and bury you in the hallway. (If you didn’t get that reference, watch this clip and then get back to me.) The only way to stop the spread is to first, identify where they are, and then use the same tried-and-true COVID-19 prevention measures to cut off their lineages. Or, as Dr. McCoy puts it: “We quit feeding them, they stop breeding.”

    In the U.S., that first part—identify where the variants are—is tripping us up. The CDC has stepped up its sequencing efforts in a big way over the past few months, going from 3,000 a week in early January to 10,000 a week by the end of March. But data on the results of these efforts are scarce and uneven, with some states doing far more sequencing than others. New York City, for example, has numerous labs frantically “hunting down variants,” while many less-resourced states have sequenced less than half a percent of their cases. And the CDC itself publishes data with gaping holes and lags that make the numbers difficult to interpret.

    The CDC has three places you can find data on variants and genomic sequencing; each one poses its own challenges.

    First, there’s the original variant data tracker, “US COVID-19 Cases Caused by Variants.”  This page reports sheer numbers of cases caused by three variants of concern: B.1.1.7 (U.K. variant), B.1.351 (South Africa variant), and P.1 (Brazil variant). It’s updated three times a week, on Tuesdays, Thursdays, and Sundays—the most frequent schedule of any CDC variant data.

    But the sheer numbers of cases reported lack context. What does it mean to say, for example, the U.S. has about 12,500 B.1.1.7 cases, and 1,200 of them are in Michigan? It’s tricky to explain the significance of these numbers when we don’t know much sequencing Michigan is doing compared to other states.

    This dataset is also missing some pretty concerning variants: both the B.1.526 (New York) and B.1.427/B.1.429 (California) variants are absent from the map and state-by-state table. According to other sources, these variants are spreading pretty rapidly in their respective parts of the country, so there should be case numbers reported to the CDC—it’s unclear why the CDC hasn’t yet made those numbers public.

    (To the CDC’s credit, the California variant was recently reclassified as a “variant of concern,” and Dr. Walensky said at a press briefing this week that the New York variant is under serious investigation to get that same reclassification bump. But that seems to be a long process, as it hasn’t happened weeks after the variant emerged.)

    Second, there’s the variant proportions tracker, which reports what it sounds like: percentages, representing the share of COVID-19 cases that CDC researchers estimate are caused by different coronavirus variants. The page includes both national estimates and state-by-state estimates for a pretty limited number of states that have submitted enough sequences to pass the CDC’s threshold.

    I wrote about this page when it was posted two weeks ago, calling out the stale nature of these data and the lack of geographic diversity. There’s been one update since then, but only to the national variant proportions estimates; those numbers are now as of March 13 instead of February 27. The state numbers are still as of February 27, now over a month old.

    Note that Michigan—the one state everyone’s watching, the state that has reported over 1,000 B.1.1.7 cases alone—is not included in the table. How are we supposed to use these estimates when they so clearly do not reflect the current state of the pandemic?

    !function(){“use strict”;window.addEventListener(“message”,(function(a){if(void 0!==a.data[“datawrapper-height”])for(var e in a.data[“datawrapper-height”]){var t=document.getElementById(“datawrapper-chart-“+e)||document.querySelector(“iframe[src*=’”+e+”‘]”);t&&(t.style.height=a.data[“datawrapper-height”][e]+”px”)}}))}();

    A third variant-adjacent data page, added to the overall CDC COVID Data Tracker this past week, provides a bit more context. This page provides data on published SARS-CoV-2 sequences provided by the CDC, state and local public health departments, and other laboratory partners. You can see the sheer number of sequenced cases grow by week and compare state efforts.

    It’s pretty clear that some states are doing more sequencing than others. States with major scientific capacity—Washington, Oregon, New York, D.C.—are near the top. Some states with smaller populations are also on top of the sequencing game: Wyoming, Hawaii, Maine. But 32 states have sequenced fewer than 1% of their cases in total, and 21 have sequenced fewer than 0.5%. That’s definitely not enough sequences for the states to be able to find pockets of new variants, isolate those transmission chains, and stop the breeding.

    !function(){“use strict”;window.addEventListener(“message”,(function(a){if(void 0!==a.data[“datawrapper-height”])for(var e in a.data[“datawrapper-height”]){var t=document.getElementById(“datawrapper-chart-“+e)||document.querySelector(“iframe[src*=’”+e+”‘]”);t&&(t.style.height=a.data[“datawrapper-height”][e]+”px”)}}))}();

    Chart captions state that the state-by-state maps represent cases sequenced “from January 2020 to the present,” while a note at the bottom says, “Numbers will be updated every Sunday by 7 PM.” So are the charts up to date as of today, April 4, or are they up to date as of last Sunday, March 28? (Note, I put simply “March 2021” on my own chart with these data.)

    Obviously, the lack of date clarity is annoying. But it’s also problematic that these are cumulative numbers—reflecting all the cases sequenced during more than a year of the pandemic. Imagine trying to make analytical conclusions about COVID-19 spread based on cumulative case numbers! It would simply be irresponsible. But for sequencing, these data are all we have.

    So, if anyone from the CDC is reading this, here’s my wishlist for variant data:

    • One singular page, with all the relevant data. You have a COVID Data Tracker, why not simply make a “Variants” section and embed everything there?
    • Regular updates, coordinated between the different metrics. One month is way too much of a lag for state-by-state prevalence estimates.
    • Weekly numbers for states. Let us see how variants are spreading state-by-state, as well as how states are ramping up their sequencing efforts.
    • More clear, consistent labeling. Explain that the sheer case numbers are undercounts, explain where the prevalence estimates come from, and generally make these pages more readable for users who aren’t computational biologists.

    And if you’d like to see more variant case numbers, here are a couple of other sources I like:

    • Coronavirus Variant Tracker by Axios, providing estimated prevalence for four variants of concern and two variants of interest, along with a varants FAQ and other contextual writing.
    • CoVariants, a tracker by virologist Emma Hodcroft that shows variant spread around the world based on public sequencing data. Hodcroft posts regular updates on Twitter.
    • Nextstrain, an open-source genome data project. This repository was tracking pathogens long before COVID-19 hit, and it is a hub for sequence data and other related resources.

    The U.S. has blown past its current sequencing goal (7,000 cases per week), but is aiming to ramp up to 25,000—and has invested accordingly. I hope that, in addition to ramping up all the technology and internal communications needed for this effort, the CDC also improves its public data. The virus is multiplying; there’s no time to waste.

    Related posts

    • New CDC page on variants still leaves gaps

      New CDC page on variants still leaves gaps

      This week, the CDC published a new data page about the coronavirus variants now circulating in the U.S. The page provides estimates of how many new cases in the country may be attributed to different SARS-CoV-2 lineages, including both more familiar, wild-type variants (B.1. and B.1.2) and newer variants of concern.

      This new page is a welcome addition to the CDC’s library, as their “Cases Caused by Variants” page only provides numbers of variant cases reported to the agency—which, as we have repeatedly stated at the CDD, represent huge undercounts.

      However, the page still has three big problems:

      First, the data are old. The CDC is currently reporting data for four two-week periods, the most recent of which ends February 27. That’s a full three weeks ago—a pretty significant lag when several “variants of concern” are concerning precisely because they are more infectious, meaning they can spread through the population more quickly.

      The CDC’s B.1.1.7 estimate (about 9% as of Feb. 27) particularly sticks out. CoVariants, a variant tracker run by independent researcher Emma Hodcroft, also puts B.1.1.7 prevalence in the U.S. at about 10% in late February… but estimates this variant accounts for 22% of sequences as of March 8. These estimates indicate that B.1.1.7 may have doubled its case counts in the two weeks after the CDC’s data stop.

      Second, the CDC data reveal geographic gaps in our current sequencing strategy. The CDC is providing state-by-state prevalence estimates for 19 select states—or, those states that are doing a lot of genomic sequencing. Of course, this includes big states such as California and New York, but excludes much of the Midwest and other smaller, less scientifically-endowed states.

      Michigan, that state currently facing a concerning surge, is not represented—even though the state has one of the highest raw counts of B.1.1.7 cases, as of this week. We can gather from a footnote that Michigan did not submit at least 300 sequences to the CDC between January 13 and February 13; still, this exclusion poses a challenge for researchers watching that surge.

      And finally, the data are presented in a confusing manner. When I shared this page with a couple of COVID Tracking Project friends on Friday, it took the group a lot of close-reading and back-and-forth to unpack those first two problems. And we’re all used to puzzling through confusing data portals! The CDC claims this page is an up-to-date tracker, “used to inform national and state public health actions related to variants,” but its data are weeks old and represent less than half of the country.

      The CDC needs to improve its communication of data gaps, lags, and uncertainties, especially on such an alarming topic as variants. And, of course, we need better variant data to begin with. The U.S. is aiming to sequence 25,000 samples per week, but that’s still far from the 5% of new cases we would need to sequence in order to develop an accurate picture of variant spread in the U.S.

      On that note: you may notice that we now have a new category for variant posts on the CDD website. I expect that this will continue to be a major topic for us going forward.

      Related posts

      • National Numbers, March 21

        National Numbers, March 21

        In the past week (March 13 through 19), the U.S. reported about 372,000 new cases, according to the CDC. This amounts to:

        • An average of 53,000 new cases each day
        • 113 total new cases for every 100,000 Americans
        • 1 in 881 Americans getting diagnosed with COVID-19 in the past week
        • Only 10,000 fewer new cases than last week (March 6-12)
        Nationwide COVID-19 metrics as of March 19, sourcing data from the CDC and HHS. Posted on Twitter by Conor Kelly.

        Last week, America also saw:

        • 32,900 new COVID-19 patients admitted to hospitals (10 for every 100,000 people)
        • 7,200 new COVID-19 deaths (2.2 for every 100,000 people)
        • An average of 2.3 million vaccinations per day (per Bloomberg)

        Three months into his presidency, Joe Biden has already met one of his biggest goals: 100 million vaccinations in 100 days. This includes 79 million people who have received at least one dose, and 43 million who are now fully vaccinated. Two-thirds of Americans age 65 and older have received at least their first dose.

        Our current phase of the pandemic may be described as a race between vaccinations and the spread of variants. Right now, it’s not clear who’s winning. Despite our current vaccination pace, the U.S. reported only 10,000 fewer new cases this week than in the week prior—and rates in some states are rising.

        Michigan is one particular area of concern: COVID Tracking Project data watchers devoted an analysis post to the state this week, writing, “the Detroit area now ranks fourth for percent change in COVID-19 hospital admissions from previous week—and first in increasing cases and test positivity.” Hospitalization rates in New York and New Jersey are also in a plateau.

        These concerning patterns may be tied to coronavirus variants. Michigan has the second-highest reported count of B.1.1.7 cases, after Florida, and New York City is currently facing its own variant. The CDC’s national B.1.1.7 count passed 5,000 this week—more than double the count from late February.

        As genomic surveillance in the U.S. improves, the picture we can paint of our variant prevalence becomes increasingly concerning. But that picture is still fuzzy—more on that later in this issue. 

      • Featured sources, March 14

        • Helix COVID-19 Surveillance Dashboard: Helix, a population genomics company, is one of the leading private partners in the CDC’s effort to ramp up SARS-CoV-2 sequencing efforts in the U.S. The company is reporting B.1.1.7 cases identified in select states, along with data on a mutation called S gene target failure (or SGTF) that scientists have found to be a major identification point in distinguishing B.1.1.7 from other strains.
        • COVID-19 related deaths by occupation, England and Wales: This is another source that I used for my Pop Sci story. The U.S. doesn’t publish any data connecting COVID-19 cases or deaths to occupations, but the U.K. data falls along similar lines to what we’d expect to see here: essential workers have been hit hardest. Men in “elementary occupations,” a class of jobs that require some physical labor, and women in service and leisure occupations have the highest death rates.
        • The Impact of the COVID-19 Pandemic on LGBT People: This brief from the Kaiser Family Foundation addresses a key data gap in the U.S.; the national public health agencies and most states do not publish any data on how the pandemic has specifically hit the LGBTQ+ community. KFF surveys found that a larger share of LGBTQ+ adults have experienced job loss and negative health impacts in the past year, compared to non-LGBTQ+ adults.

      • NYC variant looks like bad news

        In a press conference on Wednesday, NYC mayor Bill de Blasio confirmed that the recently identified NYC variant (since christened B-1526) is outpacing the original strain in spreading speed, and his senior advisor for Public Health, Dr. Jay Varma, said that these two variants combined account for 51% of all cases in the city.  This is coming from a preliminary analysis, and so far, they have not found that B-1526 is more deadly or that it may evade vaccine efficacy. However, it’s still worrying.

        It’s probably contributing to the relatively slower pace of decline in cases in NY versus the rest of the country: 

        And this comes when NYC is increasing indoor dining capacity to 50%, and when NY is going to scrap its rule on people from out of state having to quarantine on April 1. De Blasio has told New Yorkers to stay the course, but the people in charge (Andrew Cuomo) don’t seem to want to follow that advice.

      • Featured sources, March 7

        • Coronavirus variant data from USA TODAY: The CDC doesn’t publish a time series of its counts of COVID-19 cases caused by variants. So, USA TODAY journalists have set up a program to scrape these data whenever the CDC publishes an update and store the data in a CSV, including variant counts for every U.S. state. The time series goes back to early January.
        • Documenting COVID-19: This repository is one of several great resources brought to my attention during this past week’s NICAR conference. It’s a database of documents related to the pandemic, obtained through state open-records laws and the Freedom of Information Act (FOIA). 246 records are available as of February 26.
        • VaccinateCA API: California readers, this one’s for you. The community-driven project VaccinateCA, aimed at helping Californians get vaccinated, has made its underlying data available for researchers. The API includes data on vaccination sites and their availability across the state.

      • National numbers, March 7

        National numbers, March 7

        In the past week (February 28 through March 6), the U.S. reported about 417,000 new cases, according to the COVID Tracking Project. This amounts to:

        • An average of 60,000 new cases each day—comparable to the seven-day average for daily cases in early August
        • 127 total new cases for every 100,000 Americans
        • 1 in 786 Americans getting diagnosed with COVID-19 in the past week
        Nationwide COVID-19 metrics published in the COVID Tracking Project’s daily update on March 6. This will be the final week we use Project data for these updates.

        Last week, America also saw:

        • 41,400 people now hospitalized with COVID-19 (13 for every 100,000 people)
        • 12,100 new COVID-19 deaths (3.7 for every 100,000 people)
        • An average of 2.2 million vaccinations per day (per Bloomberg)

        The U.S. recorded fewer new daily cases this week than last week, finally dropping to a level lower than the summer surge. We saw fewer hospitalized COVID-19 patients and deaths from the disease this week as well. But the possibility of a plateau—or even a variant-driven fourth surge—is worrying some experts. CDC Director Dr. Rochelle Walensky has cited this concern in press briefings over the past week, encouraging that Americans “double down on prevention measures.”

        Dr. Walensky’s assertion is backed up by a new CDC report that links mask mandates and dining restrictions to reduced community spread. (We knew this already, of course, but it’s always nice to have a CDC report you can cite.)

        Variants, meanwhile, continue to spread. We’re up to 2,600 reported B.1.1.7 cases, though this and other variant counts are likely significantly underreported. Nature’s Ewen Callaway calls attention to variant reporting issues in a recent story: despite national efforts to ramp up sequencing, the practice is still heavily decentralized in the U.S., with heavily-resourced states like New York and California sequencing thousands of genomes while other states collect far fewer. And “homegrown” variants of concern, such as the variant reportedly spreading through New York City, don’t even appear on the CDC’s dashboard yet.

        But vaccinations give us one place to be optimistic. More than two million Americans are now getting a dose each day, per Bloomberg, with the first Johnson & Johnson shots landing on the market this week. After the announcement of a cross-pharma partnership (Merck giving J&J a manufacturing boost), President Biden said that the U.S. will have enough COVID-19 vaccine doses for every adult by the end of May. How quickly—and how equitably—those doses get administered will be another battle. 

        Finally, a sad acknowledgment: with the COVID Tracking Project concluding data collection today, I will be switching my source for these updates starting next week. I plan to use CDC and HHS data, relying heavily on the CDC’s new COVID Data Tracker Weekly Reviews. More on filling the CTP-shaped hole in your data in the next section.

      • National numbers, Feb. 28

        National numbers, Feb. 28

        In the past week (February 21 through 27), the U.S. reported about 475,000 new cases, according to the COVID Tracking Project. This amounts to:

        • An average of 68,000 new cases each day—about 2,000 more cases than the seven-day average on July 27, near the peak of the summer surge
        • 145 total new cases for every 100,000 Americans
        • 1 in 692 Americans getting diagnosed with COVID-19 in the past week
        Nationwide COVID-19 metrics published in the COVID Tracking Project’s daily update on February 27. New daily cases are now at a level similar to the summer peak.

        Last week, America also saw:

        • 48,900 people now hospitalized with COVID-19 (15 for every 100,000 people)
        • 14,300 new COVID-19 deaths (4.4 for every 100,000 people)
        • An average of 1.65 million vaccinations per day (per Bloomberg)

        After several weeks of declines, cases now appear to be in a plateau. But the COVID Tracking Project cautions that these numbers may also be the aftershocks of President’s Day and the winter storm, which led to artificially low numbers last week and delayed reporting arriving this week.

        One thing is for certain, though: vaccinations are recovering from the storm. We had two record vaccination days Friday and yesterday, with 2.2 million doses and 2.4 million doses reported, respectively. Nearly one in five adults and half of American seniors have received their first shot, White House advisor Andy Slavitt said in a COVID-19 briefing on Friday.

        Last week, we noted that vaccinations were already having an impact in nursing homes and other long-term care facilities. The Kaiser Family Foundation picked up that trend this week, with an analysis showing that deaths in these facilities have declined at the same time as residents have received vaccine doses. In the first month of America’s vaccine rollout, long-term care deaths decreased by 66%, while all other U.S. deaths increased by 61%.

        We can’t get complacent, though. The U.S. has now reported over 2,100 cases of the B.1.1.7 variant, up from 1,500 last week. Homegrown variants that originated in California and New York aren’t yet reported on the CDC’s variant cases dashboard, but I recommend reading up on them. B.1.526, the New York variant, may now account for one in four cases in NYC, per the New York Times; this variant has acquired a mutation that may make it less susceptible to vaccines.

        Federal public health leadership cited variant cases in COVID-19 briefings this week, advising Americans to keep up all the public health measures that have become so familiar by now: wear a mask, avoid crowds and travel, and get a vaccine when it’s available to you.

      • Featured sources, Feb. 21

        • Bloomberg’s COVID-19 Vaccine Tracker: We’ve featured Bloomberg’s tracker in the CDD before (in fact, you can read Drew Armstrong’s walkthrough of the dashboard here), but it’s worth highlighting that the Bloomberg team made two major updates this week. First, they added a demographic vertical, which includes race and ethnicity data for the U.S. overall and for 27 states that are reporting these data. This vertical will be updated weekly. Second, the team made all of their data available on GitHub! I, for one, am quite excited to dig through the historical figures.
        • CoVariants: This new resource from virus tracker Dr. Emma Hodcroft provides an overview of SARS-CoV-2 variants and mutations. You can explore how variants have spread across different parts of the world through brightly colored charts. The resource is powered by GISAID, Nextstrain, and other sequencing data; follow Dr. Hodcroft on Twitter for regular updates.
        • The Next Phase of Vaccine Distribution: High-Risk Medical Conditions (from KFF): The latest analysis brief from the Kaiser Family Foundation looks at how individuals with high-risk medical conditions are being prioritized for vaccine distribution in each state. KFF researchers compared each state’s prioritization plans to the CDC’s list of conditions that “are at increased risk” or “may be at an increased risk” for severe illness due to COVID-19; the analysis reflects information available as of February 16.
        • First Month of COVID-19 Vaccine Safety Monitoring (CDC MMWR): This past Friday, the CDC released a Morbidity and Mortality Weekly Report with data from the first month of safety monitoring, using the agency’s Vaccine Adverse Event Reporting System (or VAERS). Out of the 13.8 million vaccine doses administered during this period, about 7,000 adverse events were reported—and only 640 were classified as serious. Check the full report for figures on common side effects and enrollment in the CDC’s new v-safe monitoring program.