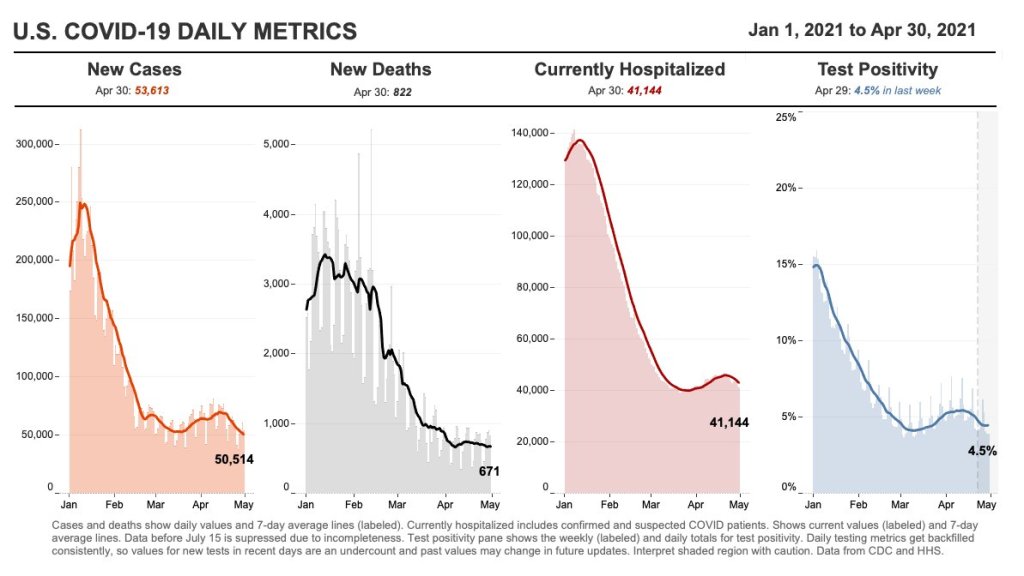
35,400 new COVID-19 patients admitted to hospitals (11 for every 100,000 people)
4,400 new COVID-19 deaths (1.3 for every 100,000 people)
59.2% of new cases in the country now B.1.1.7-caused (as of April 10)
An average of 2.55 million vaccinations per day (per Bloomberg)
New cases are down for the second week in a row—good news after the 70,000-plus peak of mid-April. Still, 50,000-plus cases in a day is no good place to plateau, new hospital admissions remain over 5,000 a day, and vaccinations are slowing: the U.S. is now averaging about 2.6 million shots a day, down from 3.4 million a couple of weeks ago.
As we discussed last week, the U.S. vaccination campaign has entered a phase in which supply is higher than demand. Even with Johnson & Johnson now back on the market, many of the people who were desperate to get their shots have already secured those doses, leaving public health experts and local leaders to figure out how to both lower access barriers and alleviate concerns in less vaccine-confident communities.
There is one good piece of vaccine news this week, though: several states are closing their vaccine equity gaps, according to Bloomberg’s tracker. White vaccination rates are slowing more drastically than rates in minority populations, allowing those communities to catch up. “Since early February, Alabama, Louisiana, Maryland, Mississippi and North Carolina have narrowed their Black vaccination gaps most,” Bloomberg’s team reports.
Meanwhile, the coronavirus variants just keep spreading. The CDC updated its variant proportions data this week, reporting that B.1.1.7 is now causing a clear majority of COVID-19 cases in the country (59%). Michigan, Minnesota, and Tennessee have B.1.1.7 proportions closer to 70%. B.1.1.7 also appears to be outcompeting the California variants (B.1.427/B.1.429) in parts of the West where those variants had previously dominated. Still, as we keep emphasizing, these data are several weeks old; this week’s CDC update includes figures as of April 10, and the true B.1.1.7 numbers are likely higher.
Stay safe out there, readers, and help your communities get vaccinated.
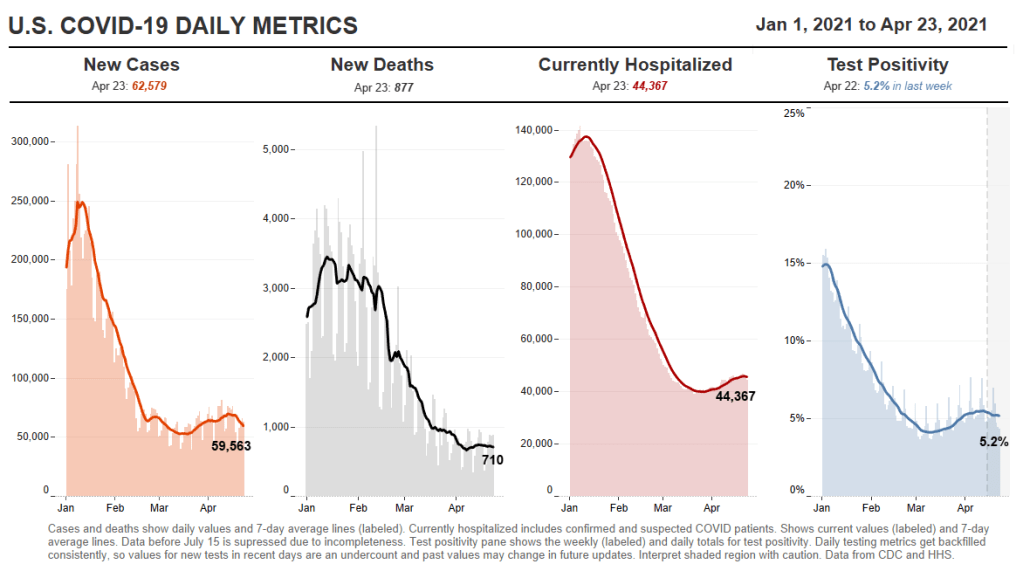
39,400 new COVID-19 patients admitted to hospitals (12 for every 100,000 people)
4,800 new COVID-19 deaths (1.5 for every 100,000 people)
44.7% of new cases in the country now B.1.1.7-caused (as of March 27)
An average of 2.9 million vaccinations per day (per Bloomberg)
After several weeks of rising cases, the federal numbers dropped this week by about 10%. Michigan’s case rates fell below 500 new cases per 100,000 people and its positivity rate is trending downward, leading public health experts to hope that this state’s worrying outbreak may have peaked.
As always, though, we can’t get too excited about a single-week trend—and 60,000 new cases each day is still a concerning level at which to plateau. Over 5,000 Americans are being admitted to hospitals with COVID-19 each day, and more of these patients are now younger as this age group is the last to become eligible for vaccination. COVID-19 is becoming more of a “young person’s disease,” as Sarah Zhang wrote in The Atlantic last week.
Variants are still a concern, too—but I have no updates on variant numbers because the CDC has not updated its Variant Proportions data since our last issue. According to revised figures (still as of March 27), B.1.1.7 is causing about 45% of cases in the U.S., and the California (B.1.427/B.1.429) and New York City (B.1.526) variants are causing about 10% of cases each. Good news on the NYC variant, though: recent studies have suggested that the Pfizer and Moderna vaccines will effectively protect New Yorkers against this variant, per the New York Times.
While the U.S. met President Biden’s 200 million dose goal last week, the pace of vaccinations is now slowing. We’re seeing about 2.9 million doses administered each day, compared to over 3 million a week ago. While this may be due in part to the Johnson & Johnson pause (more on that later), a bigger culprit is likely that vaccine supply is starting to eclipse demand. In other words, everyone who was desperate to get vaccinated has now gotten their shot, leaving those who are less confident or may have a harder time accessing an appointment. A new Kaiser Family Foundation report suggests that the U.S. is now vaccinating people in the “wait and see” group, and likely will have reached everyone in that group within a couple more weeks.
It’s heartening to see case numbers drop, but we aren’t out of the woods yet. It will take coordinated communication and lifting of access barriers to reach a “vaccinated summer” here in the U.S… to say nothing of the rest of the world.
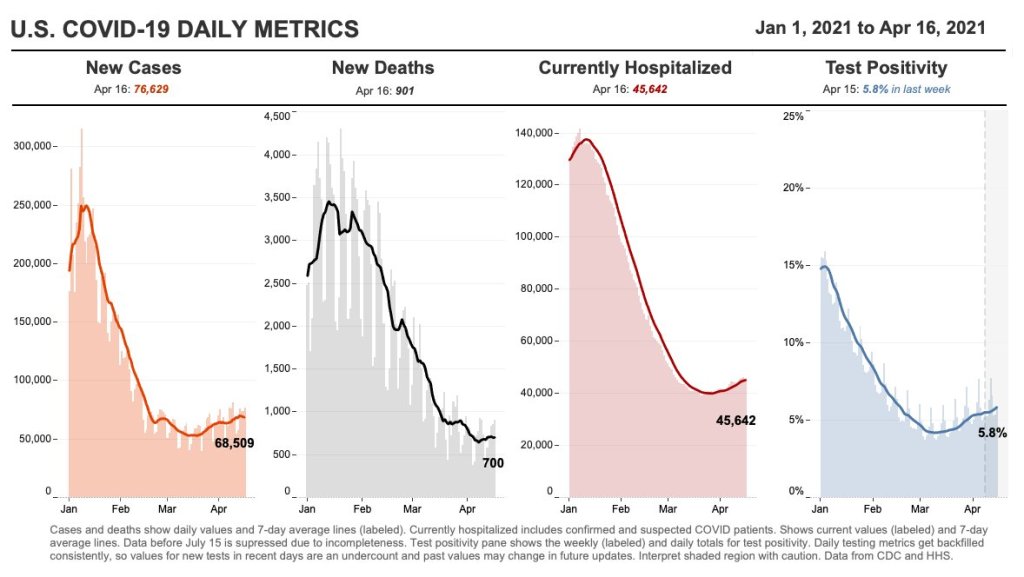
38,500 new COVID-19 patients admitted to hospitals (11.7 for every 100,000 people)
5,000 new COVID-19 deaths (1.5 for every 100,000 people)
44.1% of new cases in the country now B.1.1.7-caused (as of March 27)
An average of 3.2 million vaccinations per day (per Bloomberg)
I am really worried about Michigan. The state comprises a full 11% of new U.S. cases in the past week—and Michigan only makes up 3% of the national population. On any COVID-19 chart right now, Michigan sticks out like a sore thumb. Over 500 new cases per 100,000 people in a week, 4,200 new COVID-19 patients in a week, 15% positivity rate… none of the signs are good.
B.1.1.7 seems to have truly taken hold in Michigan. Combine that with a resistance to safety restrictions, and the state may serve as a warning of what other parts of the country may experience soon if we don’t keep up the pace on vaccinations. For more reporting on the state, I recommend Jonathan Cohn’s recent story in HuffPost.
B.1.1.7 has taken hold elsewhere, too. The variant is now causing at least 44% of the new cases in the country, as of the CDC’s most recent data (March 27). As that figure is now over two weeks old, the true prevalence is most likely much higher. Meanwhile, the NYC variant (B.1.526) and California variants (B.1.427/B.1.427) are each accounting for 10% of cases nationally, troubling figures on their own.
On the optimistic front, though, the daily average for vaccinations is now up at 3.2 million. The last few states that haven’t yet opened up eligibility to their entire adult populations will do so tomorrow, meeting President Biden’s deadline. We’ve also reached 200 million doses administered, ahead of Biden’s (revised) goal for his first 100 days in office.
Will these vaccinations be enough to break the tide of variant cases? I hope so. The vaccines at least appear to be protecting our most vulnerable neighbors so far, though; the death rate has remained below 1,000 per day despite several weeks of rising cases and hospitalizations.
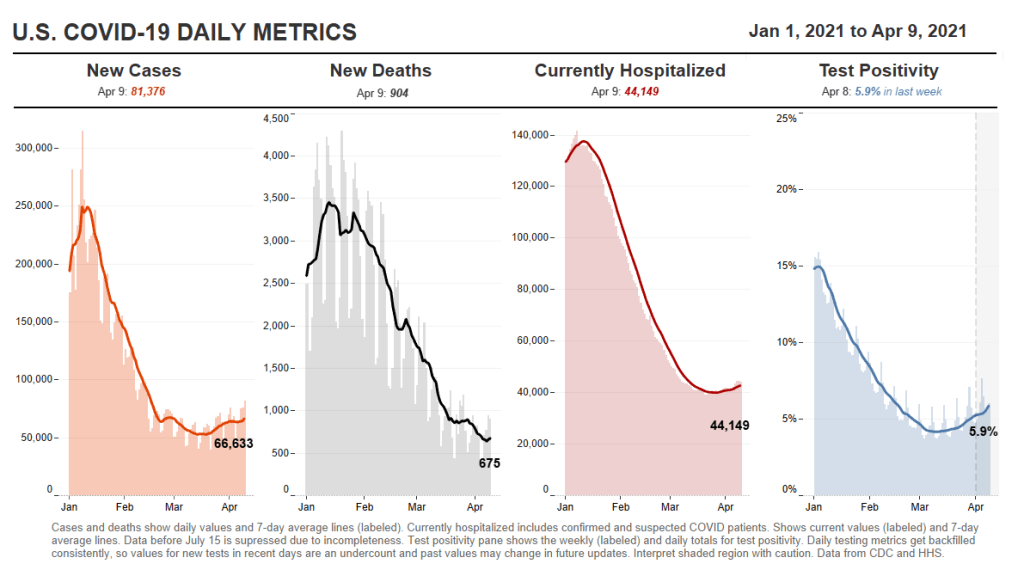
37,400 new COVID-19 patients admitted to hospitals (11.4 for every 100,000 people)
5,000 new COVID-19 deaths (1.5 for every 100,000 people)
An average of 3.1 million vaccinations per day (per Bloomberg)
This is the fourth week in a row of case increases in the U.S. While this week’s jump is lower (we went from 57,000 new daily cases two weeks ago, to 63,000 last week, to 64,000 this week), the level where we’ve landed is still reason for concern. Our case numbers now are comparable to last July, when the summer surge was threatening hospital systems in the South and West.
Five states now account for almost half of our new cases, Dr. Katelyn Jetelina notes in her newsletter Your Local Epidemiologist. Those states are Michigan, New York, New Jersey, Florida, and Pennsylvania. “These states also happen to have some of the highest B.1.1.7 levels reported by the CDC,” Jetelina writes. “Is this a coincidence? Probably not.”
CDC data on coronavirus variants are reported with a significant time lag, as I discussed in detail last week. Still, the most recent update of the agency’s Variant Proportions page (now reflecting data as of March 13) tells us that B.1.1.7 accounts for at least 39% of cases in Michigan, 35% of cases in Tennessee, and 35% of cases in Florida. B.1.1.7 accounts for at least 20% of cases in five other states; it is now the most common variant in the country, CDC Director Dr. Rochelle Walensky said in a press briefing last week.
Vaccinations are of course continuing—more than one in three Americans has now had a shot, and one in five is fully vaccinated—but we can’t get complacent. This week’s seven-day average is barely above last week’s (both about 3 million), and as more states open up their eligibility to all adults, we’re seeing access issues and vaccine hesitancy prevent all shots from getting used.
Also, as Dr. Eric Topol pointed out on Twitter, the federal government is refusing to send surplus vaccine supply to Michigan despite pleas from Michigan leaders and public health experts to support this hotspot state in its time of crisis.
34,600 new COVID-19 patients admitted to hospitals (10.6 for every 100,000 people)
6,200 new COVID-19 deaths (1.9 for every 100,000 people)
An average of 3 million vaccinations per day (per Bloomberg)
“I’m gonna pause here, I’m gonna lose the script, and I’m gonna reflect on the recurring feeling I have of impending doom.”
You’ve probably seen headlines with this quotation, something CDC Director Dr. Rochelle Walensky said at the White House COVID-19 briefing on Monday before launching into an impassioned plea to “just hold on a little while longer.” Still, I recommend watching the full video, if you haven’t yet. I watched it live, and was struck by Dr. Walensky’s drive to avoid any more people sent to the hospital with COVID-19, any more unnecessary deaths.
The pandemic’s current state puts public health leaders like Dr. Walensky in a challenging position. New cases continue to rise, with states like Michigan, New York, New Jersey, and other parts of the northeast seeing more concerning spikes. While a 60,000-cases-per-day average may seem small compared to the numbers we saw this winter, it’s comparable to the summer surge that devastated much of the country. And our still-improving genomic surveillance system is finding more and more cases caused by variants.
Yet at the same time, millions of people are getting vaccinated—a new record was set just yesterday, with 4 million doses reported in one day. The weekly average is now at 3 million new doses each day. Not four days after that briefing when Dr. Walensky warned of impending doom, the CDC put out a travel guidance that many took as a license to book post-vaccination plane tickets. (It’s not, though by the way some have described it, you could be forgiven for thinking that way.)
Those who’ve been vaccinated may find it hard to believe another surge is coming. But we can’t let down our guard yet! About three in ten Americans have received at least one vaccine dose—that’s far from herd immunity.
33,000 new COVID-19 patients admitted to hospitals (10.1 for every 100,000 people)
6,600 new COVID-19 deaths (2.0 for every 100,000 people)
An average of 2.6 million vaccinations per day (per Bloomberg)
After several weeks of declines, our national count of new cases has started creeping up: the current 7-day average is 57,000, after 53,000 last week and 55,000 the week before. Michigan continues to see concerning numbers, as do New York, New Jersey, Florida, Texas, and California—all states with higher counts of reported variant cases.
Last week, I described America’s present situation as a race between vaccines and variants. As of Thursday, we have 8,300 reported B.1.1.7 cases—up from about 5,000 last week, and likely still a significant undercount. The variant-driven surge that some experts warned may come in late March may now be starting.
Still, the pace of vaccinations continues to pick up. We hit more vaccination records this week: 3.4 million doses were reported on Friday, and 3.5 million were reported yesterday. Over 50 million Americans have now been fully vaccinated, according to White House COVID-19 Data Director Cyrus Shahpar.
President Biden set a new goal for his first 100 days in office: 200 million vaccinations, double the 100-million goal that we hit last week. At the nation’s current pace (about 2.6 million doses administered each day), we are well on track to meet that milestone.
43 states have announced that they’ll open up vaccine eligibility to all adults on or before Biden’s May 1 deadline, as of Friday—though opening up wider eligibility can sometimes mean that vaccine access for vulnerable populations becomes even more challenging. A recent data release from the CDC makes it easier for us to analyze vaccinations at a more local level; more on that later in the issue.
32,900 new COVID-19 patients admitted to hospitals (10 for every 100,000 people)
7,200 new COVID-19 deaths (2.2 for every 100,000 people)
An average of 2.3 million vaccinations per day (per Bloomberg)
Three months into his presidency, Joe Biden has already met one of his biggest goals: 100 million vaccinations in 100 days. This includes 79 million people who have received at least one dose, and 43 million who are now fully vaccinated. Two-thirds of Americans age 65 and older have received at least their first dose.
Our current phase of the pandemic may be described as a race between vaccinations and the spread of variants. Right now, it’s not clear who’s winning. Despite our current vaccination pace, the U.S. reported only 10,000 fewer new cases this week than in the week prior—and rates in some states are rising.
Michigan is one particular area of concern: COVID Tracking Project data watchers devoted an analysis post to the state this week, writing, “the Detroit area now ranks fourth for percent change in COVID-19 hospital admissions from previous week—and first in increasing cases and test positivity.” Hospitalization rates in New York and New Jersey are also in a plateau.
As genomic surveillance in the U.S. improves, the picture we can paint of our variant prevalence becomes increasingly concerning. But that picture is still fuzzy—more on that later in this issue.
The Johnson & Johnson vaccine has fully dropped—not just in the arms of millions of Americans, but also on state vaccine dashboards. When I updated the CDD’s vaccination data annotations yesterday, I noticed that several states had switched from labeling their shots as “first dose” and “second dose” to labeling them as “first dose” and “completed series,” or something similar. Since the J&J vaccine is only one dose, a single shot from this manufacturer could launch you right into that “completed series” category.
However you label them, the U.S. is now vaccinating about 2.5 million people per day. One in four adults has received at least their first shot. And we crossed the 100-million dose mark on Friday, far earlier than President Biden’s 100-day goal. Meanwhile, cases, deaths, and hospitalizations continue to decline.
These numbers have inspired some guarded optimism, at least on the part of the federal government. On Thursday, Biden announced that he’s directing all states, tribes, and territories to make all adults eligible for vaccination by May 1. Alaska became the first state to reach that milestone this week.
Of course, there’s a big difference between making people eligible and actually getting shots in arms. But vaccine hesitancy is reportedly dropping, as Americans see their family members and friends safely get inoculated. One new poll from NPR/PBS NewsHour/Marist shows that 73% of Black people and 70% of white people said they’re either planning to get vaccinated or have received a shot already.
Variants also continue to be a concern (see Sarah’s section later in this issue). But it’s hard to argue with the fact that millions of our family members, friends, and neighbors are now protected from COVID-19, with more people getting vaccinated every day.
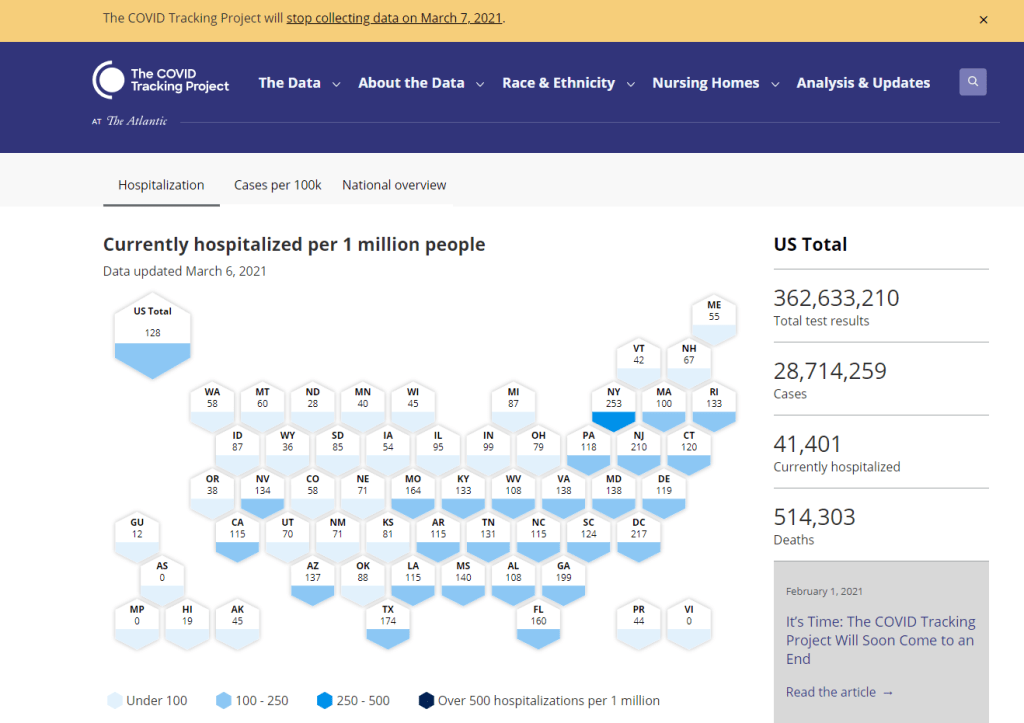
The COVID Tracking Project’s homepage on March 7, 2021.
A couple of hours after I send today’s newsletter, I will do my final shift of data entry work on the COVID Tracking Project’s Testing and Outcomes dataset. Then, later in the evening, I will do my final shift on the COVID Racial Data Tracker. And then I will probably spend another hour or two bothering my fellow volunteers on Slack because I don’t want it to be over quite yet.
In case you aren’t fully embroiled in the COVID-19 data world, here’s some context. Last spring, a few journalists and other data-watchers realized that the U.S.’s national public health agencies weren’t doing a very good job of reporting COVID-19 tests. Alexis Madrigal and Rob Meyer (of The Atlantic) compiled their own count from state public health agencies. Jeff Hammerbacher (of Related Sciences) had independently compiled his own count, also from state agencies. And, as the About page on the website goes: “The two efforts came together March 7 and made a call for volunteers, our managing editor, Erin Kissane joined up, and the COVID Tracking Project was born.”
Now, one year after that formal beginning of the Project’s test-counting efforts, the team is ending data collection work. Erin Kissane and Alexis Madrigal provided some background for that decision in a blog published on February 1. I recommend reading the piece in full, if you haven’t yet, but the TL;DR is that a. this data collection work should be done by federal public health agencies, not a motley group of researchers and volunteers, and b. the federal agencies have greatly improved their own data collection and reporting efforts in recent months.
The Project’s core Testing and Outcomes dataset formally ceases updates today, along with the Racial Data Tracker and Long-Term Care Data Tracker. But the Project has provided a lot of documentation and guidance for data users who want to keep tracking the pandemic, along with analysis that will be useful for months (if not years) to come. The rest of this post shares the highlights from those resources, along with a few personal reflections.
Where to find your COVID-19 data now
So, you’re a journalist who’s relied on the COVID Tracking Project’s tweets to illuminate pandemic trends for the past year. Or you’re a researcher who’s linked the Project’s API to your own tracking dashboard. Or you’re a concerned reader who’s checked up on your state regularly, watching the time series charts and annotations. Where do you go for your data now?
Through a series of analysis posts and webinars over the past few weeks, Project staff have made their recommendation clear: go to the federal government. In recent months, the CDC and the HHS have built up data collection practices and public dashboards that make these data easier to work with.
Here are a few highlights:
For daily updates at all geographic levels, use the Community Profile Reports. After months of private updates sent from the White House COVID-19 task force to governors, the data behind these in-depth reports were made public in December. The PDF reports themselves were made public in January, after Biden took office. The reports include detailed data on cases, deaths, tests, and hospitalizations for states, counties, and metropolitan areas. I’ve written more about the reports here.
For weekly updates, use the COVID Data Tracker Weekly Review. As I mentioned in a National Numbers post two weeks ago: the CDC is doing weekly updates now! These updates include reports on the national trends for cases, deaths, hospitalizations, vaccinations, and SARS-CoV-2 variants. They may be drier than CTP blog posts, but they’re full of data. You can also sign up to receive the updates as a newsletter, sent every Friday afternoon—the CDC has really moved into the 21st-century media landscape.
For state-specific updates, use the State Profile Reports. Similarly to the Community Profile Reports, these documents provide many major state-level metrics in one place, along with local data and color-coding to show areas of concern. They’re released weekly, and can be downloaded either state-by-state or in one massive federal doc.
For case and deaths data, use the CDC’s state-by-state dataset. This dataset compiles figures reported by states, territories, and other jurisdictions. It matches up pretty closely to CTP’s data, though there are some differences due to definitions that don’t match and other discrepancies; here’s an analysis post on cases, and here’s a post on deaths. You can also see these data in the CDC’s COVID Data Tracker and reports.
For testing data, use the HHS PCR testing time series. This dataset includes results of PCR tests from over 1,000 labs, hospitals, and other testing locations. Unlike CTP, the federal government can mandate how states report their tests, so this dataset is standardized in a way that the Project’s couldn’t be. Kara Schechtman has written more about where federal testing data come from and how to use them here. The HHS isn’t (yet) publishing comprehensive data on antibody or antigen tests, as these test types are even more difficult to standardize.
For hospitalization data, use the HHS hospitalization dataset. I’ve reported extensively on this dataset, as has CTP. After a rocky start in the summer, the HHS has shown that it can compile a lot of data points from a lot of hospitals, get them standardized, and make them public. HHS data for current hospitalizations are “usually within a few percentage points” of corresponding data reported by states themselves, says a recent CTP post on the subject. Find the state-level time series here and the facility-level dataset here.
For long-term care data, use the CMS nursing home dataset. The Centers for Medicare & Medicaid Services are responsible for overseeing all federally-funded nursing homes. Since last spring, this responsibility has included tracking COVID-19 in those nursing homes—including cases and deaths among residents and staff, along with equipment, testing availability, and other information. The CMS dataset accounts for fewer overall cases than CTP’s long-term care dataset because nursing homes only account for one type of long-term care facility. But, like any federal dataset, it’s more standardized and more detailed. Here’s an analysis post with more info.
For race and ethnicity data, there are a couple of options. The CDC’s COVID Data Tracker includes national figures on total cases and deaths by race and ethnicity—at least, for the 52% of cases and 74% of cases where demographic information is available. More detailed information (such as state-by-state data) is available on deaths by race and ethnicity via the CDC’s National Center for Health Statistics. A blog post with more information on substitutes for the COVID Racial Data Tracker is forthcoming.
The COVID Tracking Project’s federal data webinars concluded this past Thursday with a session on race and ethnicity and long-term care facilities. Slides and recordings from these sessions haven’t been publicly posted yet, but you can look out for them on the Project’s website. Also, for the more technical data nerds among you: COVID Act Now has written up a Covid Tracking Migration Guide for users of the CTP API, and the Johns Hopkins Coronavirus Resource Center announced that it will begin providing state testing data.
Analysis and update posts to re-read
It took a lot of self control for me to not just link every single CTP article in here. But I’ll give you just a few of my favorites, listed in no particular order.
Test Positivity in the US Is a Mess (Oct. 8): This piece was one of my “20 best COVID-19 data stories of 2020.” To repeat what I wrote then: “Out of the many informative blog posts produced by the COVID Tracking Project since last spring, this is the one I’ve shared most widely. Project Lead Erin Kissane and Science Communication Lead Jessica Malaty Rivera clearly explain how COVID-19 test positivity—what should be a simple metric, the share of tests conducted in a given region that return a positive result—can be calculated in several different ways.”
Daily COVID-19 Data Is About to Get Weird (Nov. 24): I probably linked to this piece in newsletters once a week from the end of November until early January. Erin Kissane clearly explains the patterns around holiday data and how to interpret them—an explanation that continues to prove useful, as we saw a kind-of holiday reporting pattern take place after winter storms hit the South.
The “Good” Metric Is Pretty Bad: Why It’s Hard to Count the People Who Have Recovered from COVID-19 (Jan. 13): The “recovered” number that many states publish is even more inconsistent than other metrics. Some states use hospital discharges to calculate this number, while others simply re-categorize cases as “recovered” if a worse outcome hasn’t occurred in a designated timeframe. All definitions exclude long haulers, who face symptoms months after getting sick.
Counting COVID-19 Tests: How States Do It, How We Do It, and What’s Changing (Aug. 13): You know how the federal testing dataset is more standardized than what CTP can do? This is because there are three (3!) different units for COVID-19 test reporting, and every state does something slightly different. Kara Schechtman gets into all of the weeds here.
What We’ve Learned About the HHS’s Hospitalization Data (Dec. 4): I love this post because it says, in no uncertain terms, look, we did all this analysis, and we’re telling you, you can trust the HHS hospitalization data now. It’s an early indication of CTP recognizing increased transparency from the federal agency, weeks before the facility-level dataset would be released.
Florida’s COVID-19 Data: What We Know, What’s Wrong, and What’s Missing (July 8): This one is essentially a feature-length, detailed, clearly written callout post for the state of Florida. Many of the issues described in this post have now been resolved, but one of the most important developments occurred just days after it was published: Florida started publishing a count of current COVID-19 patients.
The State of State Antigen Test Reporting (Oct. 19): I co-wrote this one with Quang Nguyen. The post explains what we know about antigen tests, those useful-for-surveillance-but-pesky-for-data rapid tests, and calls attention to potential underreporting.
I joined the COVID Tracking Project as a volunteer in early April, 2020. I actually searched back through my calendar to find exactly when I did a data entry training—it was Thursday, April 2.
At the time, I wanted to better understand the numbers I kept seeing, in tweets and news stories and Cuomo’s powerpoints. But more than that, I wanted to do something. I sat, cooped up in my little Brooklyn apartment, listening to the endless sirens screaming by. I ran to the park and wanted to yell at every person I saw walking without a mask. I donated to mutual aid funds, but even that felt empty, almost impersonal.
The Project put out a call for volunteers, and I thought, okay, data entry. I can do data entry. I can do spreadsheets. I know spreadsheets.
Well, I know spreadsheets much better now, almost a year later. I know how to navigate through a state dashboard, find all its data definitions, and puzzle through its update time. But beyond all the technical stuff, volunteering for CTP gave me a sense of purpose and community. No matter how tired or angry the world made me feel, I knew that, for a few hours a week, I’d be contributing to something bigger than myself. My work played a small part in making data accessible, bringing information to a wider audience.
Much ink has been spilled about how mutual aid groups have helped neighbors find each other, especially during that period of spring 2020 when everything seemed so bleak. I have seen the Project as another form of mutual aid. I’ve given countless hours to CTP over the past year in the form of data entry shifts, analysis, writing, and custom emojis—but those hours have also been given back to me, in everything from Tableau tricks to playlist recommendations. My fellow volunteers, the vast majority of whom I’ve never met in person, are my neighbors. We live in the same spreadsheets and Slack channels; we see the world in the same way.
I am beginning to understand how journalism, or something like journalism, can work when it is led by a community. By community, I mean: a group of people united in one mission. And by mission, I mean: bringing information to the public. Accessibility and accountability are common buzzwords right now, I think, but CTP approaches the truth of these principles, whether it’s by doing shifts through Christmas or by writing out detailed process notes on how to navigate Wyoming’s dashboard(s).
I know why the Project’s data collection efforts are ending. The federal government can compile—and is compiling—data on a far more detailed and standardized level than a group of researchers and volunteers ever could. But I am grateful to have been part of this beautiful thing, so much bigger than myself. It is the bar by which I will measure every organization I join from here on out.
If you’ve ever read the About page on the COVID-19 Data Dispatch website, you may have noticed a disclaimer stating that, while I volunteer for CTP, this publication is an entirely separate project that reflects my own reporting and explanations. This is true; I’m careful to keep this project distinct. But of course, the COVID-19 Data Dispatch has been influenced by what I’ve learned volunteering for CTP. I have attempted to carry forward those values, accessibility and accountability. I’ll keep carrying them forward. Feedback is always welcome.
To all my neighbors in the CTP Slack: thank you. And to everyone who has followed the data: there is work still to be done.
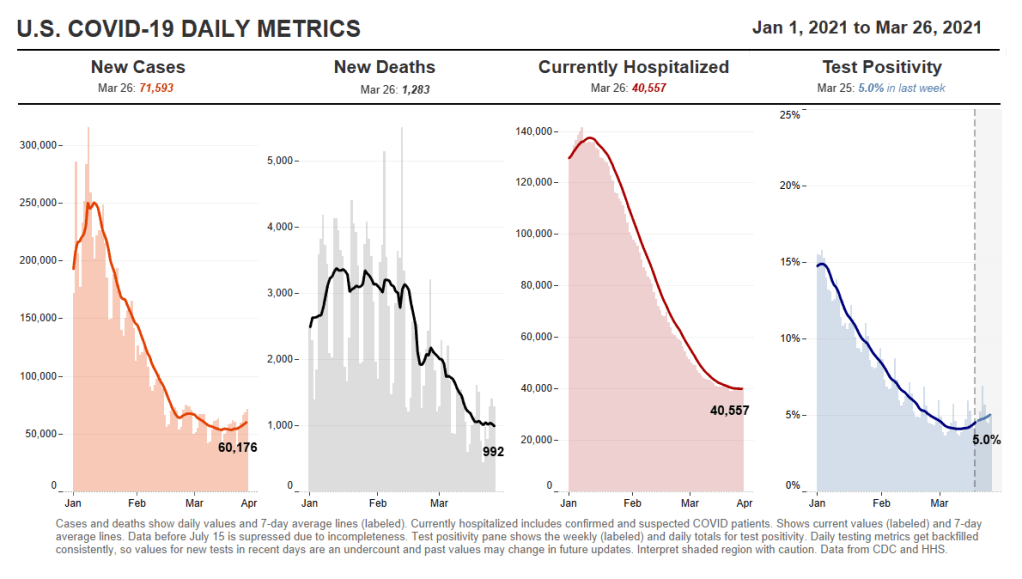
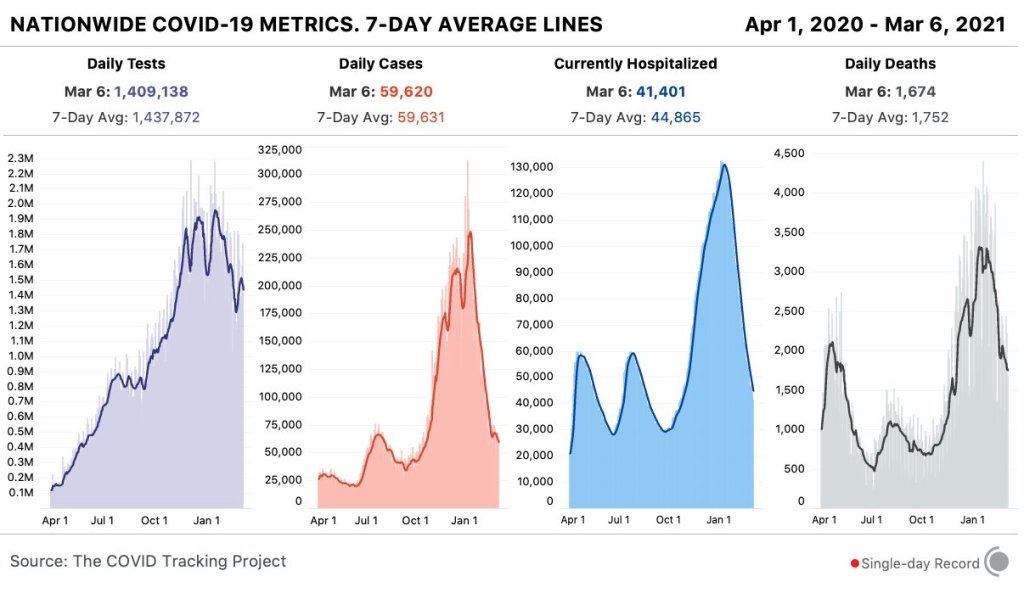
In the past week (February 28 through March 6), the U.S. reported about 417,000 new cases, according to the COVID Tracking Project. This amounts to:
An average of 60,000 new cases each day—comparable to the seven-day average for daily cases in early August
127 total new cases for every 100,000 Americans
1 in 786 Americans getting diagnosed with COVID-19 in the past week
Nationwide COVID-19 metrics published in the COVID Tracking Project’s daily update on March 6. This will be the final week we use Project data for these updates.
Last week, America also saw:
41,400 people now hospitalized with COVID-19 (13 for every 100,000 people)
12,100 new COVID-19 deaths (3.7 for every 100,000 people)
An average of 2.2 million vaccinations per day (per Bloomberg)
The U.S. recorded fewer new daily cases this week than last week, finally dropping to a level lower than the summer surge. We saw fewer hospitalized COVID-19 patients and deaths from the disease this week as well. But the possibility of a plateau—or even a variant-driven fourth surge—is worrying some experts. CDC Director Dr. Rochelle Walensky has cited this concern in press briefings over the past week, encouraging that Americans “double down on prevention measures.”
Dr. Walensky’s assertion is backed up by a new CDC report that links mask mandates and dining restrictions to reduced community spread. (We knew this already, of course, but it’s always nice to have a CDC report you can cite.)
Variants, meanwhile, continue to spread. We’re up to 2,600 reported B.1.1.7 cases, though this and other variant counts are likely significantly underreported. Nature’s Ewen Callaway calls attention to variant reporting issues in a recent story: despite national efforts to ramp up sequencing, the practice is still heavily decentralized in the U.S., with heavily-resourced states like New York and California sequencing thousands of genomes while other states collect far fewer. And “homegrown” variants of concern, such as the variant reportedly spreading through New York City, don’t even appear on the CDC’s dashboard yet.
But vaccinations give us one place to be optimistic. More than two million Americans are now getting a dose each day, per Bloomberg, with the first Johnson & Johnson shots landing on the market this week. After the announcement of a cross-pharma partnership (Merck giving J&J a manufacturing boost), President Biden said that the U.S. will have enough COVID-19 vaccine doses for every adult by the end of May. How quickly—and how equitably—those doses get administered will be another battle.
Finally, a sad acknowledgment: with the COVID Tracking Project concluding data collection today, I will be switching my source for these updates starting next week. I plan to use CDC and HHS data, relying heavily on the CDC’s new COVID Data Tracker Weekly Reviews. More on filling the CTP-shaped hole in your data in the next section.