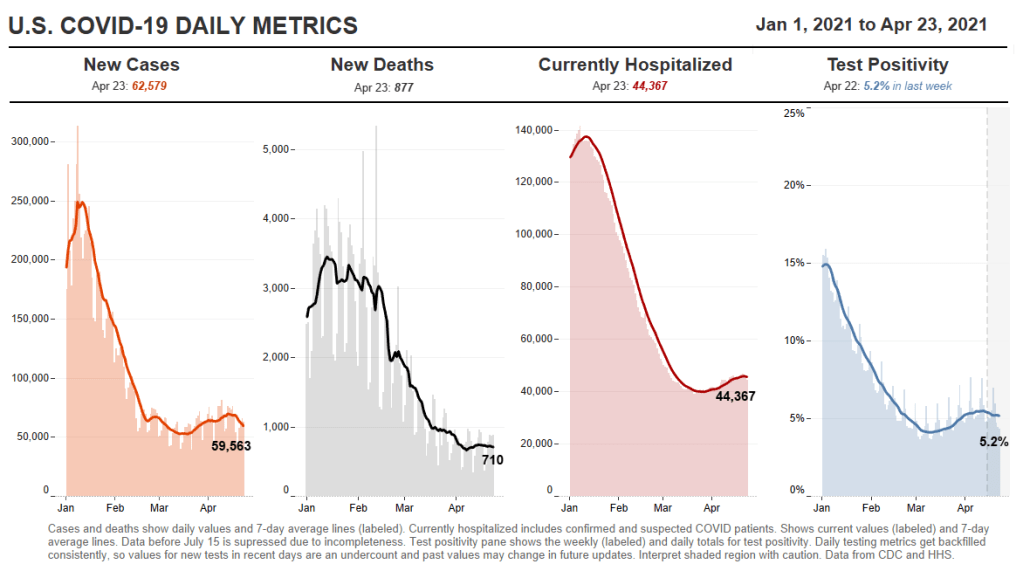
In the past week (April 17 through 23), the U.S. reported about 438,000 new cases, according to the CDC. This amounts to:
- An average of 63,000 new cases each day
- 133 total new cases for every 100,000 Americans
- 1 in 749 Americans getting diagnosed with COVID-19 in the past week
- 10% fewer new cases than last week (April 10-16)

Last week, America also saw:
- 39,400 new COVID-19 patients admitted to hospitals (12 for every 100,000 people)
- 4,800 new COVID-19 deaths (1.5 for every 100,000 people)
- 44.7% of new cases in the country now B.1.1.7-caused (as of March 27)
- An average of 2.9 million vaccinations per day (per Bloomberg)
After several weeks of rising cases, the federal numbers dropped this week by about 10%. Michigan’s case rates fell below 500 new cases per 100,000 people and its positivity rate is trending downward, leading public health experts to hope that this state’s worrying outbreak may have peaked.
As always, though, we can’t get too excited about a single-week trend—and 60,000 new cases each day is still a concerning level at which to plateau. Over 5,000 Americans are being admitted to hospitals with COVID-19 each day, and more of these patients are now younger as this age group is the last to become eligible for vaccination. COVID-19 is becoming more of a “young person’s disease,” as Sarah Zhang wrote in The Atlantic last week.
Variants are still a concern, too—but I have no updates on variant numbers because the CDC has not updated its Variant Proportions data since our last issue. According to revised figures (still as of March 27), B.1.1.7 is causing about 45% of cases in the U.S., and the California (B.1.427/B.1.429) and New York City (B.1.526) variants are causing about 10% of cases each. Good news on the NYC variant, though: recent studies have suggested that the Pfizer and Moderna vaccines will effectively protect New Yorkers against this variant, per the New York Times.
While the U.S. met President Biden’s 200 million dose goal last week, the pace of vaccinations is now slowing. We’re seeing about 2.9 million doses administered each day, compared to over 3 million a week ago. While this may be due in part to the Johnson & Johnson pause (more on that later), a bigger culprit is likely that vaccine supply is starting to eclipse demand. In other words, everyone who was desperate to get vaccinated has now gotten their shot, leaving those who are less confident or may have a harder time accessing an appointment. A new Kaiser Family Foundation report suggests that the U.S. is now vaccinating people in the “wait and see” group, and likely will have reached everyone in that group within a couple more weeks.
It’s heartening to see case numbers drop, but we aren’t out of the woods yet. It will take coordinated communication and lifting of access barriers to reach a “vaccinated summer” here in the U.S… to say nothing of the rest of the world.

Leave a comment