Tag: May data

  • National numbers, May 28

    National numbers, May 28

    The CDC is now updating its variant estimates every two weeks.

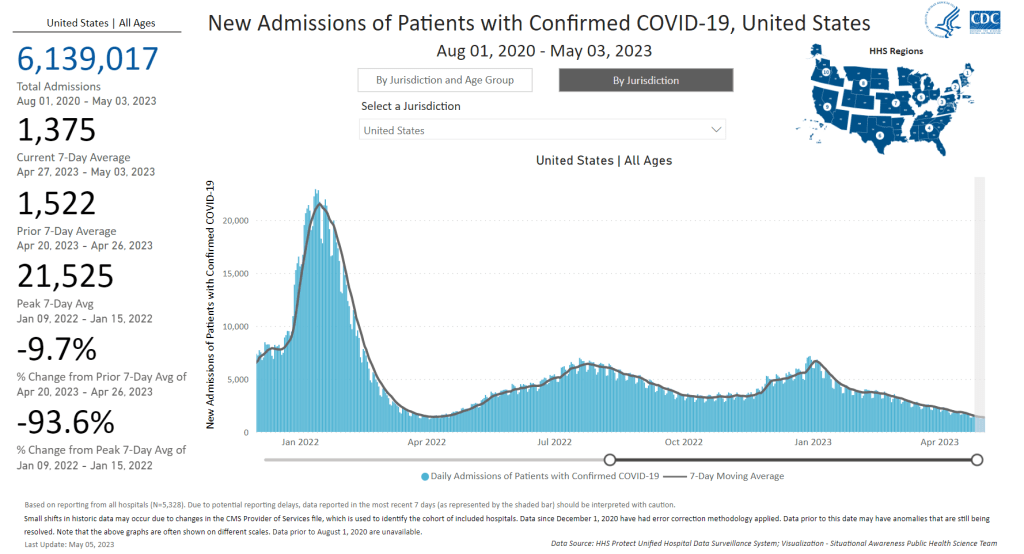
    In the past week (May 14 through 20), the U.S. reported about 8,300 new COVID-19 patients admitted to hospitals, according to the CDC. This amounts to:

    • An average of 1,200 new admissions each day
    • 2.5 total admissions for every 100,000 Americans
    • 11% fewer new admissions than last week (May 7-13)

    Additionally, the U.S. reported:

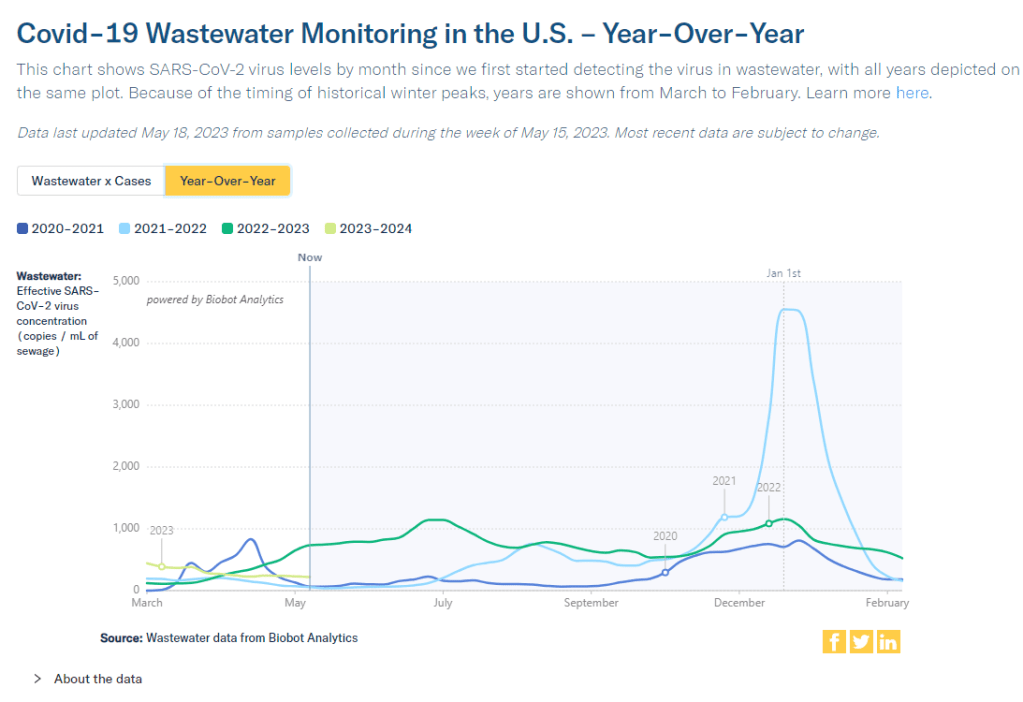
    • A 16% lower concentration of SARS-CoV-2 in wastewater than last week (as of May 24, per Biobot’s dashboard)
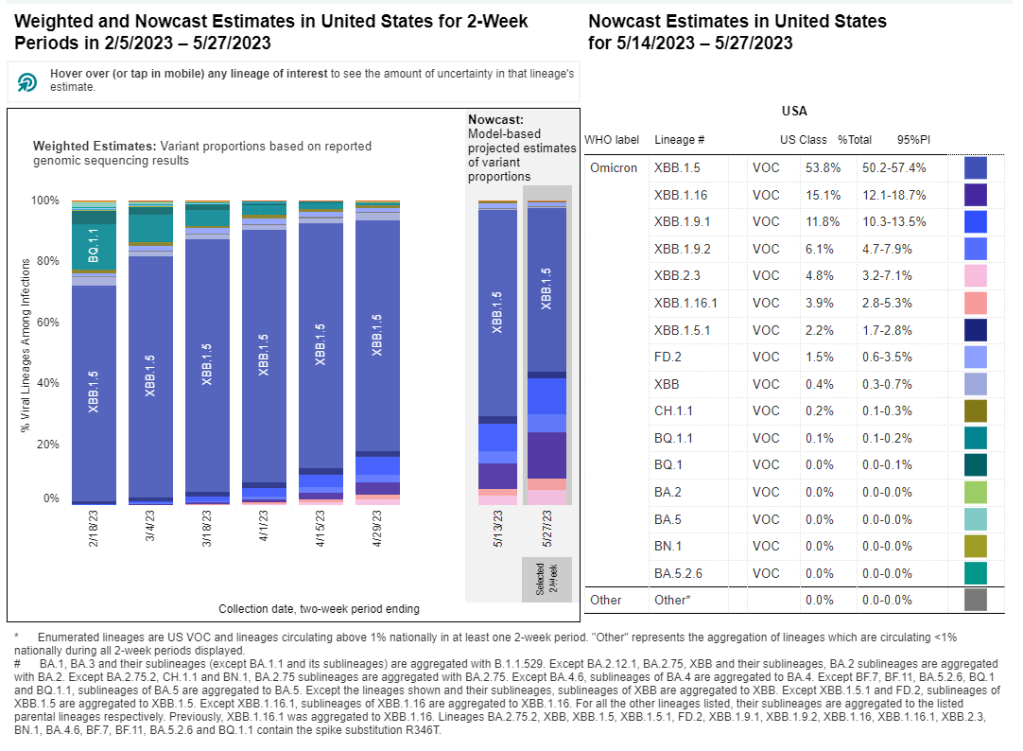
    • 54% of new cases are caused by Omicron XBB.1.5; 19% by XBB.1.16; 18% by XBB.1.9 (as of May 27)

    The COVID-19 plateau continues, with hospital admissions and viral levels in wastewater (the two main metrics I’m looking at these days) both trending slightly down at the national level. Newer Omicron variants are still on the rise, but don’t seem to be impacting transmission much yet.

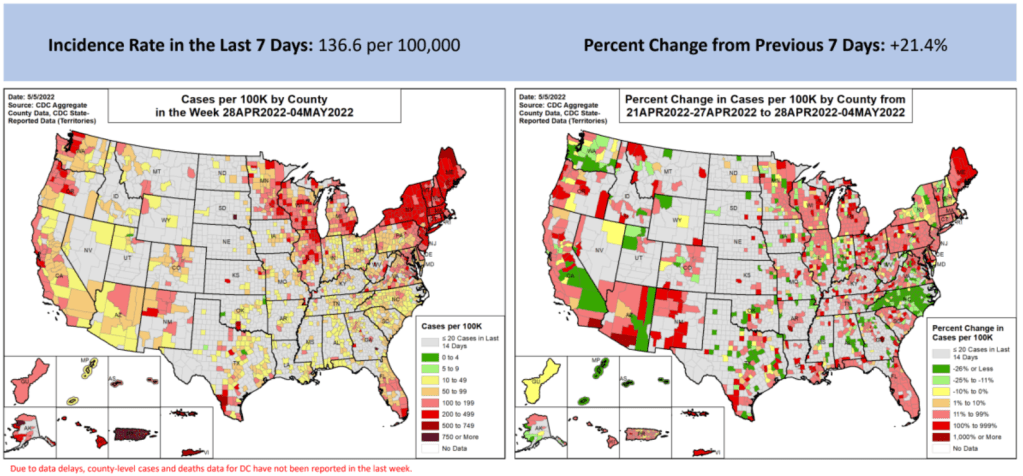
    Hospitalizations continue to trend slightly down across the board, though hospitals are still reporting more than 1,000 new COVID-19 patients each day. The vast majority of U.S. counties have low hospitalization levels, according to the CDC, with just 14 counties in the medium or high categories.

    Coronavirus levels in wastewater are following a similar pattern: trending down very slightly, continuing the middling plateau of the last couple of months. All four major regions are still in this holding pattern, according to Biobot’s data.

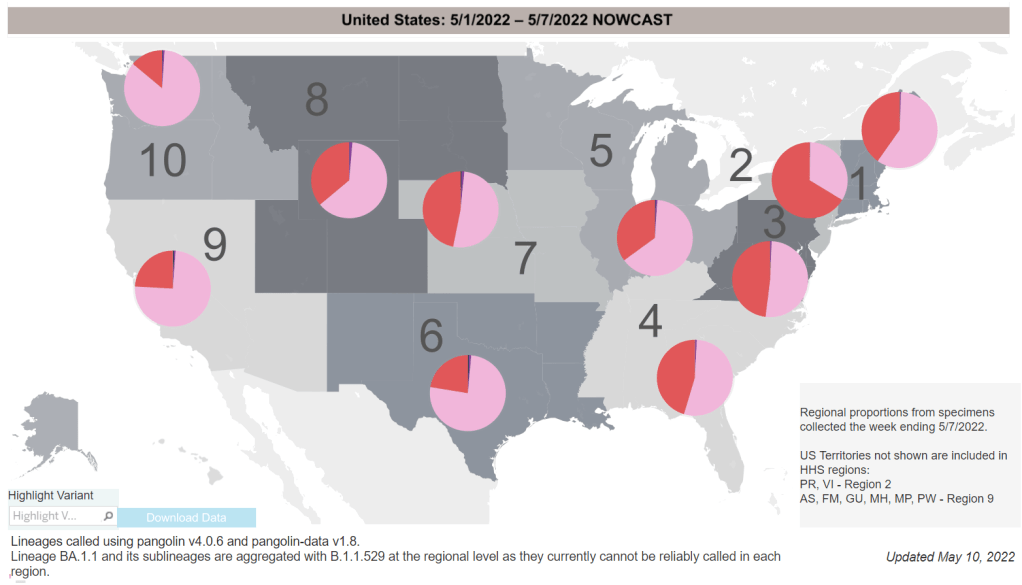
    We have new variant data this week, as the CDC is now on a biweekly schedule for updates. XBB.1.5 caused just over half of new cases in the U.S. in the two weeks ending May 27, as it slowly gets outcompeted by newer versions of Omicron. XBB.1.16 and XBB.1.9 continue to rise, causing 19% and 18% of hew cases respectively.

    XBB.1.16 is most prevalent on the West Coast, the Northeast, and the Gulf Coast states, while XBB.1.9 is most prevalent in the Midwest, according to the CDC—though these estimates are becoming less reliable over time, since so few COVID-19 samples are sequenced.

    The CDC has also recently added national and regional COVID-19 test positivity data back to its dashboard, representing tests conducted by labs in the CDC’s National Respiratory and Enteric Virus Surveillance System.

    Nationally, test positivity is trending down, at just under 5% of COVID-19 tests (in this lab network) returning positive results in the most recent week of data. Test positivity is trending up slightly in the Northeast and New York/New Jersey regions; I’ll be following to see if this continues in the coming weeks.

    Finally, a bit of good news: excess deaths in the U.S. have returned to baseline in the last couple of months. While hundreds are still dying from COVID-19 every day, the excess death trend suggests that the disease is currently not causing a significant ripple effect on overall mortality the way that it did in earlier stages of the pandemic. (Of course, this could change with a new surge.)

  • National numbers, May 21

    National numbers, May 21

    According to wastewater data from Biobot, COVID-19 spread right now is lower than at this time last year, but higher than the prior two years.

    In the past week (May 7 through 13), the U.S. reported about 9,200 new COVID-19 patients admitted to hospitals, according to the CDC. This amounts to:

    • An average of 1,300 new admissions each day
    • 2.8 total admissions for every 100,000 Americans
    • 5% fewer new admissions than last week (April 30-May 6)

    Additionally, the U.S. reported:

    • A 4% lower concentration of SARS-CoV-2 in wastewater than last week (as of May 17, per Biobot’s dashboard)
    • 64% of new cases are caused by Omicron XBB.1.5; 13% by XBB.1.9; 14% by XBB.1.16 (as of May 13)
    • An average of 75,000 vaccinations per day

    Nationwide, COVID-19 spread in the U.S. continues to be in a somewhat-middling plateau: lower than the massive amount of Omicron transmission we all got used to throughout late 2022, but still higher than the lulls between outbreaks we saw in prior years.

    Biobot’s national wastewater surveillance offers a helpful visual for this comparison. As of May 20, the company calculates a national average of 221 viral copies per milliliter of sewage (a common unit for quantifying SARS-CoV-2 in wastewater), based on hundreds of sewage testing sites in its network.

    In late May of last year, when early Omicron offshoots were spreading widely, this value was several times higher: 736 viral copies per milliliter. But around the same time in 2021 (when millions of Americans were getting their first vaccine shots) or 2020 (when the very first big surge had ended), wastewater concentrations were under 100 viral copies per milliliter.

    It’s also important to note that wastewater concentrations have been fairly level for a couple of months now, both nationally and for all four major regions. High immunity across the population and a lack of divergent new variants have kept us from seeing a new surge since the 2022 winter holidays; but without widespread safety measures, I suspect we’re unlikely to see a drop in transmission below the current baseline.

    Hospital admissions, now the CDC’s primary metric for tracking this disease, show a similar picture to the wastewater data. Numbers are low and ticking ever-so-slightly downward, but they’re not zero: about 1,300 people were admitted to hospitals with COVID-19 each day in the week ending May 13.

    Deaths with COVID-19 also remain at low yet significant numbers. While the CDC reports only 281 deaths in the last week, this information is now presented with a greater delay than during the federal public health emergency, as the agency had to switch from death reports received directly from states to death certificate data. For the week ending May 6, the CDC revised its number up from about 300 to 622 COVID-19 deaths.

    There are no changes to variant estimates this week, as the CDC is now updating that data every other week rather than weekly. XBB.1.5 remains the dominant variant, with XBB.1.16 and XBB.1.19 slowly gaining ground.

    Overall, it’s getting harder to identify detailed COVID-19 trends, but a lot of data still do remain available. I’ll keep providing updates as best I can.

  • National numbers, May 14

    National numbers, May 14

    The CDC and its partners are sequencing far fewer coronavirus samples than they have at prior periods of the pandemic, making it harder to spot new variants of concern.

    In the past week (April 30 through May 6), the U.S. reported about 9,500 new COVID-19 patients admitted to hospitals, according to the CDC. This amounts to:

    • An average of 1,400 new admissions each day
    • 2.9 total admissions for every 100,000 Americans
    • 7% fewer new admissions than last week (April 22-29)

    Additionally, the U.S. reported:

    • A 14% lower concentration of SARS-CoV-2 in wastewater than last week (as of May 10, per Biobot’s dashboard)
    • 64% of new cases are caused by Omicron XBB.1.5; 13% by XBB.1.9; 14% by XBB.1.16 (as of May 13)
    • An average of 70,000 vaccinations per day

    COVID-19 spread continues to trend down in the U.S., though our data for tracking this disease is now worse than ever thanks to the end of the federal public health emergency. If newer Omicron variants cause a surge this summer, those increases will be hard to spot.

    As a result of the PHE’s conclusion this week, the CDC is no longer collecting national case counts or testing data. Instead, the agency now recommends using hospitalization data to monitor how hard COVID-19 is hitting your community—even though this metric typically lags behind actual infection patterns—while variant data and wastewater surveillance may provide warnings about new surges.

    My national updates will take a similar approach. This week, hospital admissions continue their national plateau, with a decrease of about 7% from the week ending April 29 to the week ending May 6. The CDC’s national map show that admissions are low across the country, with 99% of counties reporting fewer than 10 new admissions per 100,000 residents.

    Wastewater surveillance also suggests that, while there’s still a lot of COVID-19 in the U.S., disease spread is still on a plateau or slight decline in most of the country. Biobot’s data show a minor national downturn in recent weeks; trends are similar across the four major regions, though the decline is a bit steeper on the West Coast.

    The variant picture also hasn’t changed much: XBB.1.5 caused about two-thirds of new cases in the last two weeks, according to the CDC’s estimates. XBB.1.6 caused about 14% and XBB.1.9 caused 13%; these newer versions of Omicron are gaining ground, but fairly slowly. Regionally, XBB.1.6 is most prevalent in the Northeast and on the West Coast, while XBB.1.9 is most prevalent in the Midwest.

    It’s worth noting, though, that the CDC has switched its variant reporting from weekly to every other week, as fewer patient specimens are going through sequencing for variant identification. The agency and its surveillance partners are sequencing around 5,000 samples every week, compared to over 80,000 a week at the height of the first Omicron surge.

    Limited sequencing efforts will make it harder for the CDC to quickly identify (and respond to) new variants of concern. The same challenge is happening around the world, as PCR tests become less broadly available. Sequencing coronavirus samples from wastewater may help, but that’s only happening in a small subset of sewage testing sites right now.

    One last bit of good news: vaccine administration numbers are up in the last couple of weeks, as seniors and other eligible high-risk people get their second bivalent boosters. About 70,000 people received vaccines each day this week, compared to around half that number a few weeks ago. If you’re eligible for a second booster, this is a good time to make an appointment!

  • National numbers, May 7

    National numbers, May 7

    New hospital admission for COVID-19 continue to drop, though they are at higher levels than we’ve seen in past lulls. Chart from the CDC dashboard.

    In the past week (April 27 through May 3), the U.S. officially reported about 77,000 new COVID-19 cases, according to the CDC. This amounts to:

    • An average of 11,000 new cases each day
    • 14% fewer new cases than last week (April 20-26)

    In the past week, the U.S. also reported about 10,000 new COVID-19 patients admitted to hospitals. This amounts to:

    • An average of 1,400 new admissions each day
    • 2.9 total admissions for every 100,000 Americans
    • 10% fewer new admissions than last week

    Additionally, the U.S. reported:

    • 1,100 new COVID-19 deaths (150 per day)
    • 67% of new cases are caused by Omicron XBB.1.5; 13% by XBB.1.9; 13% by XBB.1.16 (as of May 6)
    • An average of 60,000 vaccinations per day

    The national COVID-19 plateau persists. Cases, new hospitalizations, and wastewater surveillance all indicate slight declines (but persistent disease spread) across the country. New variants are on the rise, but have yet to noticeably change these trends.

    New COVID-19 cases declined by about 14% last week compared to the week prior, while hospital admissions declined by 10%. While the case numbers might seem low (just 11,000 reported each day), they are a drastic undercount of true infections, as we can see by comparing total new cases to new hospitalizations.

    This week, the CDC’s reported cases were about eight times the number of new hospital admissions reported by the agency. While this time last year, new cases were 30 times new hospital admissions. In other words, as case reporting gets less accurate, we are still tracking cases with severe sypmtoms (i.e. those that require hospitalization), but missing many of the mild or asymptomatic cases—that could still lead to detrimental outcomes, like Long COVID.

    Wastewater surveillance—which provides population-level data regardless of how many people are getting PCR tests or otherwise seeking healthcare—suggests that the U.S. has been at an overall plateau of COVID-19 spread, but a higher one than we’ve experienced in past lulls (such as in spring 2021, when people were receiving their first vaccine doses).

    Biobot’s national wastewater data shows fairly steady transmission for the last month. The company’s regional data shows a similar picture; the West Coast has slightly higher coronavirus levels than the other three major regions, but is on a decline. A few counties in California and other West states have seen increases recently, but it’s not a sustained pattern across the board.

    Newer versions of the Omicron variant are competing with XBB.1.5, but the transition is happening slowly. XBB.1.5 still caused about two-thirds of new cases in the U.S. last week, according to CDC estimates, while XBB.1.16 and XBB.1.9 both caused about 13% of new cases.

    It’s currently hard to say if the country will face a real surge from XBB.1.16 and XBB.1.9. XBB.1.16 has wreaked some havoc internationally, but it may be similar enough to the variants now circulating in the U.S. that it won’t make a huge dent. Or, if we do see an increase in cases, it could be more like a “mini-wave” of largely-mild infections than a surge that really strains the healthcare system.

    This “mini-wave” idea has been covered by a few news outlets recently, including Nature and the Atlantic. It’s certainly promising that the U.S. hasn’t had a real surge since the winter holidays, now almost six months ago—but we have to remember that any new cases, no matter how low the numbers are, can lead to potential severe symptoms and long-term illness. I, for one, am not letting up my guard on safety.

  • National numbers, May 22

    National numbers, May 22

    After appearing to peak in mid-April, COVID-19 case rates in New York City began going up again as BA.2.12.1 took over. Chart from NYC Health.

    In the past week (May 14 through 20), the U.S. reported about 710,000 new COVID-19 cases, according to the CDC. This amounts to:

    • An average of 101,000 new cases each day
    • 216 total new cases for every 100,000 Americans
    • 19% more new cases than last week (May 7-13)

    In the past week, the U.S. also reported about 23,000 new COVID-19 patients admitted to hospitals. This amounts to:

    • An average of 3,300 new admissions each day
    • 6.9 total admissions for every 100,000 Americans
    • 24% more new admissions than last week

    Additionally, the U.S. reported:

    • 2,000 new COVID-19 deaths (0.6 for every 100,000 people)
    • 98% of new cases are Omicron BA.2-caused; 48% BA.2.12.1-caused (as of May 14)
    • An average of 140,000 vaccinations per day (per Bloomberg)

    The Omicron BA.2 surge continues in the U.S., with a 19% increase in officially-reported COVID-19 cases in the past week to over 100,000 new cases a day. Of course, the official case numbers severely underestimate true infections, as PCR testing sites close and more people use rapid tests; actual case counts may be five or more times higher.

    New hospital admissions are also increasing: about 23,000 COVID-19 patients were admitted for care nationwide last week, up from 11,000 one month ago. While millions of Americans have some protection against severe disease from vaccination and/or prior Omicron infections, many are still susceptible. Hospitals are beginning to fill up again in almost every state, and as Ed Yong points out, the numbers don’t capture continued burnout among healthcare workers.

    BA.2.12.1, the most transmissible version of Omicron BA.2 now spreading in the U.S., accounted for almost half of new cases in the week ending May 14, according to CDC estimates. Northeast states remain hotspots: BA.2.12.1 caused about three in four new cases in New York and New Jersey last week.

    One thing I’ve been wondering, in recent weeks, is when we might see cases peak in the Northeast. In New York City, where I live, case trends seemed to turn downward in mid-April; but then after about a week, the numbers went up again — perhaps a consequence of BA.2.12.1 taking over from BA.2.

    COVID-19 trends from wastewater surveillance for the Northeast look similar to the case trends in NYC: a slow increase through March and April, followed by a potential plateau or further increases in May.

    And other regions are catching up, according to Biobot’s tracker: states in the Midwest and South continue to see their coronavirus levels increase as the Northeast stagnates. Official case data from the latest Community Profile Report suggest that states such as Nebraska, Montana, Missouri, Kansas, and Kentucky reported the sharpest increases over the last week.

    One piece of good news: new COVID-19 vaccinations rose slightly over the last week, going above 100,000 new shots administered daily for the first time in several months. Second booster shots in older adults and those with severe medical conditions are likely driving this increase, though, rather than shots for the previously unvaccinated.

    As local leaders like NYC mayor Eric Adams refuse to institute new mask mandates and the country overall seems apathetic to this COVID-19 surge, it’s unclear how long we’ll be dealing with these Omciron subvariants — or how much we’ll invite the virus to keep mutating.

  • National numbers, May 15

    National numbers, May 15

    Omicron BA.2.12.1 (shown here in red) is taking over from BA.2 (pink) in much of the country, with the Northeast in the lead. Chart via the CDC, data as of May 7.

    In the past week (May 7 through 13), the U.S. reported about 590,000 new COVID-19 cases, according to the CDC. This amounts to:

    • An average of 85,000 new cases each day
    • 181 total new cases for every 100,000 Americans
    • 31% more new cases than last week (April 30-May 6)

    In the past week, the U.S. also reported about 18,000 new COVID-19 patients admitted to hospitals. This amounts to:

    • An average of 2,600 new admissions each day
    • 5.6 total admissions for every 100,000 Americans
    • 18% more new admissions than last week

    Additionally, the U.S. reported:

    • 1,900 new COVID-19 deaths (0.6 for every 100,000 people)
    • 99% of new cases are Omicron BA.2-caused; 43% BA.2.12.1-caused (as of May 7)
    • An average of 80,000 vaccinations per day (per Bloomberg)

    New COVID-19 cases continue to rise in the U.S., with an average of 85,000 cases reported nationally each day last week—double the daily average from three weeks ago. This is a significant undercount, of course, as the majority of COVID-19 tests conducted these days are done at home.

    The country is also reporting more COVID-19 patients admitted to hospitals: about 18,400 people were admitted last week, an 18% increase from the prior week. While this is far lower than the numbers reported during the peak of the Omicron wave (and includes some incidental hospitalizations), it’s still a concerning signal: even as immunity from prior vaccinations and infections protects many Americans from severe disease, plenty of people remain vulnerable.

    This current increase is largely driven by the Omicron subvariant BA.2 and its offshoot BA.2.12.1, which is the most transmissible version of this lineage yet. BA.2.12.1 caused about 43% of new cases nationwide in the week ending May 7, according to CDC estimates; in parts of the Northeast, Midwest, and South, that ratio is over 50%.

    The Northeast, which has the most BA.2.12.1, also continues to report the highest coronavirus levels in wastewater regionally, according to Biobot. After a potential plateau in recent weeks, the Northeast is now continuing to show a clear uptick; wastewater data from other parts of the country also indicate a slow increase in coronavirus transmission.

    The CDC’s wastewater data somewhat reaffirm these trends, but are currently difficult to interpret as a number of sites have gone offline recently. (More on that later in the issue.)

    States with the highest COVID-19 case rates continue to include Northeast states: Rhode Island, Massachusetts, New York, Maine, Vermont, New Jersey, and Washington, D.C. But some Midwest states (Illinois, Michigan, Wisconsin) as well as Hawaii are also reporting over 250 new cases per 100,000 people in the last week, showing how this BA.2 surge is spreading to other regions.

    If you look at the CDC’s Community Level guidance, you may think that, even if you live in one of these surging Northeast states, you can go out in public without a mask. But other metrics, such as the agency’s old Community Transmission levels (which are based more on cases than hospitalizations), suggest otherwise.

    In short: if you want to protect yourself and others in your community, especially if you live in the Northeast, now is a good time to mask up, test often, and avoid large indoor gatherings.

  • National numbers, May 8

    National numbers, May 8

    These maps from the May 5 Community Profile Report look pretty different from the CDC’s all-green “Community Levels” map, huh?

    In the past week (April 30 through May 6), the U.S. reported about 450,000 new COVID-19 cases, according to the CDC. This amounts to:

    • An average of 65,000 new cases each day
    • 138 total new cases for every 100,000 Americans
    • 21% more new cases than last week (April 23-29)

    In the past week, the U.S. also reported about 16,000 new COVID-19 patients admitted to hospitals. This amounts to:

    • An average of 2,200 new admissions each day
    • 4.7 total admissions for every 100,000 Americans
    • 17% more new admissions than last week

    Additionally, the U.S. reported:

    • 2,300 new COVID-19 deaths (0.7 for every 100,000 people)
    • 98% of new cases are Omicron BA.2-caused; 37% BA.2.12.1-caused (as of April 30)
    • An average of 70,000 vaccinations per day (per Bloomberg)

    New COVID-19 cases are still rising in the U.S., as the country continues to face the Omicron subvariant BA.2 and its offshoots. While at levels much lower than what we saw in December and January, daily new cases have more than doubled in the last month.

    And, as I frequently note these days, case numbers are capturing a small fraction of actual COVID-19 infections, as PCR testing becomes less available and at-home rapid tests become more popular. Hospital admissions, a more reliable metric, have also shot up in recent weeks, with about 50% more COVID-19 patients admitted to U.S. hospitals last week than in the first week of April.

    Wastewater data suggest that COVID-19 transmission nationwide may be increasing slightly or in a plateau, far from the kind of exponential increase we saw during the first Omicron surge. Biobot’s dashboard shows that coronavirus levels in wastewater in the Northeast, South, and Midwest continue to increase slightly, while in the West, virus levels have shifted back down in the most recent week of data.

    The CDC’s wastewater dashboard similarly suggests that fewer parts of the country are seeing major coronavirus upticks than the national system reported a couple of weeks ago. But this dashboard is a bit incomplete at the moment, with hundreds of sites reporting no recent data, so I take that finding with a grain of salt.

    Northeast states continue to report the highest case rates, according to the May 5 Community Profile Report. Maine, Rhode Island, Vermont, Massachusetts, Hawaii, New York, New Jersey, Illinois, New Hampshire, and Connecticut all reported more than 200 new cases for every 100,000 residents in the last week, passing the CDC threshold for a medium “Community Level” (or, under the agency’s old guidance, more than double the threshold for high transmission).

    The BA.2 subvariant is now causing almost 100% of new COVID-19 cases in the country, according to CDC estimates, with the even-more-contagious BA.2.12.1 sub-subvariant causing about one in three of those cases. In the coming weeks, we’ll see how well protection from vaccines and recent Omicron BA.1 infections holds up against these more-transmissible versions of the virus.

  • National numbers, May 30

    National numbers, May 30

    New COVID-19 cases by region, via the WHO (data as of May 29).

    In the past week (May 22 through 28), the U.S. reported about 151,000 new cases, according to the CDC. This amounts to:

    • An average of 22,000 new cases each day
    • 46 total new cases for every 100,000 Americans
    • 22% fewer new cases than last week (May 15-21)

    Last week, America also saw:

    • 21,900 new COVID-19 patients admitted to hospitals (6.7 for every 100,000 people)
    • 3,000 new COVID-19 deaths (0.9 for every 100,000 people)
    • 70% of new cases in the country now B.1.1.7-caused (as of May 8)
    • An average of 1.4 million vaccinations per day (per Bloomberg)

    Cases, deaths, and hospitalizations all continue to drop nationwide. The U.S. reported about 3,000 COVID-19 deaths last week, in total—at the peak of the winter surge, we saw more than 3,000 deaths a day.

    This trend is echoed in most states. In the May 27 Community Profile Report, the HHS classifies almost every state as “orange” (between 50 and 100 new cases per 100,000 residents over the past week) or “yellow” (between 10 and 50 cases per 100,000). Wyoming is the only state in the “red” classification, at 101 cases per 100,000 over the past week—while California is in the green, with only 9 cases per 100,000.

    In New York City, where I live, every single ZIP code currently has a test positivity rate at 3% or lower—for the first time since last summer. This is yet another piece of good news showing how well the vaccines work. Half of the total U.S. population has had at least one dose and more than half of the adult population is fully vaccinated, as of yesterday.

    The vaccines also continue to do their part against variants. The CDC variant data—updated this week—indicate that B.1.1.7 is still growing, but it’s leveling off as new cases slow. This variant has gone from causing about 60% of cases in early April, to 67% in mid-April, to 70% in early May; a much slower decline than what we saw in February and March.

    Of more concern: P.1, the variant first identified in Brazil, is causing 7% of U.S. cases as of May 8—and the CDC’s Nowcast estimate puts it at almost 10% of cases by May 22. B.1.617, the variant first identified in India, is also sharply increasing; its case share doubled from April 24 to May 8. Both of these variants are more transmissible (B.1.617 dangerously so) and may have lowered vaccine efficacy.

    But the harm these variants can cause in the heavily-vaccinated U.S. pales in comparison to the risk they pose in other nations. As evidenced by the World Health Organization chart above, the share of cases in Southeast Asia and other lower-income nations is increasing even as cases in the U.S. and Europe drop. The U.S. should focus on providing aid to the nations where vaccinations are lagging so that we can help inoculate people before more, harder-to-contain variants evolve.

    In other words, there’s a reason I’m not giving space to the lab leak theory in this publication. If you’d like to read more about the issue, I recommend this article by Amy Maxmen.

  • National numbers, May 23

    National numbers, May 23

    In the past week (May 15 through 21), the U.S. reported about 195,000 new cases, according to the CDC. This amounts to:

    • An average of 28,000 new cases each day
    • 59 total new cases for every 100,000 Americans
    • 19% fewer new cases than last week (May 8-14)
    Nationwide COVID-19 metrics as of May 21, sourcing data from the CDC and HHS. Posted on Twitter by Conor Kelly.

    Last week, America also saw:

    • 24,000 new COVID-19 patients admitted to hospitals (7.3 for every 100,000 people)
    • 3,500 new COVID-19 deaths (1.1 for every 100,000 people)
    • 66% of new cases in the country now B.1.1.7-caused (as of April 24)
    • An average of 1.9 million vaccinations per day (per Bloomberg)

    I’m starting to feel like a broken record in these updates—but in a good way. U.S. cases continue falling, with our seven-day average now at a level not seen since May 2020.

    Trends in COVID-19 deaths usually echo trends in cases with about a month’s delay. After several weeks of falling cases, the U.S. is now seeing fewer than 500 new COVID-19 deaths a day. This week, 24 states averaged fewer than one new death a day for every 100,000 residents.

    These states include California, Arizona, the Dakotas, and other states that made headlines in past months for their concerning outbreaks—yet another indication that the vaccines are working. Only three states (Michigan, Pennsylvania, and Alaska) saw over two deaths a day for every 100,000 people.

    Vaccinations continue at the slow, steady, 1.5-to-2 million a day pace we’ve seen for the past couple of weeks. About 61% of adults have had at least one dose, and almost half of adults are now fully vaccinated. Meanwhile, many kids in the 12 to 15 age range are taking advantage of their new eligibility: about 1.6 million have received at least one dose so far. 16% of the first doses administered in the last two weeks went to this population.

    Variant numbers haven’t been updated since last week. B.1.1.7 continues to be the dominant variant in the U.S., and other concerning variants (such as B.1.617 from India) continue to spread. But accumulating evidence suggests that the vaccines work well against all variants. Just yesterday, researchers in the U.K. reported 81% effectiveness against B.1.617, according to the Financial Times.

  • National numbers, May 16

    National numbers, May 16

    In the past week (May 8 through 14), the U.S. reported about 248,000 new cases, according to the CDC. This amounts to:

    • An average of 35,000 new cases each day
    • 76 total new cases for every 100,000 Americans
    • 24% fewer new cases than last week (May 1-7)
    Nationwide COVID-19 metrics as of May 14, sourcing data from the CDC and HHS. Posted on Twitter by Conor Kelly.

    Last week, America also saw:

    • 28,300 new COVID-19 patients admitted to hospitals (8.6 for every 100,000 people)
    • 4,100 new COVID-19 deaths (1.3 for every 100,000 people)
    • 66% of new cases in the country now B.1.1.7-caused (as of April 24)
    • An average of 1.9 million vaccinations per day (per Bloomberg)

    COVID-19 case numbers continue to drop this week: the current U.S. average is about 35,000 new cases a day, a 50% drop from where we were a month ago. (We saw 70,000 new daily cases in the week ending April 16.) Daily cases have not been this low since early September, between the summer and fall/winter surges.

    Hospitalizations are also down: about 4,000 new COVID-19 patients were admitted each day this week, compared to about 5,500 a month ago. While this drop is not as dramatic as the drop in cases, it may actually be an indicator that hospitals are admitting and caring for patients with less severe illness—who may not have been admitted in, say, January. Regardless, the more beds a hospital has to spare, the better care it can provide. All states have inpatient bed occupancy rates at 80% or below except for Massachusetss and Rhode Island.

    The CDC updated its variant data this week with figures as of April 24. B.1.1.7 is causing two out of every three COVID-19 cases in the country, according to these data. After B.1.1.7, the most prevalent variant is B.1.526 (14%); this variant, first discovered in NYC, is still classified as a “variant of interest,” so state-by-state data are not available. P.1 also gaining ground: it now causes 5% of U.S. cases, with much higher values in some states (20% of Illinois cases, 11% of Massachusetts cases).

    Though these variants may be worrying, our continued case drop shows that the vaccines are beating them—more on that later. 37% of the overall U.S. population is now fully vaccinated, and 47% has had at least one dose. 

    But some states are doing much better than others. Only 26% of Mississippi’s population is fully vaccinated, compared to almost 50% in Connecticut and Maine. Racial inequities persist as well: Bloomberg reports that only 10 states have vaccinated at least a third of their Black and Hispanic populations, while over 30 states have vaccinated this share of their White and Asian populations.

    As the pace of vaccinations continues to slow (1.9 million per day, as of yesterday), these disparities must be addressed.