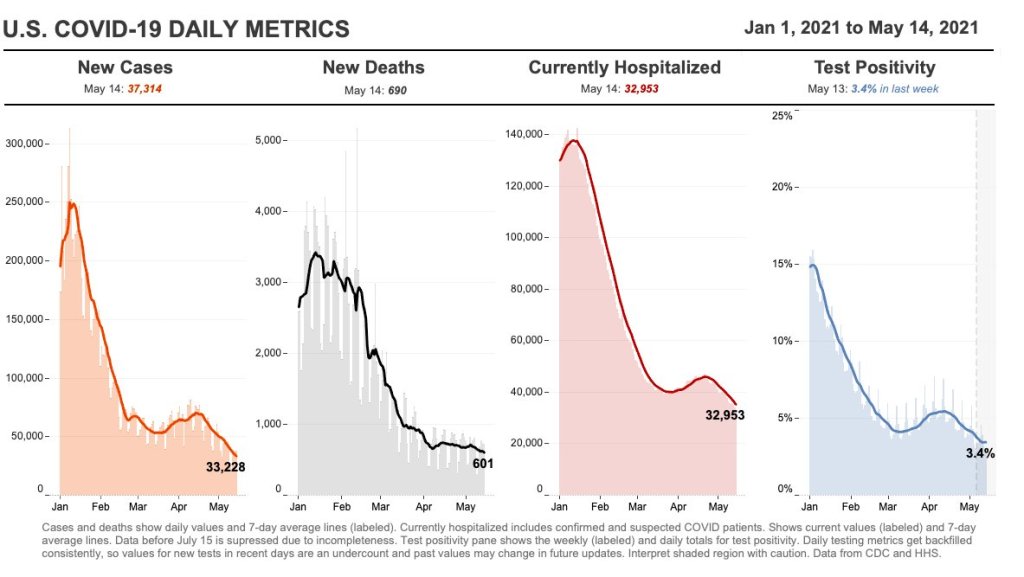
In the past week (May 8 through 14), the U.S. reported about 248,000 new cases, according to the CDC. This amounts to:
- An average of 35,000 new cases each day
- 76 total new cases for every 100,000 Americans
- 24% fewer new cases than last week (May 1-7)

Last week, America also saw:
- 28,300 new COVID-19 patients admitted to hospitals (8.6 for every 100,000 people)
- 4,100 new COVID-19 deaths (1.3 for every 100,000 people)
- 66% of new cases in the country now B.1.1.7-caused (as of April 24)
- An average of 1.9 million vaccinations per day (per Bloomberg)
COVID-19 case numbers continue to drop this week: the current U.S. average is about 35,000 new cases a day, a 50% drop from where we were a month ago. (We saw 70,000 new daily cases in the week ending April 16.) Daily cases have not been this low since early September, between the summer and fall/winter surges.
Hospitalizations are also down: about 4,000 new COVID-19 patients were admitted each day this week, compared to about 5,500 a month ago. While this drop is not as dramatic as the drop in cases, it may actually be an indicator that hospitals are admitting and caring for patients with less severe illness—who may not have been admitted in, say, January. Regardless, the more beds a hospital has to spare, the better care it can provide. All states have inpatient bed occupancy rates at 80% or below except for Massachusetss and Rhode Island.
The CDC updated its variant data this week with figures as of April 24. B.1.1.7 is causing two out of every three COVID-19 cases in the country, according to these data. After B.1.1.7, the most prevalent variant is B.1.526 (14%); this variant, first discovered in NYC, is still classified as a “variant of interest,” so state-by-state data are not available. P.1 also gaining ground: it now causes 5% of U.S. cases, with much higher values in some states (20% of Illinois cases, 11% of Massachusetts cases).
Though these variants may be worrying, our continued case drop shows that the vaccines are beating them—more on that later. 37% of the overall U.S. population is now fully vaccinated, and 47% has had at least one dose.
But some states are doing much better than others. Only 26% of Mississippi’s population is fully vaccinated, compared to almost 50% in Connecticut and Maine. Racial inequities persist as well: Bloomberg reports that only 10 states have vaccinated at least a third of their Black and Hispanic populations, while over 30 states have vaccinated this share of their White and Asian populations.
As the pace of vaccinations continues to slow (1.9 million per day, as of yesterday), these disparities must be addressed.

Leave a comment