
In the past week (June 11 through 17), the CDC did not update COVID-19 hospitalization data due to changes in its reporting process.
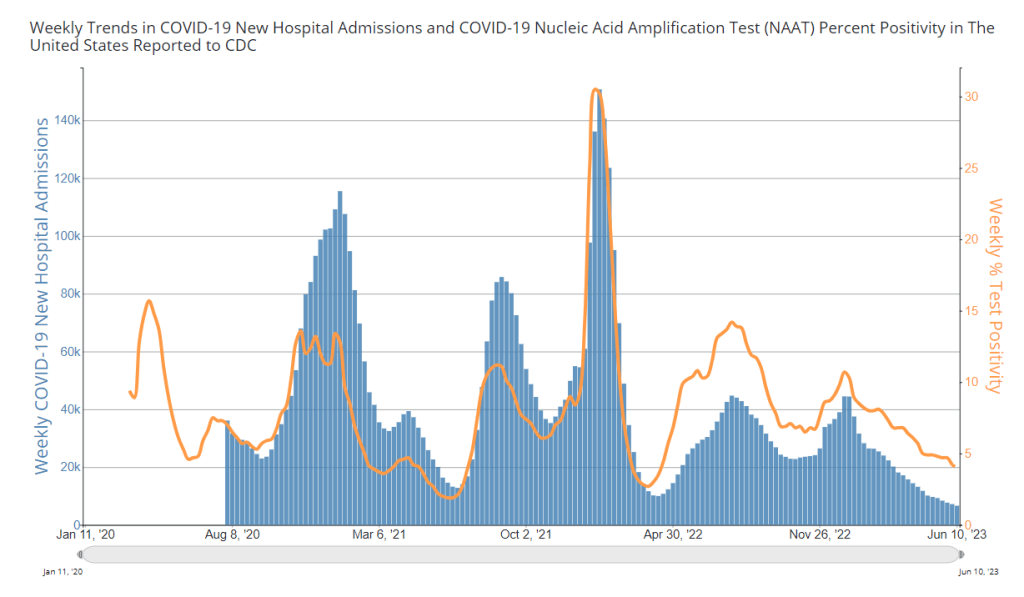
During the most recent week of data available (June 4 through 10), the U.S. reported about 6,600 new COVID-19 patients admitted to hospitals, according to the CDC. This amounts to:
- An average of 950 new admissions each day
- 2.0 total admissions for every 100,000 Americans
- 8% fewer new admissions than the prior week (May 28-June 3)
Additionally, the U.S. reported:
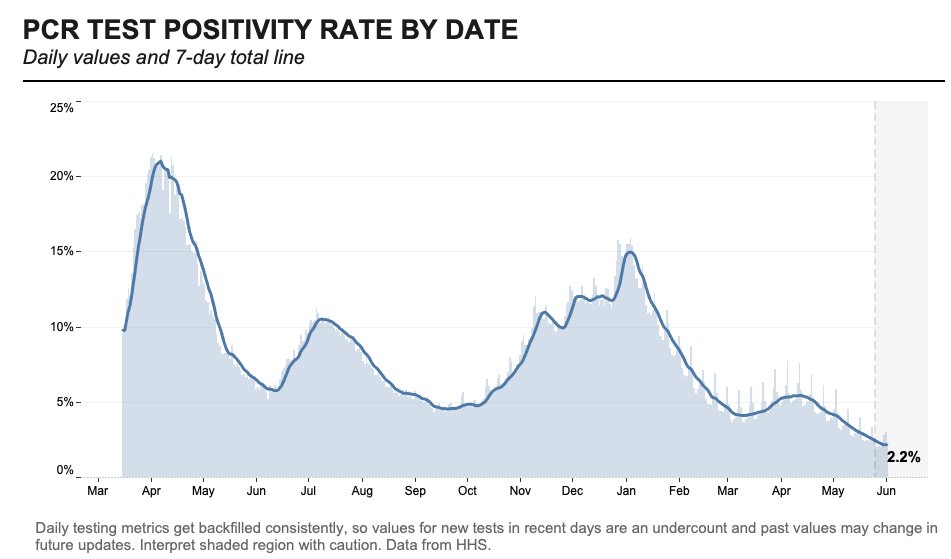
- 4.0% of tests in the CDC’s surveillance network came back positive
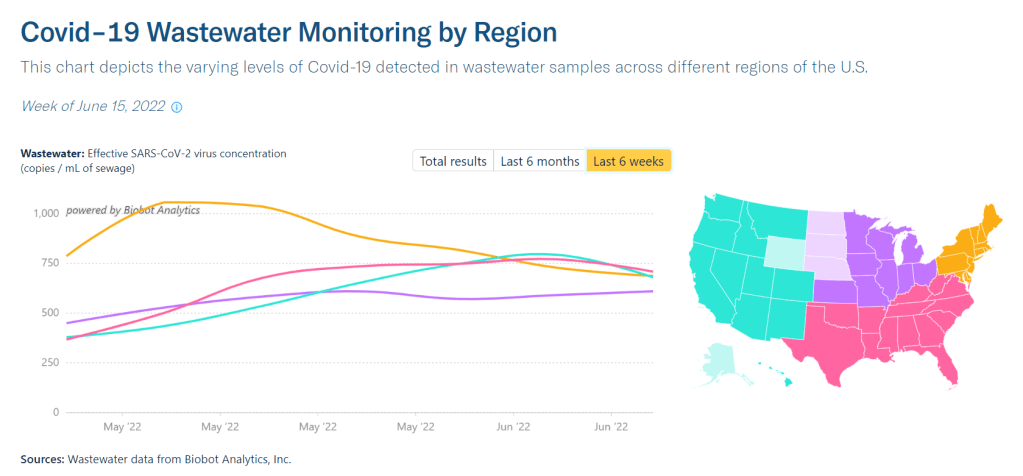
- A 16% lower concentration of SARS-CoV-2 in wastewater than last week (as of June 21, per Biobot’s dashboard)
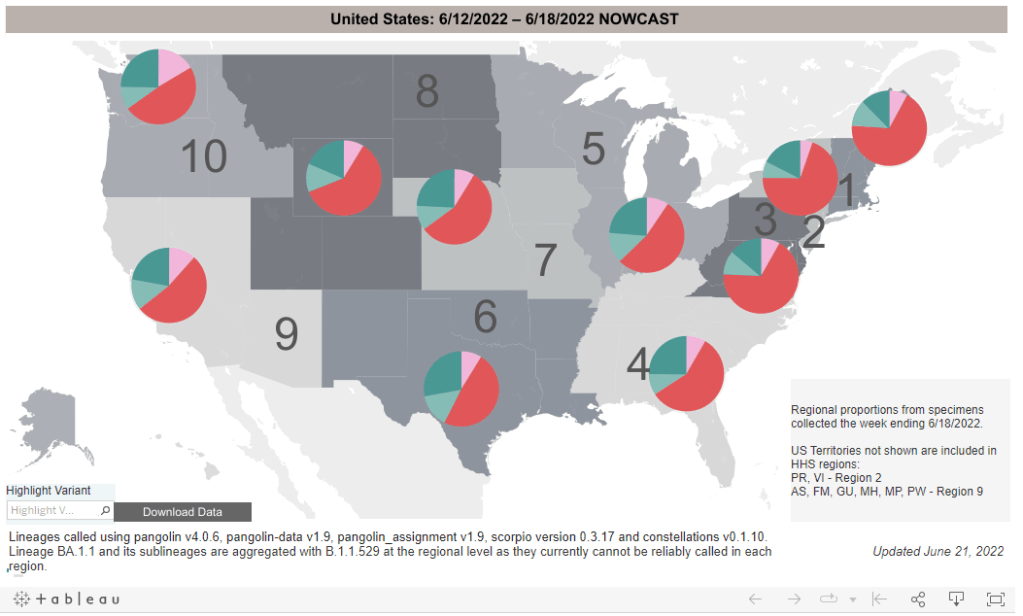
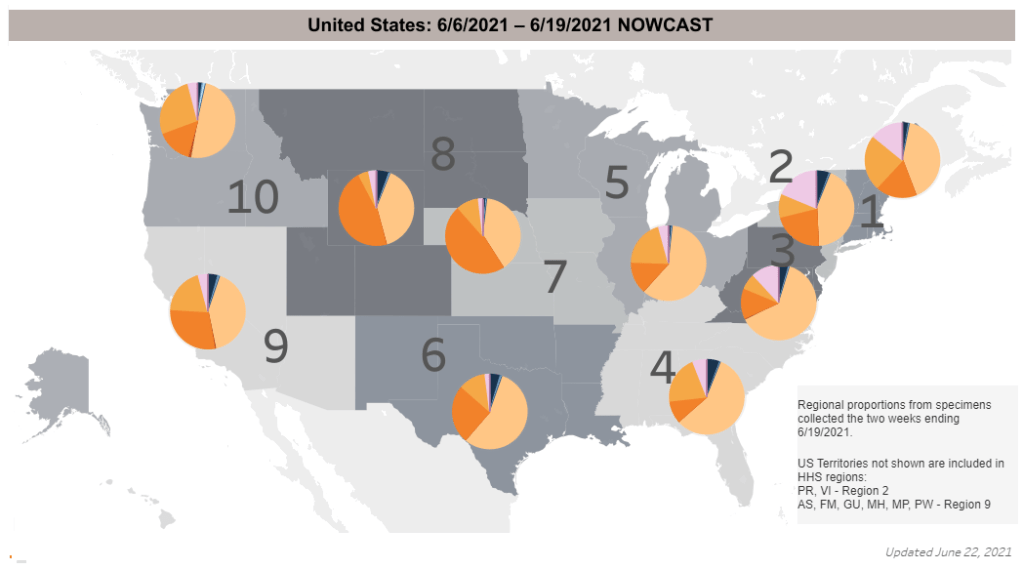
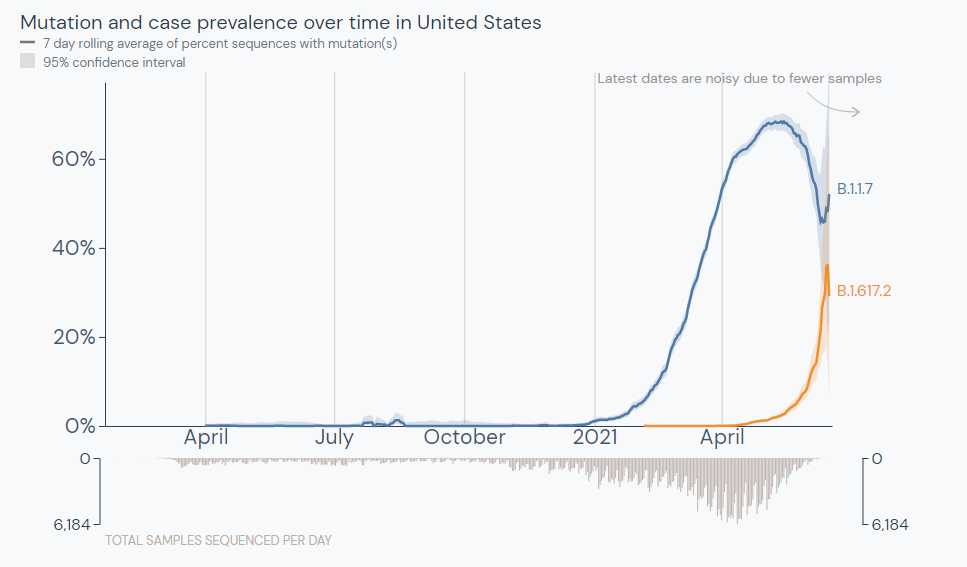
- 30% of new cases are caused by Omicron XBB.1.6; 24% by XBB.1.9; 11% by XBB.2.3 (as of June 24)
The CDC failed to update its primary COVID-19 metrics this week, so I have no national updates to share about hospital admissions, deaths, or test positivity. The most recent available data from the agency and wastewater surveillance sources suggest that the U.S. is still experiencing a transmission plateau.
According to the CDC’s dashboard, the agency didn’t update its hospitalization data “due to a change in required reporting cadence from daily to weekly,” following the end of the public health emergency in May. The dashboard note is a bit unclear, but I’m assuming this refers to a change in requirements for state public health departments reporting to the CDC, as the national agency lost its authority to require daily data reporting when the PHE ended.
Still, it’s confusing to me that the CDC’s dashboard note only refers to hospitalization data, because deaths, test positivity, and other metrics also weren’t updated this week. These data points don’t rely on state reporting systems, so they shouldn’t be impacted by the reporting change.
Either the note is incomplete, or the CDC staff in charge of this dashboard took an issue with one metric as an excuse not to update several metrics. I don’t love the outcome either way. Like, do they think nobody is checking this dashboard? Because we still are.
Anyway, the CDC’s most recent data (from the week of June 10, now about three weeks ago), suggested that the U.S. was in a continued COVID-19 plateau, with hospital admissions and test positivity from the CDC’s surveillance network declining very slightly.
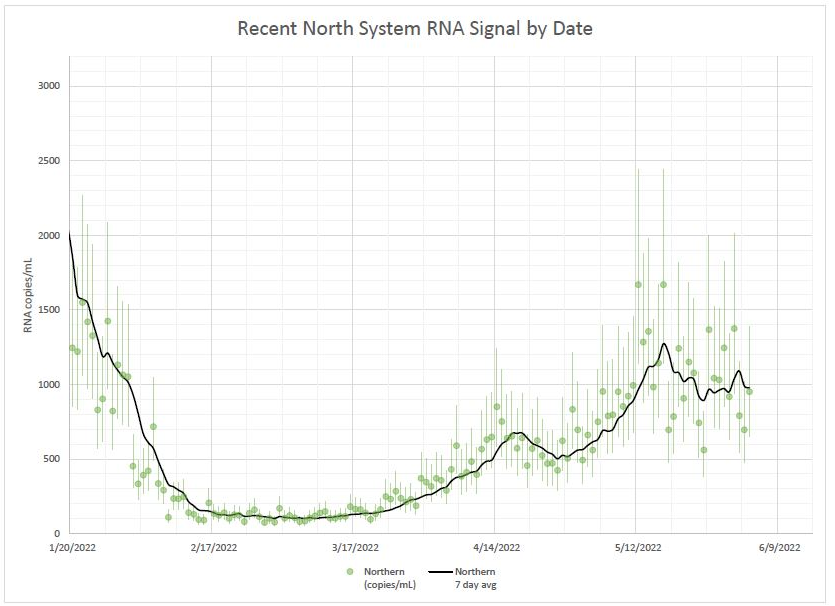
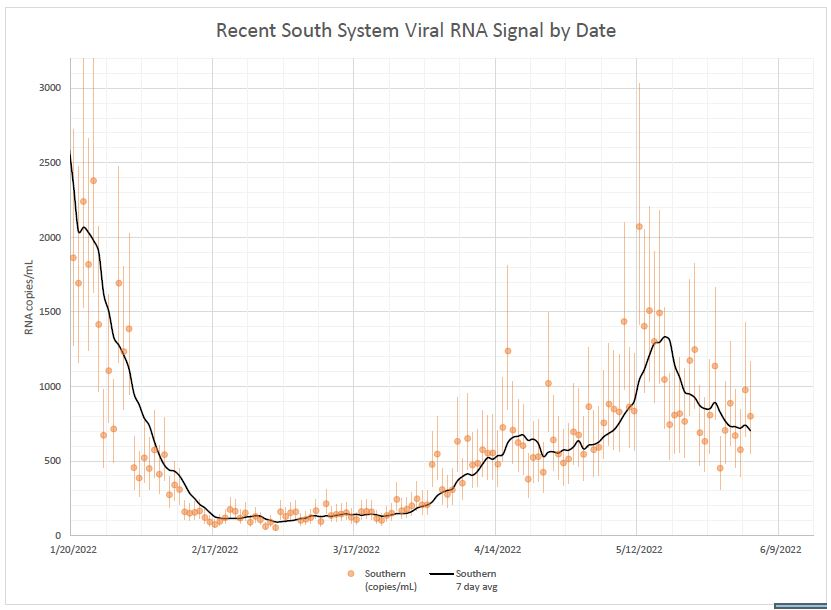
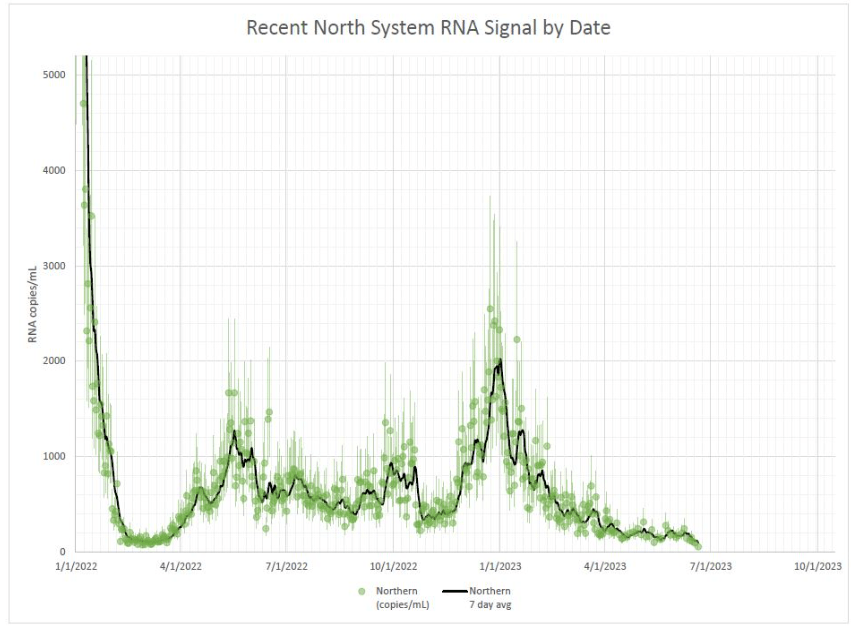
Wastewater data from Biobot Analytics indicates a similar plateau at the national level. Regionally, the Northeast and West coast experienced slight upticks in COVID-19 spread in the last few weeks, but the coronavirus levels in their wastewater now appear to be trending back down. (These are small changes, though, compared to what we’ve seen in past surges.)
The sewage in Boston and New York City, two large Northeast cities that are often bellwethers for larger COVID-19 trends, similarly slow slight viral increases in May followed by downturns in June. NYC data are delayed by up to two weeks, though, so take this with a grain of salt.
The CDC did update its variant estimates this week, showing that XBB.1.5 is now causing less than one-third of cases nationwide. XBB.1.6 and its relatives are now the most popular lineages in the U.S., causing a combined 30% of new cases in the two weeks ending June 24. Other XBB variants, including XBB.1.6 and XBB.2.3, are also on the rise.
As health agencies put fewer and fewer resources into tracking COVID-19, the data we still have show continued severe ramifications for this disease’s unchecked spread. This disease still kills over 100 people per day.