Tag: Hospitalization

  • The CDC’s new COVID-19 dashboard hides transmission risk

    The CDC’s new COVID-19 dashboard hides transmission risk

    The CDC’s new COVID-19 dashboard suggests that the national situation is totally fine, because hospitalizations are low. But is that correct?

    On Thursday, the CDC revamped its COVID-19 dashboard in response to changing data availability with the end of the federal public health emergency. (For more details on the data changes, see my post from last week.) The new dashboard downplays continued COVID-19 risk across the U.S.

    Overall, the new dashboard makes it clear that case counts are no longer available, since testing labs and state/local heath agencies aren’t sending those results to the CDC anymore. You can’t find case counts or trends on the homepage, at the top of the dashboard, or in a county-level map.

    Instead, the CDC is now displaying data that shows some of COVID-19’s severe impacts— hospitalizations and deaths—without making it clear how widely the virus is still spreading. Its key metrics are new hospital admissions, currently-hospitalized patients, emergency room visits, and the percentage of recent deaths attributed to COVID-19. You can find these numbers at national and state levels in a revamped “trends” page, and at county levels in a “maps” page.

    The “maps” page with county-level data has essentially replaced the CDC’s prior Community Level and Transmission Level page, where users were previously able to find COVID-19 case rates and test positivity rates by county. In fact, as of May 13, the URL to this maps page is still labeled as “cases” when you click into it from the main dashboard.

    While these changes might be logical (given that case numbers are no longer available), I think the CDC’s design choices here are worth highlighting. By prioritizing hospitalizations and deaths, the CDC implicitly tells users of this dashboard that the virus should no longer be a concern for you unless you’re part of a fairly small minority of Americans at high risk of those severe outcomes.

    But is that actually true, that COVID-19 is no longer a concern unless you’re going to go to the hospital? I personally wouldn’t agree. I’d prefer not to be out sick for a week or two, if I can avoid it. And I’d definitely like to avoid any long-term symptoms—or the long-term risks of heart problems, lung problems, diabetes, etc. that may come after a coronavirus infection.

    These outcomes still persist after a mild COVID-19 case. But the current CDC data presentation makes it hard to see those potential outcomes, or your risk of getting that mild COVID-19 case. The agency still has some data that can help answer these questions (wastewater surveillance, variant surveillance, Long COVID survey results, etc.) but those numbers aren’t prioritized to the same degree as hospitalizations and deaths.

    I’m sure the CDC data scientists behind this new dashboard are doing the best they can with the information they have available. Still, in this one journalist’s opinion, they could’ve done more to make it clear how dangerous—and how widely prevalent—COVID-19 still is.

    For other dashboards that continue to provide updates, see my list from a few weeks ago. I also recommend looking at your state and local public health agencies to see what they’re doing in response to the PHE’s end.

    More federal data

  • The federal public health emergency ends next week: What you should know

    The federal public health emergency ends next week: What you should know

    A chart from the CDC’s recent report on surveillance changes tied to the end of the federal public health emergency.

    We’re now less than one week out from May 11, when the federal public health emergency (or PHE) for COVID-19 will end. While this change doesn’t actually signify that COVID-19 is no longer worth worrying about, it marks a major shift in how U.S. governments will respond to the ongoing pandemic, including how the disease is tracked and what public services are available.

    I’ve been writing about this a lot in the last couple of months, cataloging different aspects of the federal emergency’s end. But I thought it might be helpful for readers if I compiled all the key information in one place. This post also includes a few new insights about how COVID-19 surveillance will change after May 11, citing the latest CDC reports.

    What will change overall when the PHE ends?

    The ending of the PHE will lead to COVID-19 tests, treatments, vaccines, and data becoming less widely available across the U.S. It may also have broader implications for healthcare, with telehealth policies shifting, people getting kicked off of Medicaid, and other changes.

    Last week, I attended a webinar about these changes hosted by the New York City Pandemic Response Institute. The webinar’s moderator, City University of New York professor Bruce Y. Lee, kicked it off with a succinct list of direct and indirect impacts of the PHE’s end. These were his main points:

    • Free COVID-19 vaccines, tests, and treatments will run out after the federal government’s supplies are exhausted. (Health experts project that this will likely happen sometime in fall 2023.) At that point, these services will get more expensive and harder to access as they transition to private healthcare markets.
    • We will have fewer COVID-19 metrics (and less complete data) to rely on as the CDC and other public health agencies change their surveillance practices. More on this below.
    • Many vaccination requirements are being lifted. This applies to federal government mandates as well as many from state/local governments and individual businesses.
    • The FDA will phase out its Emergency Use Authorizations (EUAs) for COVID-19 products, encouraging manufacturers to apply for full approval. (This doesn’t mean we’ll suddenly stop being able to buy at-home tests—there’s going to be a long transition process.)
    • Healthcare worker shortages may get worse. During the pandemic emergency, some shifts to work requirements allowed facilities to hire more people, more easily; as these policies are phased out, some places may lose those workers.
    • Millions of people will lose access to Medicaid. A federal rule tied to the PHE forbade states from kicking people off this public insurance program during the pandemic, leading to record coverage. Now, states are reevaluating who is eligible. (This process actually started in April, before the official PHE end.)
    • Telehealth options may become less available. As with healthcare hiring, policies during the PHE made it easier for doctors to provide virtual care options, like video-call appointments and remote prescriptions. Some of these COVID-era rules will be rolled back, while others may become permanent.
    • People with Long COVID will be further left behind, as the PHE’s end leads many people to distance themselves even more from the pandemic—even though long-haulers desperately need support. This will also affect people who are at high risk for COVID-19 and continue to take safety precautions.
    • Pandemic research and response efforts may be neglected. Lee referenced the “panic and neglect” cycle for public health funding: a pattern in which governments provide resources when a crisis happens, but then fail to follow through during less dire periods. The PHE’s end will likely lead us (further) into the “neglect” part of this cycle.

    How will COVID-19 data reporting change?

    The CDC published two reports this week that summarize how national COVID-19 data reporting will change after May 11. One goes over the surveillance systems that the CDC will use after the PHE ends, while the other discusses how different COVID-19 metrics correlate with each other.

    A lot of the information isn’t new, such as the phasing out of Community Level metrics for counties (which I covered last week). But it’s helpful to have all the details in one place. Here are a few things that stuck out to me:

    • Hospital admissions will be the CDC’s primary metric for tracking trends in COVID-19 spread rather than cases. While more reliable than case counts, hospitalizations are a lagging metric—it takes typically days (or weeks) after infections go up for the increase to show up at hospitals, since people don’t seek medical care immediately. The CDC will recieve reports from hospitals at a weekly cadence, rather than daily, after May 11, likely increasing this lag and making it harder for health officials to spot new surges.
    • National case counts will no longer be available as PCR labs will no longer be required to report their data to the CDC. PCR test totals and test positivity rates will also disappear for the same reason, as will the Community Levels that were determined partially by cases. The CDC will also stop reporting real(ish)-time counts of COVID-associated deaths, relying instead on death certificates.
    • Deaths will be the primary metric for tracking how hard COVID-19 is hitting the U.S. The CDC will get this information from death certificates via the National Vital Statistics System. While deaths are reported with a significant lag (at least two weeks), the agency has made a lot of progress on modernizing this reporting system during the pandemic. (See this December 2021 post for more details.)
    • The CDC will utilize sentinel networks and electronic health records to gain more information about COVID-19 spread. This includes the National Respiratory and Enteric Virus Surveillance System, a network of about 450 laboratories that submit testing data to the CDC (previously established for other endemic diseases like RSV and norovirus). It also includes the National Syndromic Surveillance Program, a network of 6,300 hospitals that submit patient data to the agency.
    • Variant surveillance will continue, using a combination of PCR samples and wastewater data. The CDC’s access to PCR swab samples will be seriously diminished after May 11, so it will have to work with public health labs to develop national estimates from the available samples. Wastewater will help fill in these gaps; a few wastewater testing sites already send the CDC variant data. And the CDC will continue offering tests to international travelers entering the country, for a window into global variant patterns.
    • The CDC will continue tracking vaccinations, vaccine effectiveness, and vaccine safety. Vaccinations are generally tracked at the state level (every state health agency, and several large cities, have their own immunization data systems), but state agencies have established data sharing agreements with the CDC that are set to continue past May 11. The CDC will keep using its established systems for evaluating how well the vaccines work and tracking potential safety issues as well.
    • Long COVID notably is not mentioned in the CDC’s reports. The agency hasn’t put much focus on tracking long-term symptoms during the first three years of the pandemic, and it appears this will continue—even though Long COVID is a severe outcome of COVID-19, just like hospitalization or death. A lack of focus on tracking Long COVID will make it easier for the CDC and other institutions to keep minimizing this condition.

    On May 11, the CDC plans to relaunch its COVID-19 tracker to incorporate all of these changes. The MMWR on surveillance changes includes a list of major pages that will shift or be discontinued at this time.

    Overall, the CDC will start tracking COVID-19 similar to the way it tracks other endemic diseases. Rather than attempting to count every case, it will focus on certain severe outcomes (i.e., hospitalizations and deaths) and extrapolate national patterns from a subset of healthcare facilities with easier-to-manage data practices. The main exception, I think, will be a focus on tracking potential new variants, since the coronavirus is mutating faster and more aggressively than other viruses like the flu.

    What should I do to prepare for May 11?

    If you’ve read this far, you’re probably concerned about how all these shifts will impact your ability to stay safe from COVID-19. Unfortunately, the CDC, like many other public agencies, is basically leaving Americans to fend for themselves with relatively little information or guidance.

    But a lot of information sources (like this publication) are going to continue. Here are a few things I recommend doing this week as the PHE ends:

    • Look at your state and local public health agencies to see how they’re responding to the federal shift. Some COVID-19 dashboards are getting discontinued, but many are sticking around; your local agency will likely have information that’s more tailored to you than what the CDC can offer.
    • Find your nearest wastewater data source. With case counts basically going away, wastewater surveillance will be our best source for early warnings about surges. You can check the COVID-19 Data Dispatch list of wastewater dashboards and/or the COVIDPoops dashboard for sources near you.
    • Stock up on at-home tests and masks. This is your last week to order free at-home/rapid tests from your insurance company if you have private insurance. It’s also a good time to buy tests and masks; many distributors are having sales right now.
    • Figure out where you might get a PCR test and/or Paxlovid if needed. These services will be harder to access after May 11; if you do some logistical legwork now, you may be more prepared for when you or someone close to you gets sick. The People’s CDC has some information and links about this.
    • Contact your insurance company to find out how their COVID-19 coverage policies are changing, if you have private insurance. Folks on Medicare and Medicaid: this Kaiser Family Foundation article has more details about changes for you.
    • Ask people in your community how you can help. This is a confusing and isolating time for many Americans, especially people at higher risk for COVID-19. Reaching out to others and offering some info or resources (maybe even sharing this post!) could potentially go a long way.

    That was a lot of information packed into one post. If you have questions about the ending PHE (or if I missed any important details), please email me or leave a comment below—and I’ll try to answer in next week’s issue.

    More about federal data

  • The case for mask mandates in healthcare settings

    The case for mask mandates in healthcare settings

    A lot of healthcare organizations have ended mask mandates in recent months, many of them citing guidance changes at state or local levels to no longer require this level of precaution. Some of this stems back to a CDC policy change last fall; the agency recommended that healthcare settings only need universal masking when COVID-19 spread is high.

    Now, this is likely another case of the CDC—and potentially quite a few other health agencies—making recommendations that are, in fact, very dangerous. There’s plenty of evidence to support that mask mandates should continue in healthcare settings, to protect vulnerable patients from COVID-19 and many other illnesses.

    Let’s go over some key points:

    • Hospital-acquired COVID-19 infections: Since the start of the pandemic, people who go to the hospital for issues other than COVID-19 have contracted the virus while there. The HHS tracks these cases, and their data show that this is a continued problem: even as new COVID-19 admissions in hospitals have declined in 2023, hospital-acquired infections have continued to be an issue, with hundreds of these cases reported each day in recent months. Universal masking reduces these infections.
    • Wastewater surveillance in hospitals: Another way to track COVID-19 in healthcare settings is through targeted wastewater surveillance, taking samples from a particular facility’s sewage. A few hospital systems are doing this, such as NYC’s public system (Health + Hospitals). While there are limited public data from these programs, researchers who run them have said that the results show consistent COVID-19 spread; masks help mitigate this transmission.
    • Healthcare facility outbreaks: After lifting a mask mandate, hospitals and other healthcare facilities may have COVID-19 outbreaks among patients and staff—both putting vulnerable patients at risk and exacerbating staffing shortages. One hospital in the Bay Area recently reinstated a mask mandate after such an outbreak, according to local paper the San Francisco Chronicle.
    • Patients hesitant to visit: Many patients at higher risk for severe COVID-19 may become wary of routine doctors’ visits or procedures if their clinics stop requiring masks. This is a sentiment I’ve seen frequently on social media over the last few months, as higher-risk people push for healthcare organizations to keep their mask mandates.
    • Harming long-term outcomes: Any already-vulnerable person who gets COVID-19 at a healthcare facility is likely to face long-term symptoms from the virus, potentially complicating their existing chronic conditions. This fact contributes to individual patients’ wariness, and it can also lead to complications for potential treatments or research studies. For example, a Stanford study testing Paxlovid for Long COVID has recently stopped requiring its staff to mask, according to patient reports; participants have pointed out that this could harm the study’s results.

    If you’re interested in getting involved with advocacy in this area, I recommend checking out Mandate Masks US and connected organizations. These groups are pushing for masks to remain in healthcare through social media campaigns, petitions, contacting politicians, and even some in-person protests.

  • National numbers, March 19

    National numbers, March 19

    New hospital admissions have fallen significantly from their recent peak in January, but are still much higher than at this time last year. Chart from the CDC.

    In the past week (March 9 through 15), the U.S. officially reported about 150,000 new COVID-19 cases, according to the CDC. This amounts to:

    • An average of 21,000 new cases each day
    • 46 total new cases for every 100,000 Americans
    • 20% fewer new cases than last week (March 2-8)

    In the past week, the U.S. also reported about 19,000 new COVID-19 patients admitted to hospitals. This amounts to:

    • An average of 2,800 new admissions each day
    • 5.9 total admissions for every 100,000 Americans
    • 10% fewer new admissions than last week

    Additionally, the U.S. reported:

    • 1,700 new COVID-19 deaths (240 per day)
    • 90% of new cases are caused by Omicron XBB.1.5; 2% by XBB.1.5.1; 0.5% by CH.1.1 (as of March 18)
    • An average of 40,000 vaccinations per day

    The trend continues: COVID-19 spread is still on the decline across the U.S., but it’s a slow decline. These updates are getting pretty repetitive to write, as we’ve been seeing this pattern since late January—which, honestly, I’m taking as a good sign.

    Last week, I noted that the drop in official COVID-19 cases (reported to the CDC) was exaggerated slightly because of data delays; three states didn’t report cases in the week ending March 8. This week, the same thing happened for three different states: Texas, Arkansas, and Indiana. We’ll likely continue to see reporting issues like this, as state and local health departments put fewer resources into tracking COVID-19.

    Even so, the official case data, hospital admissions, and wastewater surveillance all point to continued decreases in coronavirus transmission. National hospital admissions dropped by about 12% this week compared to the week prior. But there are still a lot of Americans getting severe COVID-19 symptoms, with more than 3,000 people newly hospitalized each week for the last month.

    Wastewater surveillance data from Biobot suggest that coronavirus spread is getting lower, but it’s still at much higher levels nationally than we saw at this time in 2021 and 2022. Regionally, the Midwest now has slightly more virus circulating than other parts of the country, but all four major regions are seeing slow declines or plateaus.

    In other good news: flu activity is still low nationally, according to the CDC’s flu surveillance. Experts had worried we might see a second flu surge, driven by a different strain of the influenza virus, after the initial surge died down in January. But so far, that hasn’t happened. Almost every state reported moderate or low levels of influenza-like activity in the week ending March 11.

    XBB.1.5 continues to be the dominant coronavirus lineage in the U.S., causing an estimated 90% of cases nationwide in the week ending March 18. XBB.1.5.1, a descendant of XBB.1.5, is growing slowly (it caused an estimated 2% of cases nationwide this week) and doesn’t seem to be very competitive yet. The CDC also has yet to break out XBB.1.9 or XBB.1.16, other subvariants that mutated from XBB.

    Yesterday, I spoke about wastewater surveillance at New York City School of Data, a civic conference that’s part of the city’s Open Data Week. While the conference wasn’t focused on health or science topics, the organizers required masks and checked attendees’ vaccinations. I also brought my CO2 monitor to the event, and found ventilation was generally good in the session rooms. This conference was a nice reminder that some organizations are still following the data and science on COVID-19 precautions.

  • National numbers, February 26

    National numbers, February 26

    According to the CDC’s data on hospital emergency department visits for respiratory viruses, COVID-19 visits have plateaued while flu and RSV have returned to low levels.

    In the past week (February 16 through 22), the U.S. officially reported about 240,000 new COVID-19 cases, according to the CDC. This amounts to:

    • An average of 34,000 new cases each day
    • 72 total new cases for every 100,000 Americans
    • 9% fewer new cases than last week (February 9-15)

    In the past week, the U.S. also reported about 25,000 new COVID-19 patients admitted to hospitals. This amounts to:

    • An average of 3,500 new admissions each day
    • 7.5 total admissions for every 100,000 Americans
    • 5% fewer new admissions than last week

    Additionally, the U.S. reported:

    • 2,400 new COVID-19 deaths (350 per day)
    • 85% of new cases are caused by Omicron XBB.1.5; 12% by BQ.1 and BQ.1.1; 1% by CH.1.1 (as of February 25)
    • An average of 60,000 vaccinations per day

    The national COVID-19 plateau continues. As I’ve been saying for a few weeks now, COVID-19 spread has dropped significantly from its high during the winter holidays, but it has not fallen to the low levels we’ve previously seen this time of year due to a combination of lax precautions and the latest Omicron variant, XBB.1.5.

    Case and hospitalization data from the CDC, along with wastewater surveillance data, all show COVID-19 spread declining—but very slowly. Cases declined by 9% this week compared to the week prior, while new hospital admissions declined by 5%. Biobot’s wastewater surveillance dashboard shows slight declines or plateaus in all four major regions of the country.

    Respiratory virus season is clearly waning in the U.S., according to hospital emergency room visit data from the CDC’s National Syndromic Surveillance Program. ER visits for the flu and RSV have pretty much returned to baseline after their winter peaks. But COVID-19 ER visits have plateaued at a higher level, close to the visit numbers reported in September and October—another sign of the elevated “low tide” we’ve now been dealing with since spring 2022.

    On the variant front: Omicron XBB.1.5 continues to dominate in the U.S. It caused an estimated 85% of new cases nationwide in the week ending February 25, according to the CDC, and is the main variant circulating in every region. After several months of “variant soup” with a number of Omicron subvariants competing, XBB.1.5 has emerged as the clear victor; no other single lineage is causing more than 10% of new cases in the country, per the CDC’s estimates.

    I continue to write about COVID-19 case numbers from the CDC here, mostly because A) the directional patterns (i.e. upticks and downturns) of these data are still a decent representation of actual directional patterns in infections, and B) the CDC’s case numbers are more nationally representative (when it comes to geography) than data from the National Wastewater Surveillance System.

    But I have to stress that these case numbers are increasingly undercounting actual infections. The last decent estimates I’ve seen comparing cases to infections, dated from last fall, suggested that case numbers are undercounted by a factor of 10 to 20. These days, I expect we’re likely closer to a factor of 20, if not higher. As evidence, test positivity for the entire U.S. has been at 10% for a couple of weeks now.

    Other evidence for this continued undercounting comes from wastewater data. From resources like the Biobot dashboard, which compares wastewater surveillance trends to case trends, it’s abundantly clear that these two metrics used to align closely—but now coronavirus levels in wastewater are consistently much higher. In New York City, for example, wastewater data show that the city experienced one of its greatest COVID-19 surges this winter.

    Speaking of unreliable numbers: the team behind the CDC’s COVID Data Tracker Weekly Review has begun to update its readers on how the end of the federal public health emergency will impact COVID-19 data. The first update, published on Friday, explains that some data, including hospitalization and vaccination numbers, “may be reported less frequently” or with new gaps. I anticipate we’ll get more details about this in the coming weeks, as the CDC negotiates new data-sharing requirements with other health agencies.

    The CDC’s data tracking newsletter is also shifting from a weekly newsletter to biweekly, starting March 3. It continues to boggle my mind how I, a single freelance journalist writing this publication in my spare time, am able to keep up more regular data updates than a massive federal agency.

  • National numbers, December 11

    National numbers, December 11

    The CDC’s influenza-like illness map shows that the vast majority of the country is facing either high or very high levels of respiratory disease.

    In the past week (December 1 through 7), the U.S. reported about 460,000 new COVID-19 cases, according to the CDC. This amounts to:

    • An average of 66,000 new cases each day
    • 140 total new cases for every 100,000 Americans
    • 50% more new cases than last week (November 24-30)

    In the past week, the U.S. also reported about 34,000 new COVID-19 patients admitted to hospitals. This amounts to:

    • An average of 4,800 new admissions each day
    • 10.3 total admissions for every 100,000 Americans
    • 14% more new admissions than last week

    Additionally, the U.S. reported:

    • 3,000 new COVID-19 deaths (430 per day)
    • 68% of new cases are caused by Omicron BQ.1 and BQ.1.1; 6% by BF.7; 4% by BN.1;  5% by XBB (as of December 10)
    • An average of 300,000 vaccinations per day

    It’s now undeniable that Thanksgiving led to a jump in COVID-19 spread: officially-reported cases went up 50% this past week compared to the week of the holiday, following the trend that we first saw in wastewater data. Hospital admissions for COVID-19 also continue to go up.

    As always, it’s important to remember that official case counts are significantly underreported, due to dwindling access to (and interest in) PCR testing. So, the CDC’s estimate of 66,000 new COVID-19 cases each day likely amounts to over a million actual new infections each day. And that’s adding to the surges of flu, RSV, and other respiratory viruses already going strong.

    “Levels of flu-like illness, which includes people going to the doctor with a fever and a cough or sore throat, are at either high or very high levels in 47 jurisdictions,” CDC Director Dr. Rochelle Walensky said at a media briefing last Monday. That “flu-like illness” metric, shown on the CDC’s flu dashboard, is primarily used as an estimate of flu cases, but in our era of under-testing it likely includes COVID-19 and other viruses with similar symptoms.

    Dr. Walensky said that current hospitalizations for flu are the highest they’ve been in a decade for this time of year, indicating that the U.S. is having a bad flu season earlier in the winter than usual. According to Inside Medicine, flu hospitalizations actually overtook COVID-19 hospitalizations for the first time in the pandemic recently; though this trend could reverse as COVID-19 spreads more.

    The flu surge could peak and give us a milder January, or it could continue to go up from here—it’s currently hard to say. Flu vaccination rates have been low this year, which doesn’t help. CDC officials highlighted the benefits of both the flu vaccine and the updated COVID-19 booster shots at their briefing on Monday.

    Those updated COVID-19 boosters offer better protection against Omicron infection than prior vaccines, as real-world data has demonstrated. That should include protection against BQ.1 and BQ.1.1, the descendants of Omicron BA.5 that are currently causing the majority of cases in the U.S.—about 68% of new cases in the week ending December 10, per the CDC. XBB, the BA.2 subvariant that led to surges in Asian countries, is on the rise.

    Last week, wastewater data from Biobot showed a steep increase in COVID-19 spread. This week, the company’s dashboard suggests that this surge may have already peaked in some parts of the country. Was Thanksgiving the start of a major winter wave, or was it more of a holiday blip? Future weeks of data will help answer this.

  • The U.S.’s flu and RSV surveillance is insufficient for tracking this fall’s outbreaks

    The U.S.’s flu and RSV surveillance is insufficient for tracking this fall’s outbreaks

    The CDC’s FluView dashboard does not provide precise case numbers, only an approximation of “activity level.”

    I recently received a question from a reader, asking how to follow both COVID-19 and the flu in the county where she lives. For COVID-19, county-level data sources aren’t too hard to find: the CDC still provides some clinical data—though case numbers are now updated weekly, instead of daily—and many counties have wastewater surveillance available. (See last week’s post for more details.)

    But following flu transmission is much harder: there’s no county-level tracking of this virus. The same thing goes for respiratory syncytial virus (RSV), a virus currently sending record cases to children’s hospitals across the country. There are a few data sources available, which I’ll list later in this post, though nothing as comprehensive as what we’ve come to expect for COVID-19.

    As I’ve previously written, the COVID-19 pandemic inspired nationwide disease surveillance at a level the U.S. has never seen before. The healthcare and public health systems had not previously attempted to count up every case of a widely-spreading virus and share that information back to the public in close-to-real-time.

    It’s unlikely that flu, RSV, and other diseases will get the same resources as COVID-19 did for intensive tracking—at least not in the near future. But the scale of data we’ve had during the pandemic reveals that our current surveillance for these diseases is pretty inadequate, even for such basic purposes as giving hospitals advanced warning about new surges. 

    Insufficient RSV data

    A recent CNN story by Deidre McPhillips and Jacqueline Howard explains how data gaps have hindered preparation for the current RSV surge. The reporters explain that the CDC’s RSV data are “based on voluntary reporting from a few dozen labs that represent about a tenth of the population.” The CDC uses these reports to provide weekly estimates about RSV cases, though recent data tend to be incomplete due to reporting delays.

    Here’s a helpful quote from the story (though I recommend reading the whole piece):

    “For hospitals [using CDC data], it’s a little like looking through the rearview mirror. They’ve already begun to experience that uptick in cases themselves before it’s noticeable in the federal data,” said Nancy Foster, vice president for quality and patient safety with the American Hospital Association.

    “We’re talking about data that are collected inside hospitals, transmitted through a data trail to get to the federal government, analyzed there and then fed back to hospitals.”

    In other words, it’s not surprising that we saw plenty of stories about higher-than-normal RSV cases in children’s hospitals before national data actually picked up the surge. For more details on why RSV is spreading this fall and how it’s impacting children’s hospitals, I recommend this piece by Jonathan Lambert at Grid.

    Insufficient flu data

    Meanwhile, this year’s flu season is clearly starting earlier than normal; but current data aren’t able to tell us how severe the season might get or who, exactly, is being hit the hardest. According to the CDC’s flu surveillance report for this week, the agency estimates that the U.S. has seen “at least 880,000 flu illnesses, 6,900 hospitalizations, and 360 deaths from flu” so far this fall.

    The CDC’s estimates come from networks of testing labs, hospitals, and outpatient healthcare providers that participate in the agency’s flu surveillance networks. National flu data tend to be imprecise estimates, clearly labeled as “preliminary” by the CDC, while state-by-state data are estimates reported with delays. Note, for example, that the CDC’s map of “influenza-like-activity” by state and by metro area provides only general categories of activity (ranging from “minimal” to “very high”) rather than actual case numbers.

    The flu data we have so far aren’t sufficient for making predictions about how the rest of this fall and winter will go, explains STAT’s Helen Branswell in a recent story. “The virus is maddeningly unpredictable,” she writes. U.S. experts often look to the flu season in the Southern Hemisphere, which precedes ours, for clues, but this can be unreliable (just as the U.S. shouldn’t rely on other countries for all its vaccine effectiveness data).

    For both flu and RSV, one major problem with our surveillance methods is that our systems overly rely on healthcare centers. When public health agencies have to wait for hospitals and clinics to report cases of these viruses before starting to analyze data, they miss the opportunity to warn healthcare providers at the very beginning of a surge—and give them time to prepare.

    In the future, expanding non-clinical surveillance methods like wastewater and population surveys to these diseases would provide more data, more quickly; both for healthcare providers and for the general public. (I provided some more specific ideas here.)

    Existing sources

    With all the above caveats in mind, here are a few sources you can look at to track flu and RSV:

    • CDC’s weekly flu surveillance report: This page is updated once a week with national estimates of flu activity, hospitalizations, flu virus variants, and more. Data tend to be preliminary.
    • CDC’s FluView dashboard: Information from the CDC’s flu surveillance system also appears on this dashboard in a more interactive format; for example, you can see how flu activity by state has changed over time.
    • CDC’s RSV trends report: Similar to its flu reports, the CDC provides weekly updates of estimated RSV tests and cases, including national, regional, and state-by-state trends.
    • Walgreens flu index: Walgreens tracks prescriptions for antiviral medications at its pharmacies as a proxy for flu activity, by state and for select metro areas. For more information on the index, see this press release.
    • WastewaterSCAN: The SCAN network, run by researchers at Stanford University and Emory University, tests wastewater for flu, RSV, and monkeypox in addition to COVID-19 in select counties across the U.S. So far, this network is the first I know of to publicly share flu and RSV wastewater data, though other researchers are working in this area.

    Please let me know if I missed any data sources! (You can email me or comment below.)

    More federal data

  • Sources and updates, May 29

    • New Surgeon General advisory on health worker burnout: This week, U.S. Surgeon General Dr. Vivek Murthy released a new advisory on COVID-19 burnout among health workers, summarizing research on the issue and highlighting it as a public health priority. The advisory discusses a variety of societal, cultural, structural, and organizational factors contributing to health worker burnout, while tying this burnout to growing shortages of doctors and other health professionals. From the one-page summary of the advisory: “If not addressed, the health worker burnout crisis will make it harder for patients to get care when they need it, cause health costs to rise, hinder our ability to prepare for the next public health emergency, and worsen health disparities.”
    • CDC may change COVID-19 reporting for hospitals: The CDC is planning a few changes to its reporting requirements for hospitals in order to simplify the reporting process and cut down on redundant information, according to a draft plan shared with Bloomberg. Among the changes: hospitals may no longer be required to report suspected COVID-19 cases (i.e. those cases not yet confirmed with a PCR test); with most hospitals testing all patients when they’re admitted, suspected cases are less common and the data are less useful than they had been at earlier points in the pandemic. The CDC may also stop requiring COVID-19 reporting from some types of facilities, such as mental health centers, and may change the frequency of required reporting.
    • New preprint about Omicron BA.4 and BA.5: While the U.S. mostly worries about BA.2.12.1, additional Omicron subvariants BA.4 and BA.5 have been spreading in South Africa and other countries. A new study from a highly-regarded consortium of Japanese researchers suggests that BA.4 and BA.5 are about 20% more transmissible than BA.2 (similarly to BA.2.12.1). Also, even more concerning: the researchers found that BA.4 and BA.5 are more capable of resisting protection from a prior Omicron infection than BA.1. While the study has not yet been peer-reviewed, it garnered a lot of attention on Twitter this week from scientists warning that we need to watch out for these subvariants.
    • U.S. gets closer to a vaccine for kids under five: The FDA has set new dates for its vaccine advisory committee to review data on COVID-19 vaccines for children under age five: the committee will discuss both Moderna’s and Pfizer’s under-five vaccines on June 15, after discussing Moderna’s vaccine for children ages six to 17 on June 14. This announcement came after Pfizer and BioNTech released new data on their under-five vaccine, saying that a series of three doses provided strong protection against severe disease. There are some caveats for the data (which were shared via press release), but this is great news for children under age five and their families.
    • NIH sharing some COVID-19 technology (but not patents): I missed this news from earlier in May: the National Institutes of Health has made a deal with the World Health Organization’s COVID-19 Technology Access Pool and the Medicines Patent Pool to lisense 11 technologies used in COVID-19 vaccines and therapeutics. This lisense will allow pharmaceutical manufacturers around the world to make the coronavirus spike protein, RNA virus tests, and other COVID-19 components, increasing access to these technologies in low- and middle-income countries. Of course, it would be better for these countries if the NIH had shared full vaccine patents, but apparently that’s asking too much.

  • Sources and updates, May 15

    • COVID-19 deaths that could’ve been prevented with vaccines: A new analysis from the Brown University School of Public Health suggests that almost 319,000 U.S. COVID-19 deaths could have been avoided if all adults had gotten vaccinated against the disease. This number differs significantly by state; there were 29,000 preventable COVID-19 deaths in Florida, compared to under 300 in Vermont. For more context on the analysis, see this article in NPR.
    • CDC dashboard in Spanish: The CDC has translated its COVID-19 Data Tracker into Español. At a glance, the Spanish version appears to include all the major aspects of the tracker: cases, deaths, vaccinations, community transmission, variant prevalence, wastewater, etc. Of course, it would have been great if the agency could’ve devoted resources to this translation effort well below spring 2022, when the number of people looking to the agency for COVID-19 guidance is pretty low.
    • CDC may lose access to COVID-19 data: According to reporting from POLITICO, the CDC and other national health agencies may no longer have the authority to require COVID-19 data reporting from states and individual health institutions if the Biden administration allows the country’s federal pandemic health emergency to end this summer. Such a change in authority could lead to the CDC (and numerous other researchers across the country) losing standardized datasets for COVID-19 hospitalizations, transmission in nursing homes, PCR testing, and other key metrics. Considering that hospitalizations are considered the most reliable metric right now, this could be a major blow.
    • COVID-19 testing declines globally: Speaking of losing reliable data: this report from the Associated Press caught my eye. The story, by Laura Ungar, explains that the U.S. is not the only country to see a major decrease in reported COVID-19 tests (a.k.a. Lab-based PCR, not at-home rapid tests) in recent months. “Experts say testing has dropped by 70 to 90% worldwide from the first to the second quarter of this year,” Ungar writes, “the opposite of what they say should be happening with new omicron variants on the rise in places such as the United States and South Africa.”
    • More promising data on Moderna kids’ vaccine: While Pfizer’s vaccine for children under five remains in development, Moderna continues to release data suggesting that this company is further ahead in providing protection for the youngest age group. This week, Moderna announced a half-dose of its vaccine provides a “strong immune response” in children ages six to 11; the announcement was backed up by a scientific study published in the New England Journal of Medicine (so, more rigorous than your typical press release). The FDA is currently evaluating a version of Moderna’s vaccine for children between ages six months and six years.

  • All the U.S.’s COVID-19 metrics are flawed

    All the U.S.’s COVID-19 metrics are flawed

    This week, I had a big retrospective story published at FiveThirtyEight: I looked back at the major metrics that the U.S. has used to track COVID-19 over the past two years—and how our country’s fractured public health system hindered our use of each one.

    The story is split into seven sections, which I will briefly summarize here:

    • Case counts, January to March 2020: Early on in the pandemic, the U.S. had a very limited picture of COVID-19 cases due to our very limited testing: after rejecting a test made by the WHO, the CDC made its own test—which turned out to have contamination issues, further slowing down U.S. testing. In early March 2020, for example, the majority of cases in NYC were identified in hospitals, suggesting that official counts greatly underestimated the actual numbers of people infected.
    • Tests administered, March to September 2020: Test availability improved after the first wave of cases, with organizations like the COVID Tracking Project keeping a close eye on the numbers. But there were a lot of challenges with the testing data (like different units across different states) and access issues for Americans with lower socioeconomic status.
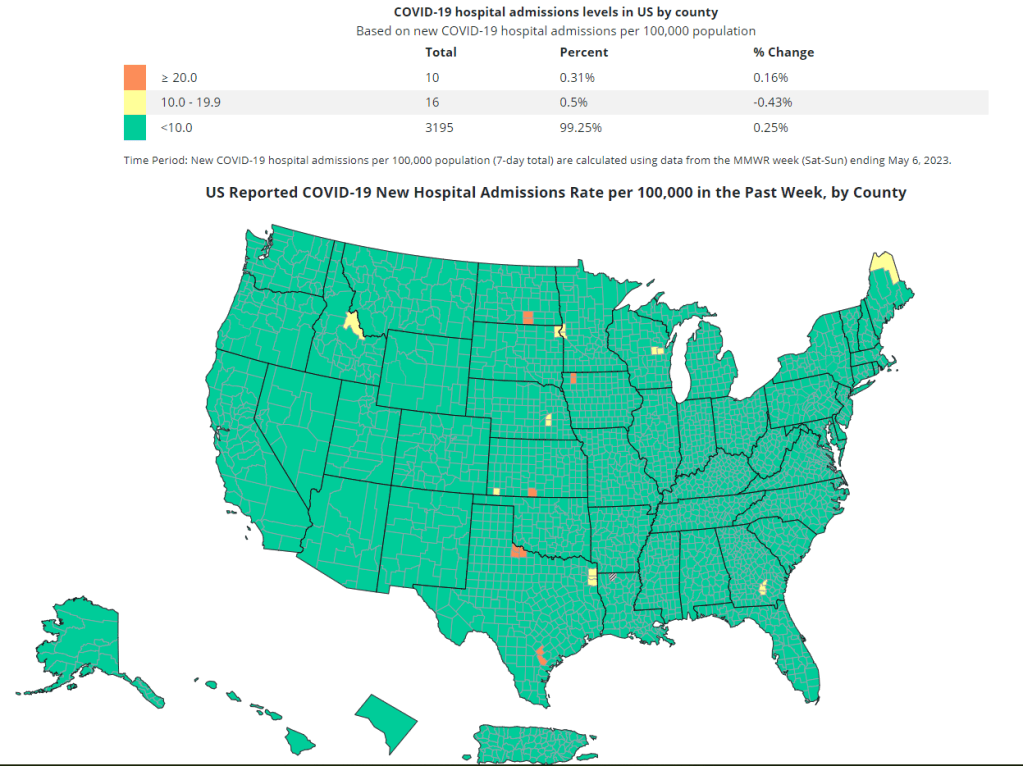
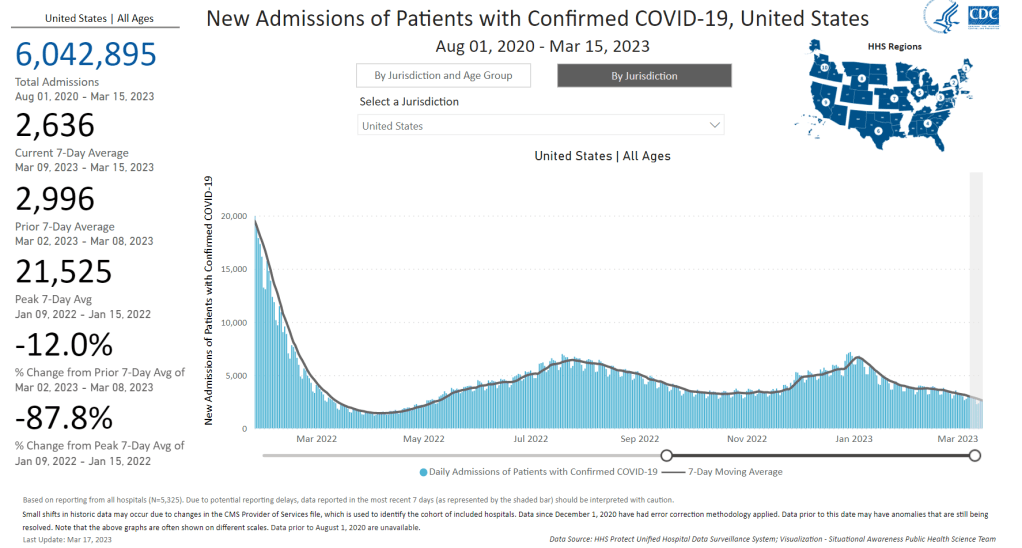
    • Hospitalizations, October to December 2020: By late 2020, many researchers and journalists were considering hospitalizations to be a more reliable COVID-19 metric than cases. But it took a long time for hospitalization data to become reliable on a national scale, as the HHS launched a new tracking system in the summer and then took months to work out kinks in this system.
    • Vaccinations, January to June 2021: When the vaccination campaign started in late 2020, it was “tempting to forget about all other COVID-19 metrics,” I wrote in the story. But the U.S.’s fractured system for tracking vaccinations made it difficult to analyze how close different parts of the country were to prospective “herd immunity,” and distracted from other public health interventions that we still needed even as people got vaccinated.
    • Breakthrough cases, July to November 2021: The Delta surge caused widespread infections in people who had been vaccinated, but the CDC—along with many state public health agencies—was not properly equipped to track these breakthrough cases. This challenge contributed to a lack of good U.S. data on vaccine effectiveness, which in turn contributed to confusion around the need for booster shots.
    • Hospitalizations (again), December to January 2022: The Omicron surge introduced a need for more nuance in hospitalization data, as many experts asked whether COVID-19 patients admitted with Omicron were actually hospitalized for their COVID-19 symptoms or for other reasons. Nuanced data can be useful in analyzing a variant’s severity; but all COVID-related hospitalizations cause strain on the healthcare system regardless of their cause.
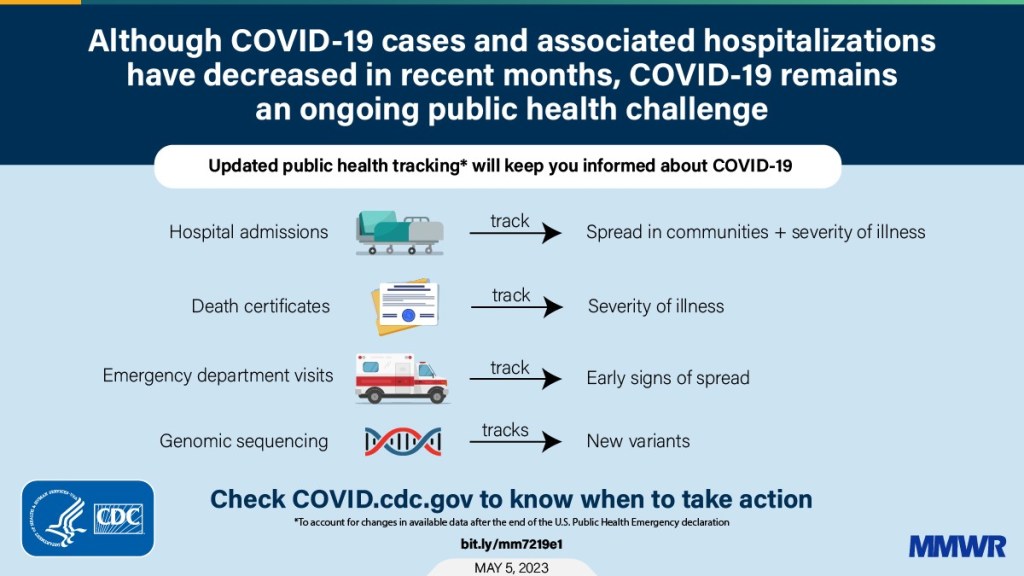
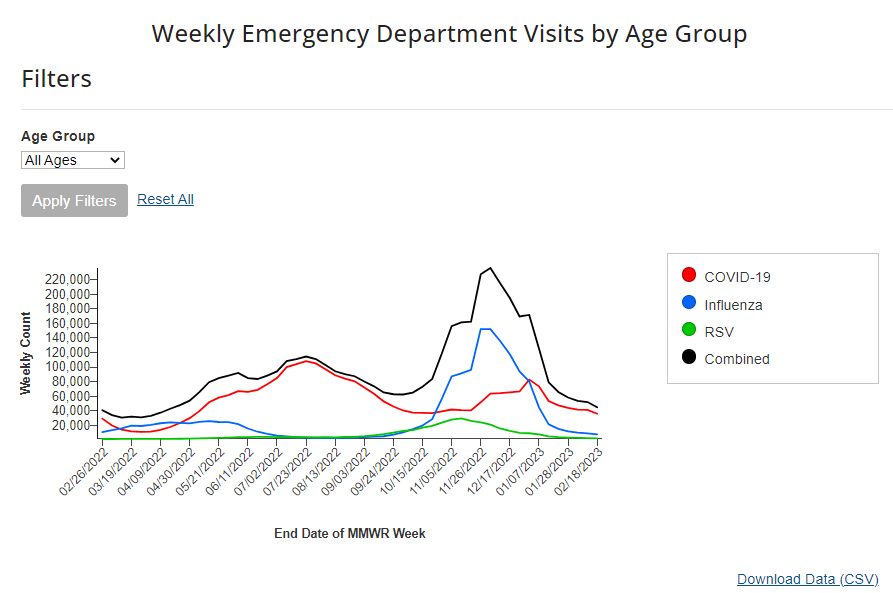
    • New kinds of data going forward: In our post-Omicron world, a lot of public health agencies are shifting their data strategies to treat COVID-19 more like the flu: less tracking of individual cases, and more reliance on hospitalization data, along with newer sources like wastewater. At this point in the pandemic, we should be fortifying data systems “for future preparedness,” I wrote, rather than letting the systems we built up during the pandemic fall to the wayside.

    I did a lot of reporting for this piece, including interviews with some of the U.S.’s foremost COVID-19 data experts and communicators. As long as the piece is, there were a lot of metrics (and issues with these metrics) that came up in these interviews that I wasn’t able to include in the final story—so I wanted to share some bonus material from my reporting here.

    Long COVID:

    As I’ve discussed in previous issues, the U.S. has done a terrible job of collecting data on Long COVID. The NIH estimates that this condition follows a significant share of coronavirus infections (between 10% and 30%), but we have limited information on its true prevalence, risk factors, and strategies for recovery.

    Here’s Dr. Eric Topol, the prolific COVID-19 commentator and director of the Scripps Research Translational Institute, discussing this data problem:

    [Long COVID has] been given very low priority, very little awareness and recognition. And we have very little data to show for it, because it hasn’t been taken seriously. But it’s a very serious matter.

    We should have, early on, gotten at least a registry of people —a large sample, hundreds of thousands of people prospectively assessed, like is being done elsewhere [in the U.K. and other countries]. So that we could learn from them: how long the symptoms lasted, what are the symptoms, what are the triggers, what can be done to avoid it, the role of vaccines, the role of boosters, all this stuff. But we have nothing like that.

    The NIH’s RECOVER initiative may answer some of these questions, but it will take months—if not years—for the U.S. to actually collect the comprehensive data on Long COVID that we should have started gathering when the condition first began gaining attention in 2020.

    Demographic data:

    In the testing section of the story, I mention that the U.S. doesn’t provide much demographic data describing who’s getting tested for COVID-19. There is actually a little-known provision in the CARES Act that requires COVID-19 testing providers to collect certain demographic data from all people who seek tests. But the provision is not enforced, and any data that are collected on this subject aren’t making it to most state COVID-19 dashboards, much less to the CDC’s public data dashboard.

    Here’s Dr. Ellie Murray, an epidemiologist at the Boston University School of Public Health, discussing why this is an issue:

    We don’t collect reason for seeking a test. We don’t collect age, race, ethnicity, occupation of people who seek a test. Those kinds of things could provide us with some really valuable information about who is getting tested, when, and why—that could help us figure out, what are the essential occupations where people are having a lot of exposures and therefore needing to get a lot of tests? Or are there occupations where we’re seeing a lot of people end up in hospital, who have those occupations, but they’re not getting tests, because actually, the test sites are nowhere near where they need to work, or they don’t have the time to get there before they close.

    And so we don’t really know who is getting tested, and that, I think, is a bigger problem, than whether the numbers that are being tested tell us anything about the trajectory of COVID. Because we have case data, and hospitalization data, and death data to tell us about the trajectory. And the testing could really tell us more about exposure, and concern, and access—if we collected some more of this data around who is getting tested and why.

    Test positivity:

    Speaking of testing: another metric that I didn’t get into much in the story was test positivity. Test positivity—or, the share of COVID-19 tests that return a positive result—has been used from the CDC to local school districts as a key metric to determine safety levels. (For more on this metric, check out my FAQ post from this past January.)

    But even when it’s calculated correctly, test positivity faces the same challenges as case data: namely, bias in who’s getting tested. Here’s Lauren Ancel Meyers, director of the University of Texas at Austin’s COVID-19 Modeling Consortium, explaining this:

    Test positivity is just as fraught [as cases]. It’s just as difficult, because you need to know the numerator and the denominator—what’s influencing the numerator and the denominator? Who is going to get tested, who has access to tests? … It used to be, at the very beginning [of the pandemic], nobody could get a test who wanted a test. And now, today, everybody has a test in their medicine cabinet, and they don’t get reported when they test. It’s different issues that have ebbed and flowed throughout this period.

    Often, if you’re a good data analyst or a modeler, and you have all the information, you can handle those kinds of biases. But the problem is, we don’t know the biases from day to day. And so even though there are statistical tools to deal with incomplete bias, without knowing what those biases are, it’s very hard to do reliable inference, and really hard to understand what’s actually going on.

    Genetic surveillance:

    Also related to testing: genetic surveillance for coronavirus variants of concern. Genetic surveillance is important because it can help identify new variants that may be more transmissible or more likely to evade protection from vaccines. It can additionally help track the qualities of concerning variants once they are identified (if variant data is linked to hospitalization data, vaccination data, and other metrics—which is not really happening in the U.S. right now.)

    Our current genetic surveillance systems have a lot of gaps. Here’s Leo Wolansky, from the Rockefeller Foundation’s Pandemic Prevention Institute (PPI), discussing how his organization seeks to address these challenges:

    [We’re trying to understand] where our blind spots are, and the bias that we might experience with a lot of health system reporting. One of the things that PPI has been doing is identifying centers of excellence in different parts of the world that can improve the sequencing of new cases in underrepresented countries. And so for example, we’ve provided quite a bit of support to the folks in South Africa that ultimately rang the alarm on Omicron.

    We’re also doing this by actually trying to systematically assess countries’ capacity for this type of genomic surveillance. So thinking about, how many tests have been recorded? What’s that test positivity rate? Do we have confidence in the basic surveillance system of the country? And then, do we also see enough sequences, as well as sequencing facility data, to demonstrate that this country can sequence and just isn’t doing enough—or cannot sequence because it needs foundational investment in things like laboratories and devices. We’ve been mapping this capacity just to make sure that we understand where we should be investing as a global community.

    The Pandemic Prevention Institute is taking a global perspective in thinking about data gaps. But these gaps also exist within the U.S., as is clear when one looks at the differences in published coronavirus sequences from state to state. Some states, like Wyoming, Vermont, and Colorado, have sequenced more than 10% of their cumulative cases, according to the CDC. Others, like Oklahoma, Iowa, and South Dakota, have sequenced fewer than 3%. These states need additional investment in order to thoroughly monitor coronavirus transmission among their residents.

    Cohort studies:

    In a cohort study, researchers follow a group of patients over time in order to collect long-term data on specific health conditions and/or the outside factors that influence them. The U.S. has set up a few cohort studies for COVID-19, but they haven’t been designed or utilized in a way that has actually provided much useful data—unlike cohort studies in some other countries. (The U.K., for example, has several ongoing cohort studies collecting information on COVID-19 symptoms, infections in schools, seroprevalence, and more.)

    Here’s Dr. Ellie Murray explaining the lost potential of these studies in the U.S.:

    There are a number of existing cohort studies that have been asked or who asked to pivot to collecting COVID information and therefore collecting long-term COVID information on their cohorts. But there doesn’t seem to be any kind of system to [determine], what are the questions we need answered about COVID from these kinds of studies? And how do we link up people who can answer those questions with the data that we’re collecting here, and making sure we’re collecting the right data? And if this study is going to answer these questions, and this one is going to answer those questions—or, here’s how we standardize those two cohorts so that we can pull them together into one big COVID cohort.

    And so, we end up in this situation where, we don’t know what percent of people get Long COVID, even though we’ve been doing this for over two years. We don’t even really know, what are all the different symptoms that you can get from COVID? … There are all these questions that we could be sort-of systematically working our way through, getting answers and using them to inform our planning and our response. [In addition to having] standardized questions, you also need a centralized question, instead of just whatever question occurs to someone who happens to have the funding to do it.

    Excess deaths:

    Excess deaths measure the deaths that occur in a certain region, over a certain period of time, above the number of deaths that researchers expect to see in that region and time period based on modeling from past years’ data. Excess deaths are the COVID-19 metric with the longest lag time: it takes weeks from initial infection for someone to die of the disease, and can take weeks further for a death certificate to be incorporated into the public health system.

    Once that death information is available, however, it can be used to show the true toll of the pandemic—analyzing not just direct COVID-19 deaths, but also those related to isolation, financial burden, and other indirect issues—as well as who has been hit the hardest.

    Here’s Cecile Viboud, a staff scientist at the NIH who studies infectious disease mortality, discussing this metric:

    We’ve been using the excess death approach for a long time. It comes from flu research, basically starting in 1875 in the U.K. And it was used quite a lot during the 1918 pandemic. It can be especially good in examining historical records where you don’t have lab confirmation—there was no testing ability back in those days…

    So, I think it’s kind of natural to use it for a pandemic like COVID-19. Very early on, you could see how useful this method was, because there was so little testing done. In March and April 2020, you see substantial excess, even when you don’t see lab-confirmed deaths. There’s a disconnect there between the official stats, and then the excess mortality… [We can also study] the direct effect of COVID-19 versus the indirect effect of the pandemic, like how much interventions affected suicide, opioids, death, accidents, etc. The excess approach is also a good method to look at that.

    Viboud also noted that excess deaths can be useful to compare different parts of the U.S. based on their COVID-19 safety measures. For example, one can analyze excess deaths in counties with low vaccination rates compared to those with high vaccination rates. This approach can identify the pandemic’s impact even when official death counts are low—an issue that the Documenting COVID-19 project has covered in-depth.

    Again, you can read the full FiveThirtyEight story here!

    More federal data