Tag: genomic sequencing

  • All variant data are weeks old

    All variant data are weeks old

    It takes three to four weeks for data on a variant COVID-19 case to be made public. I have been quietly stressing out about this fact for about a month, since I learned it from Will Lee, VP of science at the genomics company Helix.

    I talked to Lee for a recent Science News piece on the drivers and demographic patterns of the U.S.’s April rise in COVID-19 cases. During our conversation, he shared many details of Helix’s coronavirus sequencing process; most of this information was too technical for me to include in my Science News story, but in the COVID-19 Data Dispatch, I can get as technical as I want.

    Here’s an excerpt from our interview, following my question: What is the turnaround time for sequencing? How does it compare to getting a PCR test result?

    It is much, much slower. The median time from collection to [PCR] results, it’s varied quite a bit over time, but I think right now, for many labs, it’s less than 48 hours. And so what we do is, after the test result is done—we’re only picking from positive tests, obviously, for sequencing—so we would select the sample, probably somewhere on the order of two to three days after the sample is collected, after the test result is reported.  From then, I’d say there’s probably seven to ten days before the sequencing result is available…

    What happens is, we do the [PCR] test result, we send it out for sequencing. The turnaround time for sequencing—I’d say in a good case, it’s in the seven to eight day timeframe, sometimes it’s longer than that. There’s an additional holdback on the data before we make it publicly available, because the CDC wants to make sure that public health agencies have time to act on the information first, if it turns out [the case is] someone in their jurisdiction who’s identified to have a variant of concern. That’s potentially another week, depending on how fast they [the local public health agency] act.

    And then there’s additionally a lag for when you submit to somewhere like GISAID, and however long it takes them to do their review process and publish it. You add it all together, and you end up with something like 3-4 weeks [from test sample collection to sequence publication].

    So, let’s recap. Here’s what it takes to sequence and report a coronavirus variant case:

    1. PCR test: 1-2 days
    2. The testing company selects the positive test sample for sequencing: 1-2 days
    3. Genomic sequencing takes place: 7-10 days
    4. Local public health department gets notified, uses the sequencing results for contact tracing: Up to one week
    5. Sequence is submitted to a public repository: Possibly another 1-2 weeks

    When you add all this up, it’s no surprise that the most recent variant data on the CDC’s COVID Data Tracker are as of April 10, almost four weeks ago. I’m focusing on this process today because I believe the data lag is worth emphasizing. When you see a news report about B.1.1.7 or another variant, remember that the data took several weeks to get from test sample to newspaper.

    In other words, when the CDC tells us that B.1.1.7 now makes up about 60% of new cases in the U.S., remember that this number is a snapshot from a month ago. The true number as of today, May 9, is likely far higher.

    My interview with Will Lee inspired me to look at lag times for other common variant data sources. Let’s compare:

    • CDC’s Variant Proportions page, data from the national genomic surveillance program: Lag of 2-4 weeks, depending on how far away one is from an update when checking the page. (The CDC updates this page every two weeks.)
    • Helix’s Surveillance Dashboard, data from the company’s testing sites: Lag of 3-4 weeks. As of May 8, Helix is reporting B.1.1.7 sequence data as of April 15 and SGTF data as of late April. (SGTF, or S gene target failure, is a coronavirus mutation which usually indicates that a case is B.1.1.7-caused.)
    • Nextstrain dashboard, data from GISAID: Lag of 1-2 weeks. When I looked at Nextstrain’s coronavirus page yesterday, the most recent available sample sequences were collected on May 1 and the global variant frequencies chart ended at April 27.
    • CoVariants dashboard, data from Nextstrain/GISAID: Lag of 2-4 weeks, depending on the country. As of May 8, CoVariants reports data from the week of April 19 for some countries with more robust sequencing programs (U.S., U.K., etc.) and data from the week of April 5 for others.

    Nextstrain and CoVariants, both of which are powered by the public sequence repository GISAID, have more recent data than the CDC—likely because academic labs can submit sequences to GISAID without waiting on public health departments. Helix has a lag similar to the CDC’s because its partnerships require the company to submit sequences to public health departments before releasing the information publicly. Some state public health departments report variant data of their own, but this is often done in press releases rather than regular dashboard updates.

    Now, bearing in mind that the variant data are all weeks old, what are the most recent variant numbers for the U.S.? And why should we be worried about these variants?

    Here’s a status check on the major variants I’m watching:

    • B.1.1.7 (first identified in the U.K.): Causing about 60% of cases nationwide as of April 10. Among the states where the CDC reports variant data, it’s most prevalent in Tennessee (74%), Michigan (71%), Minnesota (68%), Georgia (65%), and Florida (63%). This variant is concerning because it spreads a lot more easily than older coronavirus variants; estimates range from 40% to 70% more transmissible.
    • B.1.526 (first identified in New York City): Causing about 12% of cases nationwide as of April 10. This variant is also likely more transmissible, but a recent CDC report suggests that it does not lead to more severe disease or increased risk for vaccine breakthrough cases. B.1.526 has yet to be classified nationally as a variant of concern, so the CDC isn’t publishing state-by-state data for it. (But if you live in NYC, check out this Gothamist article for ZIP code-level prevalence data.)
    • B.1.427/B.1.429 (first identified in California): Causing about 6% of cases nationwide as of April 10. I suspect the pair may be getting outcompeted by B.1.1.7, as it was representing closer to 10% of cases in a previous CDC reporting period—it’s more transmissible than the wildtype coronavirus, but not as transmissible as B.1.1.7 . This variant pair is most prevalent in California (38%), Arizona (28%), and Colorado (24%).
    • P.1 (first identified in Brazil): Causing about 4% of cases nationwide as of April 10. This variant has been tied to surges in Brazil and other South American countries; it’s more transmissible, associated with a higher death rate, and can reinfect patients who already recovered from COVID-19. While it currently represents a fairly small share of U.S. cases, computational biologist Trevor Bedford recently pointed out that P.1. “has been undergoing more rapid logistic growth in frequency” compared to other variants.
    • B.1.351 (first identified in South Africa): Causing about 1% of cases nationwide as of April 10. Soon after it was identified last December, the COVID-19 vaccines were shown to be less effective against this variant. But “less effective,” for the mRNA vaccines, is still pretty damn effective, as this recent study from Qatar demonstrates.
    • B.1.617 (first identified in India): Not yet represented in CDC data, but it’s been identified in several U.S. states over the course of April and May. This variant is strongly tied to India’s recent surge. While you may see it called a “double variant” because it has mutations at two key coding sequences, B.1.617 doesn’t actually have double the transmission bump or double the severity of older coronavirus variants, as explained here by epidemiologist Katelyn Jetelina.

    It’s also worth emphasizing that genomic sequencing is still not conducted evenly across the country. The CDC releases state-by-state variant prevalence data for states which have submitted more than 300 coronavirus sequences in a four-week period. As of April 10, only half of the states have met this benchmark; many states in the Midwest and South still aren’t represented in the CDC’s data.

    I am considering adding a variant data annotations page to the CDD website, in order to more consistently keep track of all the different info sources on these lineages. Would you use this page? What information would you like to see there? Shoot me an email (betsy@coviddatadispatch.com) or leave a comment here on the website to let me know.

    More variant reporting

    • CDC stepped up sequencing, but the data haven’t kept pace

      CDC stepped up sequencing, but the data haven’t kept pace

      If the U.S. does see a fourth surge this spring, one of the main culprits will be variants. Three months after the first B.1.1.7-caused case was detected in this country, that variant now causes about one third of new COVID-19 cases nationwide. The B.1.1.7 variant, first detected in the U.K., spreads more readily and may pose a higher risk of hospitalization and death.

      Meanwhile, other variants have taken root. There’s the variant that originated in California, B.1.427/B.1.429, which now accounts for over half of cases in the state. There’s the variant that originated in New York City, B.1.526, which is quickly spreading in New York and likely in neighboring states. And there’s the variant that originated in Brazil, P.1; this variant has only been identified about 200 times in the U.S. so far, but it’s wreaking havoc in Brazil and some worry that it may be only a matter of time before we see it spread here.

      The thing about viral variants—especially those more-transmissible variants—is, they’re like tribbles. They might seem innocuous at first, but if left to multiply, they’ll soon take over your starship, eat all your food, and bury you in the hallway. (If you didn’t get that reference, watch this clip and then get back to me.) The only way to stop the spread is to first, identify where they are, and then use the same tried-and-true COVID-19 prevention measures to cut off their lineages. Or, as Dr. McCoy puts it: “We quit feeding them, they stop breeding.”

      In the U.S., that first part—identify where the variants are—is tripping us up. The CDC has stepped up its sequencing efforts in a big way over the past few months, going from 3,000 a week in early January to 10,000 a week by the end of March. But data on the results of these efforts are scarce and uneven, with some states doing far more sequencing than others. New York City, for example, has numerous labs frantically “hunting down variants,” while many less-resourced states have sequenced less than half a percent of their cases. And the CDC itself publishes data with gaping holes and lags that make the numbers difficult to interpret.

      The CDC has three places you can find data on variants and genomic sequencing; each one poses its own challenges.

      First, there’s the original variant data tracker, “US COVID-19 Cases Caused by Variants.”  This page reports sheer numbers of cases caused by three variants of concern: B.1.1.7 (U.K. variant), B.1.351 (South Africa variant), and P.1 (Brazil variant). It’s updated three times a week, on Tuesdays, Thursdays, and Sundays—the most frequent schedule of any CDC variant data.

      But the sheer numbers of cases reported lack context. What does it mean to say, for example, the U.S. has about 12,500 B.1.1.7 cases, and 1,200 of them are in Michigan? It’s tricky to explain the significance of these numbers when we don’t know much sequencing Michigan is doing compared to other states.

      This dataset is also missing some pretty concerning variants: both the B.1.526 (New York) and B.1.427/B.1.429 (California) variants are absent from the map and state-by-state table. According to other sources, these variants are spreading pretty rapidly in their respective parts of the country, so there should be case numbers reported to the CDC—it’s unclear why the CDC hasn’t yet made those numbers public.

      (To the CDC’s credit, the California variant was recently reclassified as a “variant of concern,” and Dr. Walensky said at a press briefing this week that the New York variant is under serious investigation to get that same reclassification bump. But that seems to be a long process, as it hasn’t happened weeks after the variant emerged.)

      Second, there’s the variant proportions tracker, which reports what it sounds like: percentages, representing the share of COVID-19 cases that CDC researchers estimate are caused by different coronavirus variants. The page includes both national estimates and state-by-state estimates for a pretty limited number of states that have submitted enough sequences to pass the CDC’s threshold.

      I wrote about this page when it was posted two weeks ago, calling out the stale nature of these data and the lack of geographic diversity. There’s been one update since then, but only to the national variant proportions estimates; those numbers are now as of March 13 instead of February 27. The state numbers are still as of February 27, now over a month old.

      Note that Michigan—the one state everyone’s watching, the state that has reported over 1,000 B.1.1.7 cases alone—is not included in the table. How are we supposed to use these estimates when they so clearly do not reflect the current state of the pandemic?

      !function(){“use strict”;window.addEventListener(“message”,(function(a){if(void 0!==a.data[“datawrapper-height”])for(var e in a.data[“datawrapper-height”]){var t=document.getElementById(“datawrapper-chart-“+e)||document.querySelector(“iframe[src*=’”+e+”‘]”);t&&(t.style.height=a.data[“datawrapper-height”][e]+”px”)}}))}();

      A third variant-adjacent data page, added to the overall CDC COVID Data Tracker this past week, provides a bit more context. This page provides data on published SARS-CoV-2 sequences provided by the CDC, state and local public health departments, and other laboratory partners. You can see the sheer number of sequenced cases grow by week and compare state efforts.

      It’s pretty clear that some states are doing more sequencing than others. States with major scientific capacity—Washington, Oregon, New York, D.C.—are near the top. Some states with smaller populations are also on top of the sequencing game: Wyoming, Hawaii, Maine. But 32 states have sequenced fewer than 1% of their cases in total, and 21 have sequenced fewer than 0.5%. That’s definitely not enough sequences for the states to be able to find pockets of new variants, isolate those transmission chains, and stop the breeding.

      !function(){“use strict”;window.addEventListener(“message”,(function(a){if(void 0!==a.data[“datawrapper-height”])for(var e in a.data[“datawrapper-height”]){var t=document.getElementById(“datawrapper-chart-“+e)||document.querySelector(“iframe[src*=’”+e+”‘]”);t&&(t.style.height=a.data[“datawrapper-height”][e]+”px”)}}))}();

      Chart captions state that the state-by-state maps represent cases sequenced “from January 2020 to the present,” while a note at the bottom says, “Numbers will be updated every Sunday by 7 PM.” So are the charts up to date as of today, April 4, or are they up to date as of last Sunday, March 28? (Note, I put simply “March 2021” on my own chart with these data.)

      Obviously, the lack of date clarity is annoying. But it’s also problematic that these are cumulative numbers—reflecting all the cases sequenced during more than a year of the pandemic. Imagine trying to make analytical conclusions about COVID-19 spread based on cumulative case numbers! It would simply be irresponsible. But for sequencing, these data are all we have.

      So, if anyone from the CDC is reading this, here’s my wishlist for variant data:

      • One singular page, with all the relevant data. You have a COVID Data Tracker, why not simply make a “Variants” section and embed everything there?
      • Regular updates, coordinated between the different metrics. One month is way too much of a lag for state-by-state prevalence estimates.
      • Weekly numbers for states. Let us see how variants are spreading state-by-state, as well as how states are ramping up their sequencing efforts.
      • More clear, consistent labeling. Explain that the sheer case numbers are undercounts, explain where the prevalence estimates come from, and generally make these pages more readable for users who aren’t computational biologists.

      And if you’d like to see more variant case numbers, here are a couple of other sources I like:

      • Coronavirus Variant Tracker by Axios, providing estimated prevalence for four variants of concern and two variants of interest, along with a varants FAQ and other contextual writing.
      • CoVariants, a tracker by virologist Emma Hodcroft that shows variant spread around the world based on public sequencing data. Hodcroft posts regular updates on Twitter.
      • Nextstrain, an open-source genome data project. This repository was tracking pathogens long before COVID-19 hit, and it is a hub for sequence data and other related resources.

      The U.S. has blown past its current sequencing goal (7,000 cases per week), but is aiming to ramp up to 25,000—and has invested accordingly. I hope that, in addition to ramping up all the technology and internal communications needed for this effort, the CDC also improves its public data. The virus is multiplying; there’s no time to waste.

      Related posts

      • New CDC page on variants still leaves gaps

        New CDC page on variants still leaves gaps

        This week, the CDC published a new data page about the coronavirus variants now circulating in the U.S. The page provides estimates of how many new cases in the country may be attributed to different SARS-CoV-2 lineages, including both more familiar, wild-type variants (B.1. and B.1.2) and newer variants of concern.

        This new page is a welcome addition to the CDC’s library, as their “Cases Caused by Variants” page only provides numbers of variant cases reported to the agency—which, as we have repeatedly stated at the CDD, represent huge undercounts.

        However, the page still has three big problems:

        First, the data are old. The CDC is currently reporting data for four two-week periods, the most recent of which ends February 27. That’s a full three weeks ago—a pretty significant lag when several “variants of concern” are concerning precisely because they are more infectious, meaning they can spread through the population more quickly.

        The CDC’s B.1.1.7 estimate (about 9% as of Feb. 27) particularly sticks out. CoVariants, a variant tracker run by independent researcher Emma Hodcroft, also puts B.1.1.7 prevalence in the U.S. at about 10% in late February… but estimates this variant accounts for 22% of sequences as of March 8. These estimates indicate that B.1.1.7 may have doubled its case counts in the two weeks after the CDC’s data stop.

        Second, the CDC data reveal geographic gaps in our current sequencing strategy. The CDC is providing state-by-state prevalence estimates for 19 select states—or, those states that are doing a lot of genomic sequencing. Of course, this includes big states such as California and New York, but excludes much of the Midwest and other smaller, less scientifically-endowed states.

        Michigan, that state currently facing a concerning surge, is not represented—even though the state has one of the highest raw counts of B.1.1.7 cases, as of this week. We can gather from a footnote that Michigan did not submit at least 300 sequences to the CDC between January 13 and February 13; still, this exclusion poses a challenge for researchers watching that surge.

        And finally, the data are presented in a confusing manner. When I shared this page with a couple of COVID Tracking Project friends on Friday, it took the group a lot of close-reading and back-and-forth to unpack those first two problems. And we’re all used to puzzling through confusing data portals! The CDC claims this page is an up-to-date tracker, “used to inform national and state public health actions related to variants,” but its data are weeks old and represent less than half of the country.

        The CDC needs to improve its communication of data gaps, lags, and uncertainties, especially on such an alarming topic as variants. And, of course, we need better variant data to begin with. The U.S. is aiming to sequence 25,000 samples per week, but that’s still far from the 5% of new cases we would need to sequence in order to develop an accurate picture of variant spread in the U.S.

        On that note: you may notice that we now have a new category for variant posts on the CDD website. I expect that this will continue to be a major topic for us going forward.

        Related posts

        • NYC variant looks like bad news

          In a press conference on Wednesday, NYC mayor Bill de Blasio confirmed that the recently identified NYC variant (since christened B-1526) is outpacing the original strain in spreading speed, and his senior advisor for Public Health, Dr. Jay Varma, said that these two variants combined account for 51% of all cases in the city.  This is coming from a preliminary analysis, and so far, they have not found that B-1526 is more deadly or that it may evade vaccine efficacy. However, it’s still worrying.

          It’s probably contributing to the relatively slower pace of decline in cases in NY versus the rest of the country: 

          And this comes when NYC is increasing indoor dining capacity to 50%, and when NY is going to scrap its rule on people from out of state having to quarantine on April 1. De Blasio has told New Yorkers to stay the course, but the people in charge (Andrew Cuomo) don’t seem to want to follow that advice.

        • What makes a successful semester during COVID-19?

          What makes a successful semester during COVID-19?

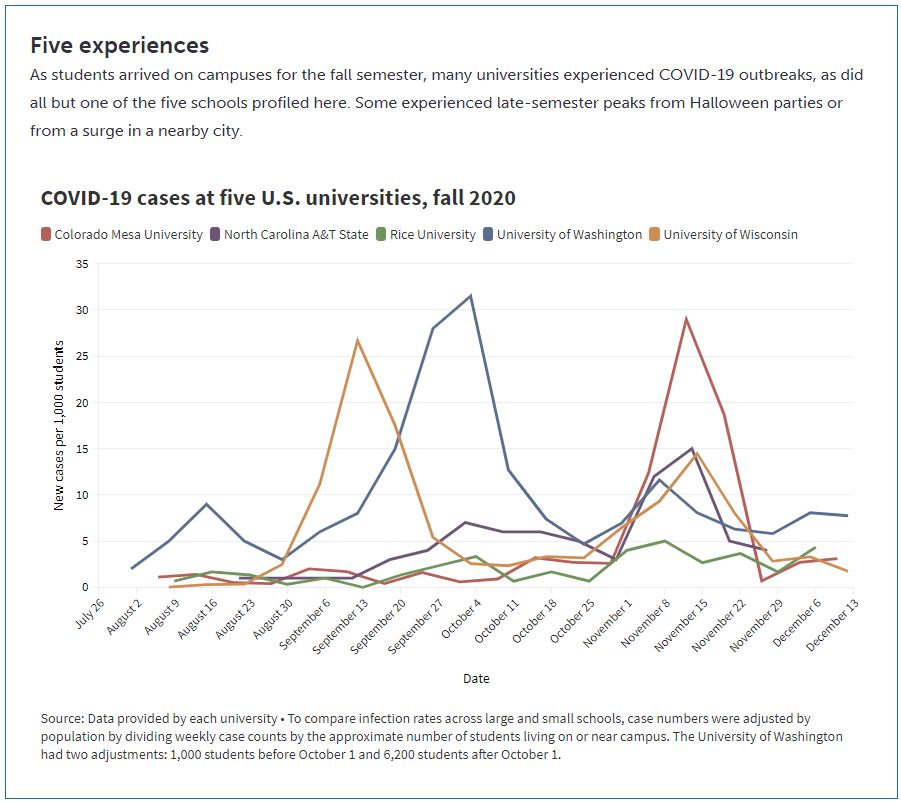
          Despite outbreak risks, a lot of colleges and universities brought their students back to campus during the fall 2020 semester. Everyone from epidemiologists to the students themselves asked: What worked, and what didn’t? How do we even measure success, when every campus is unique and every option is complicated?

          A lot of journalists have tried to answer these questions in the past few months. I took a crack at them in a feature for Science News, published this past Tuesday. My editor and I picked five universities, ranging from large state schools to small close-knit institutions. I graphed their cases and tests, attempting to determine both the drivers of campus outbreaks and how school leadership got them under control. And I spoke to administrators and students at each school who explained their campus’ approach to COVID-19 mitigation.

          Obviously, I want you to read the full story. Any institution trying to handle COVID-19 can learn valuable lessons from these universities, especially from those that got their students involved in the COVID-19 protection efforts—like Rice University, which set up a student-run court to judge those who broke safety rules, or North Carolina Agricultural & Technical University, which let students go live on Instagram while they got tested.

          But in the COVID-19 Data Dispatch this week, I wanted to share some bonus material. One of my favorite interviews that I did for this feature was with Dr. Pardis Sabeti, a computational geneticist at the Broad Institute of Harvard University and MIT. The Broad Institute helped over 100 colleges and universities set up COVID-19 testing and student symptom monitoring, most of them in New England. When I talked to Dr. Sabeti, though, she mostly spoke about Colorado Mesa University—a small school in Grand Junction, Colorado that saw it as a moral imperative to bring all of their students back to campus this fall.

          Dr. Sabeti told me all about why the Broad Institute and Colorado Mesa University (or CMU) were a great match, able to try out novel COVID-19 control efforts that many other schools didn’t consider. She also gave me her perspective on what makes a successful pandemic semester—spoiler, she has a pretty high bar.

          The interview below has been lightly edited and condensed for clarity.


          Betsy Ladyzhets: Tell me about how the Broad Institute started working on infectious disease management, and how that led to your current efforts with COVID-19.

          Pardis Sabeti: I do a lot of work in infectious diseases, mostly in West Africa. In 2014, Harvard University set up an outbreak surveillance committee that helped the school through all of these things around Ebola. And then, it was sort-of in-place, we had this committee of folks across the institution that were working together on outbreaks. 

          Then, in 2016, we got re-empaneled when there was a mumps outbreak at Harvard that ended up spreading across Massachusetts. We learned that yes, universities are laboratories for infectious disease spread, and Massachusetts has 110 of them.

          So, there was a lot going on there. We worked with the Mass. Department of Public Health and the higher ed consortium in Boston and we were really able to move things forward together, to cooperate, share data. We even found a transmission link between an outbreak—there was an outbreak in east Boston that happened in an unvaccinated community that was thought to be a separate outbreak, but then our genome sequencing data showed that it was firmly within the Harvard University cluster. And then additional case investigations showed that there were three members of that community that were Harvard affiliates, that were the likely links.

          When we did the genome sequencing, it showed us this idea that traditional epidemiology is very accurate. Whatever links the public health teams had found, we confirmed with genome sequencing. But they missed most of the transmissions. There were a lot of transmission events that were very obviously tied to each other but that the public health teams didn’t catch. 

          So at that point, we really doubled down on this idea of genome sequencing and genomic epidemiology being really important for understanding outbreaks. But then also, we understood that we needed to be very fast about doing outbreaks [sic]. What the rest of the world figured out during COVID, we figured out because of mumps—that we needed apps to essentially allow people to start sharing information about their symptoms, so people can get quick diagnoses.

          It was this funny thing where four people on my team all became infected while we were investigating the mumps outbreak with what looked like mumps. Each of them went to their own PCP [primary care provider], and their own PCP did a work-up, and you’re like—wait a second. Wouldn’t it be useful to know these four people are all in connection with each other? If one of them had a diagnosis, it would probably inform everyone else’s diagnosis.

          We created what’s now called Scout. It’s an app that allows you to share with your contacts what’s going on if you have an infection, allows people to quickly figure out what their diagnosis might be and to alert people. We weren’t thinking about it necessarily for pandemic reporting. We were just thinking, wouldn’t it be something handy, that next time you get sick, you immediately know what you have and what to do about it. Particularly since viral and bacterial infections need entirely different courses of action from people. Like, could we help everybody get informed? And then we also built Lookout, which is a dashboard that collects all that information and shows public health teams and administrators what’s going on.

          BL: Yeah, the CMU administrators I talked to talked about that [dashboard] a lot.

          PS: Yeah, which is great. We joke that CMU has one of the most sophisticated public health systems. The school can see, at this exquisite level, what the cases are, where they’re located. It’s really allowing you to do those investigations that most people I’ve seen elsewhere are doing on the back of an envelope.

          We [Broad] needed a place to work with that was going to be very collaborative and open. And so we were talking to a lot of different folks in different places, and everywhere there were different challenges of getting in the ground. And Colorado Mesa, to us, was this breath of fresh air. One, it was heartwarming to be working with this school in Colorado that has a large population of first-in-their-families-to-go-to-college students. And it was also empowering to hear the need that they had, the fact that they had to come back and they had to come back fully on campus because the students’ livelihoods and future success depended on it. And it was also heartwarming to see the way that the leadership was so engaged, so strong, so open, to anything.

          And also, like, the wastewater testing is being done by faculty and students in the engineering department. The clinical sample collection is being led by Amy Bronson and the nursing team. That’s a lot of what you want to see happening on college campuses. To me, the way I pitched it is, what we were building was the Facebook app for outbreaks that also needed to start with a close-knit community where you could get a lot of adoption. 

          But also, this idea that colleges are both high risk but also exactly where innovation can happen. It’s where people are ready to explore and try things out.

          I hadn’t seen that [mindset] at a lot of other schools. I saw this administrator, top-down, we’re gonna tell you how to behave and you’re gonna be in this room. A lot of schools got into a frame of like, we’re gonna manage these students, whereas CMU really was like, no, we’re going to partner with these brilliant students and figure this out together.

          In my mind, I was always perplexed, where we kept describing this year as this kind-of less-than year, where we were just going to suffer through education. In my mind, it was a more-than year. People learn the best when the stakes are the highest. There’s no other time we’re gonna teach kids about public health, infectious disease, genomics, and epidemiology than now. So we should shift what we’re trying to do. It shouldn’t be like, let’s get the Chaucer done while an outbreak is killing people in our community. We should’ve shifted our attention and all learned math, and stats, and clinical medicine, and public health, and biology around what’s going on.

          And that’s what CMU is doing. They’re hosting classes that are around outbreak response. The coaching teams and the sports teams are the ones doing contact tracing. It’s interesting, because it’s, in a way, it’s a school that doesn’t have all the resources where the ingenuity is going to happen. They can’t just call an outside consultant to do these things for them, they had to rely on themselves and the students.

          Did they show you the videos that they made?

          BL: I watched that “CMU is Back” one, which is great.

          PS: Yeah. They made many of them. They have a new song—I have to make a video later this afternoon for it.

          The fascinating thing is, right, even the art students got in on it and started doing public health messaging. I say, and it’s true—they already had me at the team. I just thought the team was so delightful and inspiring, but they sealed the deal with the video.

          What communities do you know that would make a video together? Most offices, they hate each other, everyone’s resentful and no one’s gonna make a video. In a lot of the schools that I know, there’s taglines that they hate the administration. There’s a fight between the administration and the students. Where here, it’s like, the administrators and the students got together and made a music video. They told me that they have a very close-knit culture and a trust in each other, that would make things go forward.

          And I’m sorry, I know this is very much my pitch for CMU, but I just love talking about this place. Here’s this thing where—did they show you the simulation that happened over Halloween weekend? Did they show you that data?

          BL: I think so, yeah.

          PS: It was the real-time where you’re seeing everybody clustering?

          BL: Oh yeah, yeah.

          PS: Yeah. What is fascinating about that whole scenario is that you had 358 students, voluntarily without any real advertisement from us, download an app that tracks all of their movements over Bluetooth, over Halloween weekend. And then proceeded to go out and do their thing. So here’s that kind-of interaction, and you’re seeing, minute-by-minute, the kind-of high resolution data that we’re getting on how students are interacting with each other. What clusters they’re forming, what times of day we need to watch out for for interactions. It’s pretty bananas.

          These students have an enormous number of contacts. This is the fear that you have with college students. Someone might look at [these data] and say, it’s terrible. But in other ways, it’s like, these kids trusted you enough to download an app, get themselves tracked, and go on and basically engage in behavior that they could get themselves thrown out. That’s trust in the leadership. That is what we need to be able to stop outbreaks.

          And then, the last piece I’ll say before I go off of my CMU storyline is… I’ve been trying in Massachusetts, for a long time, to get people to understand that you’re gonna spend millions. Each of these colleges are spending millions and millions of dollars on diagnostic testing on a daily basis or a weekly basis. That’s an incredible amount of tests that are being used with no hypothesis. Meanwhile, the surrounding communities are talking about seven days ‘til getting a test result, and standing in line for four hours for a test.

          That’s dangerous. I kept trying to convince a lot of the colleges that testing yourself in the middle of a shortage of tests looks selfish and is ineffective. Ultimately, the way that COVID spreads, one person can come into a room and infect 50 people. And so, the metaphor I use is, it’s like being in a drought with a fire alarm shortage, and putting all the fire alarms in your own house. You’ll be exquisitely good at detecting a fire when it hits your house, but at that point, it’s burning to the ground. What you should do is, you should get [the fire alarms], and you should put them in all your neighbors’ homes. For a wide stretch.

          Ultimately, what colleges should do is to support their communities’ testing, by reaching out and saying, okay, every faculty and staff and student, tell us who your contacts are, and have them tell us who their contacts are, and we will prioritize testing for those individuals. We’ll get them tested. That’s how the colleges should have interacted.

          And that really fell on deaf ears in general, there’s a variety of reasons for that. But Colorado Mesa doubled down. We [Broad] tried all these different models, like use 100% of your tests on yourself, use 100% of your tests on other people, or use 25%, 50%, 75%, those different groupings. And we found that the most effective way of stopping an outbreak is if you use 75% of your tests outside of the school. You keep 25% for yourself, but 75% should be used outside the school. That’s how you stop outbreaks on campus.

          We’re writing up that work right now, but even when we showed Colorado Mesa the preliminary data, they were like—that’s now their new model. It’s essentially what they’ve done. They’re putting the majority of their tests [in Grand Junction, the city around the school]. And to me, that’s going to be the really remarkable thing to watch going forward. We’ve created the apps, and the dashboards, and the systems to be able to do this well, but now we really want to reach out to our surrounding community and see where we can go here.

          BL: I know they mentioned to me that they were starting to help the other schools—like, the elementary and middle and high schools in Grand Junction get tested as well.

          PS: Yeah. Our foray into community testing was there. Basically, when the school stopped and they had this break over the holidays, they started pushing this community testing… It’s all about trust, right? They got the trust of their students, and now they’re getting the trust of the community. They’re saying, okay, we’re here to help you, how do we work through this together. That’s the idea behind it.

          So that’s all of my CMU backstory. But it also just generally tells you about the way I think things need to happen. Colleges are both a laboratory for infectious disease spread and also a great laboratory in which to try new technologies out, but it really has to involve community engagement, empowering of all the actors in the system, and trust-building. It does have to involve bringing the students on board on the mission, not just coming top-down and telling them how to do things, and reaching out to the communities and doing testing for your communities.

          It both makes you look more selfless because you’re a college helping your community. That’s always a great way, when you’re going to throw a party in the middle of the night, for them to be happy that you’re there. This[fall 2020] was the opportunity for all colleges to get buy-in from their communities, to show why they’re there and why they’re useful, and that’s another thing where it’s like, why are we not doing that? We have that opportunity.

          BL: That’s definitely something that I saw in part at some of the other schools [in my story], but not to the same degree as what Colorado Mesa was doing. I think you answered a lot of my questions already, because I was going to ask you, like, what makes colleges a good place to try out mitigation methods.

          But one more question is, do you have specific parameters that you would think about when you look at, say, cases and testing numbers, of what you would consider a successful fall semester for a campus?

          PS: The thing is, most schools had very unsuccessful semesters…. For me, success would be… The bar for me for success is really high. To justify coming back when so many people can’t… It would be, not having an outbreak on campus, or not seeding an outbreak in the community. Which could happen—you could not have an outbreak on campus but could have seeded one in the community, if you caught it and you were able to quarantine your people but you already spread it there and the whole thing went on fire. Essentially if your surrounding community has lower case rates.

          I always talk about, when you do something that’s counter to what you should be doing, success is going far and beyond. For me, when I have my students go into someone else’s lab, I’m like, you need to leave that lab better than when you found it. If you’re a guest in someone’s home, if you are treading in a place you shouldn’t tread, your level of success is leaving the college and the community better than when you found it. And having the students learn new skills, be engaged, and feel excited about the future.

          The fact, again, that CMU has their new song— which they just sent me, and it’s a little silly ‘cause it has all these excerpts of me talking—is, “The Future is Now.” And that, to me—even though, by the metrics of what I was just talking about, they weren’t successful. They had an outbreak on campus, it might have spread to the community. But they made a big headway, they learned a lot, the students engaged a ton, and they collectively were making the community around them better. That to me is—I think they had a successful semester in that the students were engaged and they learned, and they attempted to support the community around them. And from that will learn to be even better and stronger.

          BL: Is there anything in particular that you are expecting to be different this spring, learning from CMU and from the other schools you’ve worked with via the Broad Institute?

          PS: This spring is going to be very… it’s going to be hard to know how it will go. You’re gonna get vaccines coming in, that’s gonna make things better, but you have case numbers that are really high, variants that are more infectious, that are gonna make things worse. And a lot of civil unrest and tensions and all of that.

          It’s one of those things where we really have to double down on our civic engagement, I think that’s going to be really important. And on our public health view of what’s going on.

        • Some optimistic vaccine news but variants still pose a major threat

          Some optimistic vaccine news but variants still pose a major threat

          Last week, Janssen, a pharmaceutical division owned by megacorp Johnson & Johnson, released results for its phase 3 ENSEMBLE study. The Janssen vaccine uses an adenovirus vector (a modified common cold virus that delivers the DNA necessary to make the coronavirus spike protein), can be stored at normal fridge temperatures, and only requires one dose. Here’s a table of the raw numbers from Dr. Akiko Iwasaki of Yale:

          At first glance it does look like it’s “less effective” than the mRNA vaccines from Moderna and Pfizer. But, when you look at the severe disease, there’s a 100% decrease in deaths. No one who got the J&J vaccine died of coronavirus, no matter where they lived— including people who definitely were diagnosed with the South African B.1.351 variant. Here’s how that compares with the Moderna, AstraZeneca, Pfizer, and Novavax vaccines, per Dr. Ashish Jha of Brown:

          Nobody who got any of the vaccine candidates was hospitalized or died from COVID-19. That’s huge, especially as variants continue to spread across the U.S. (Here’s the updated CDC variant tracker.)

          J&J’s numbers are especially promising when it comes to variant strains. Moderna and Pfizer released their results before the B.1.1.7 (U.K.) or B.1.351. (S.A.) variants reached their current notoriety, which makes J&J’s overall efficacy numbers look worse by comparison. But the fact that no one who got the J&J vaccine was hospitalized no matter which variant they were infected with is a cause for optimism. (B.1.351 is the variant raising alarms for possibly being able to circumvent a vaccine’s protection due to a helpful mutation called E484K. A Brazilian variant, P1, also has this mutation, though there’s not a lot of research on vaccine efficacy for this particular mutant.)

          It also means that vaccination needs to step up. While it may seem counterintuitive to step up vaccinations against variants that can supposedly circumvent them, it’s important to note that there still was a significant decrease in COVID-19 cases in vaccinated patients from South Africa. A 57% drop compared with the 95% prevalence of the B.1.351 still suggests that vaccination can prevent these cases, and thus can seriously slow the spread of the variant.

          What does all of this mean for COVID-19 rates? We can infer a few things. For starters, when vaccines are distributed to the general public around April or May, we may see hospitalization rates and death rates drop more than positive test rates. Positive test rates should obviously drop too, but they’ll probably stay at least a little higher than hospitalizations and death rates for a while.

          Second, it means that we really need to ramp up sequencing efforts in the U.S.. We need more data to tell us just how well these vaccines can protect against the spreading variants, but we can’t collect that data if we don’t know which strain of SARS-CoV-2 someone gets. We here at the CDD have covered sequencing efforts – or lack thereof – before, but the rollout has still been painfully slow. CDC Director Rochelle Walensky stressed that “we should be treating every case as if it’s a variant during this pandemic right now,” during the January 29 White House coronavirus press briefing. But the 6,000 sequences per week she’s pushing for as of the February 1 briefing should have been the benchmark months ago. We’re still largely flying blind until we can get our act together.

          Some states in particular may be flying blinder than others. As Caroline Chen wrote in ProPublica yesterday, governors of New York, Michigan, Massachusetts, California, and Idaho are planning to relax more restrictions, including those on indoor dining. Such a plan is probably the perfect way to ensure these variants spread, so much that even Chen was surprised at how pessimistic the outlook was when she asked 10 scientists for the piece.

          The B.1.1.7 variant is expected to become the dominant strain in the U.S. by March, according to the CDC. And on top of that, the B.1.1.7 variant seems to have picked up that helpful E484K mutation in some cases as well. Per Angela Rasmussen of Georgetown University, if these governors don’t realize how much they’re about to screw everything up, “the worst could be yet to come.” God help us.

        • We’re not doing enough sequencing to detect B.1.1.7

          We’re not doing enough sequencing to detect B.1.1.7

          The CDC has identified 63 cases of the B.1.1.7 variant as of Jan. 8, but this is likely a significant undercount thanks to the nation’s lack of systematic sequencing.

          A new, more transmissible strain of COVID-19 (known as B.1.1.7) has caused quite a stir these past few weeks. It surfaced in the United Kingdom and has been detected in eight states: California, Colorado, Connecticut, Florida, Georgia, New York, Texas, and Pennsylvania. The fact that a mutant strain happened isn’t a surprise, as RNA viruses mutate quite often. But as vaccines roll out, the spread of a new strain is yet another reminder that we’re nowhere near out of the woods yet.  

          It’s entirely possible to differentiate between strains of SARS-CoV-2 through genetic testing. To detect the B.1.1.7 variant, COVID-19 positive samples can be sequenced to search for a telltale deletion in the virus’s RNA. And in theory, we could track the spread of this variant with good testing data. A truly robust tracking effort should include a centralized surveillance program to sequence the RNA of the SARS-CoV-2 virus in all positive cases—or at least a good sample—to detect any mutant strains and track their impact. However, this is an area where the US has consistently faltered: as of December 23rd, only 51,212 out of 18 million positive cases had been sequenced. 

          As with most of the government’s response, handling this seems to be mostly up to the states. According to releases from Colorado, Pennsylvania, Connecticut, and Texas, it looks like these states are making sequencing efforts. Georgia said, “The variant was discovered during analysis of a specimen sent by a pharmacy in Georgia to a commercial lab”, which I can only assume means they have been conducting some kind of sequencing effort. I couldn’t find references to the extent of sequencing efforts in the announcements from California, Florida, or New York

          From these releases, it’s obvious that there is no unified cross-state effort. Pennsylvania stated that they had been sending “10-35 random samples biweekly to the CDC since November to study sequencing,” but that’s not going to be nearly enough to track this more transmissible variant. Are there any plans to ramp up sequencing? And that’s just from Pennsylvania because they deigned to tell us—are all states going to ramp up sequencing? It’s just not clear. 

          And after all that, starting to test for the variant now still won’t tell us just how widespread it is. The first case in New York was in someone with no evident travel history. Indeed, this is true for most people who have been infected, and, per Dr. Angela Rasmussen in Buzzfeed News, this suggests that the variant is already circulating in the community. To know how widespread the variant is, we would need to retroactively test samples that had already tested positive. Colorado’s press release mentioned that they would be doing some retroactive testing, but what about the other seven states? 

          Plus, that’s just states with already confirmed cases—there absolutely will be more confirmed cases in other states, because if it is already present in the community, there probably already are cases in other states. To know just where this variant is, every positive test in the US stretching back months into the past would have to be retroactively re-tested for the variant—an unlikely occurrence. 

          Even if there were a coordinated effort to retroactively sequence all positive tests, some cases of the variant could still slip through the cracks, because most states still aren’t doing enough PCR testing as it is. As of January 8th, according to Ashish Jha’s team at the Brown University School of Public Health, 86% of states aren’t meeting their testing targets. (Meeting testing targets indicates that enough testing is happening to “identify most people reporting symptoms and at least two of their close contacts.” State targets on this dashboard were last configured on October 1, so keep that in mind.) Only two states where the variant has surfaced, Connecticut and New York, are meeting their targets—and cases are surging in both states right now. Longtime readers are going to be very familiar with this problem, but if any new people are reading, this means that in most states we don’t even know how widespread our “garden variety” COVID-19 is. So how are we supposed to know where the UK variant is if we can’t even keep track of the virus that’s been here for almost a year? 

          Beyond testing, even reporting on confirmed cases of the variant is spotty at best. The CDC is reporting how many detected cases of COVID-19 have been caused by the variant, but no state with a confirmed case caused by B.1.1.7 is displaying that data on their dashboard. (I checked the 8 states’ dashboards and left a comment on California’s because the ask box was right there.) Why is this not on their dashboards? I couldn’t tell you, but it seems like important information that should be reported.

          All of these unanswered questions show, yet again, that we desperately need a unified effort from the federal government to track and combat this virus. It should not be this hard to find how we’re tracking the spread of this variant, it should not be this hard to tell which methods work for even identifying the variant, and it should at least be possible to find this data on state health dashboards. It might look like we’re close to the finish line as vaccines continue to be distributed, but we’re tripping over the exact same problems we did at the beginning.