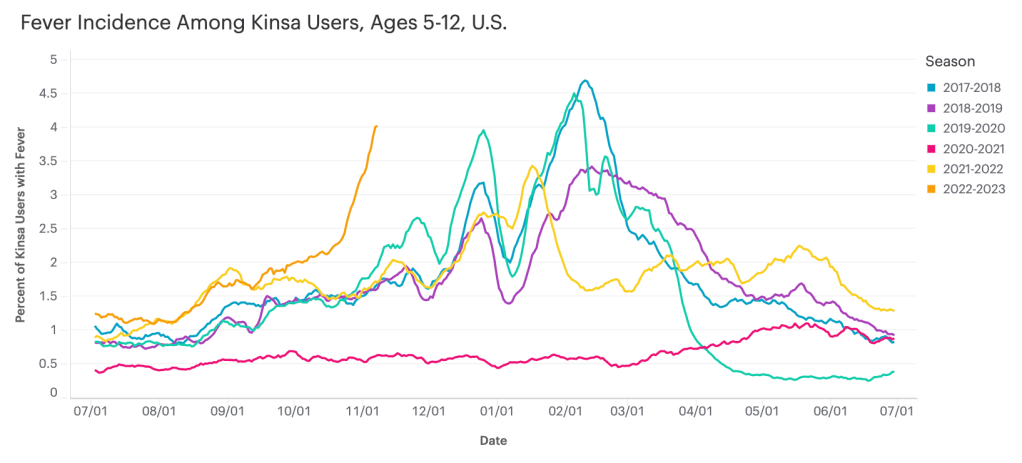
Data from Kinsa suggest that diseases causing fever are rising sharply among children ages five to 12, compared to past fall/winter seasons.
I recently learned about the Kinsa HealthWeather dashboard, a resource providing COVID-19 risk estimates by state and county based on data from smart thermometers.
Kinsa is a health tech company based in San Francisco that offers a health app paired with a smart thermometer. Users can submit their temperature data and symptoms to receive guidance on how to manage their illness. And at the population level, epidemiologists and data scientists can predict disease prevalence based on information from 2.5 million households using the app.
Danielle Bloch, epidemiology lead at Kinsa (and a former COVID Tracking Project volunteer, like myself), explained the process this way:
The data come from a network of 2.5 million households (of which about 600,000 users have taken a temperature in the past year) that have opted in to share information about their body temperature and symptoms, which are recorded through an app and smart thermometer. We’re currently in the process of updating our site to better incorporate other circulating infectious illnesses beyond COVID (Flu, GI symptoms, other respiratory infections) given the current landscape of diseases.
Right now, Bloch said, Kinsa’s data are showing an increase in fevers across the U.S.—with the biggest uptick in children ages five to 12. This trend likely reflects increasing COVID-19, flu, and RSV spread all at once.
As official case data from public health agencies become less reliable, new sources like Kinsa’s dashboard are a helpful way to continue tracking disease spread at the local level. I hope to see more sources like these in the future, along with more environmental monitoring (wastewater, air quality, etc.)
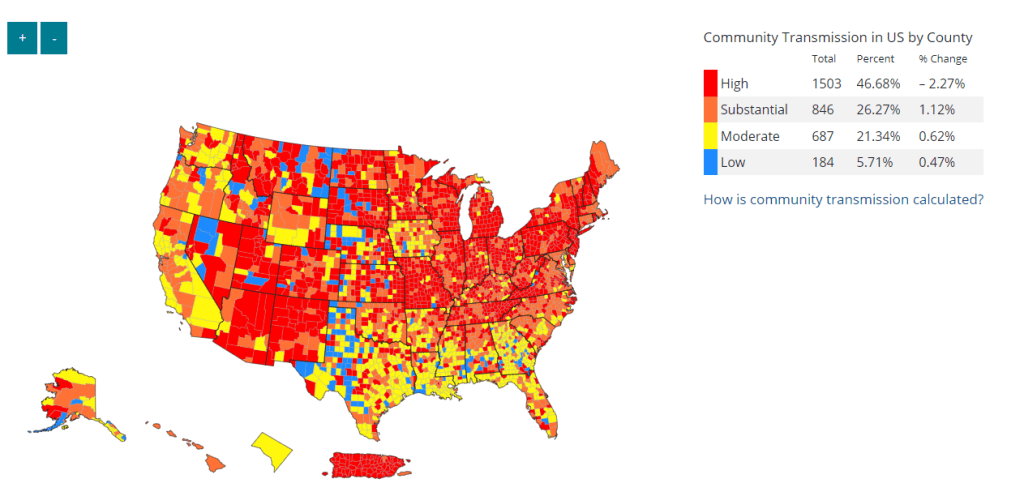
Despite significant undercounting of COVID-19 cases, the CDC’s Community Transmission Levels (based on case rates and test positivity) are high enough to suggest the majority of the country should be masking. Data here are as of November 2.
In the past week (October 27 through November 2), the U.S. reported about 270,000 new COVID-19 cases, according to the CDC. This amounts to:
An average of 39,000 new cases each day
83 total new cases for every 100,000 Americans
5% more new cases than last week (October 20-26)
In the past week, the U.S. also reported about 23,000 new COVID-19 patients admitted to hospitals. This amounts to:
An average of 3,300 new admissions each day
7.0 total admissions for every 100,000 Americans
1% fewer new admissions than last week
Additionally, the U.S. reported:
2,500 new COVID-19 deaths (360 per day)
35% of new cases are caused by Omicron BQ.1 and BQ.1.1; 9% by BF.7; 4% by BA.2.75 and BA.2.75.2 (as of November 5)
An average of 400,000 vaccinations per day
Continuing a trend from the last few weeks, nationwide COVID-19 cases and hospitalizations are still at plateaus or trending very slightly downward. We aren’t clearly in a fall surge yet, but concerning newer Omicron subvariants are rising—along with other respiratory diseases.
National wastewater trends are also still suggesting plateaus or downturns in coronavirus transmission, according to Biobot’s dashboard. The Northeast’s wastewater saw a major drop in coronavirus concentration over the last couple of weeks while other regions are at high, but steady levels.
As always, it’s important to remember that official case data are significantly undercounted. True infections are likely around 20 times higher than reported cases, though even that factor is difficult to estimate at this point in the pandemic.
Despite the undercounting, the CDC’s Community Transmission Levels (based on case rates and test positivity) suggest that 75% of U.S. counties are experiencing “high” or “substantial” coronavirus spread. If we had more accurate data, that number would likely shoot up to 100%. In other words, even today’s seemingly-low and underestimated case numbers are still high compared to earlier periods of the pandemic.
Newer versions of the Omicron variant will likely drive continued COVID-19 spread this fall. BQ.1 and BQ.1.1 have emerged as the most competitive subvariants and are quickly taking over from their parent lineage, BA.5. These two subvariants caused about 35% of new cases in the U.S. in the week ending November 5, according to the CDC’s estimates, while BA.5 caused 39%.
The BQs are most prevalent in the Northeast, especially New York and New Jersey: these subvariants caused over 50% of new cases in the NY/NJ region last week, according to the CDC. These two states and Connecticut also had the highest per-capita COVID-19 hospitalization rate last week, per the HHS Community Profile Report.
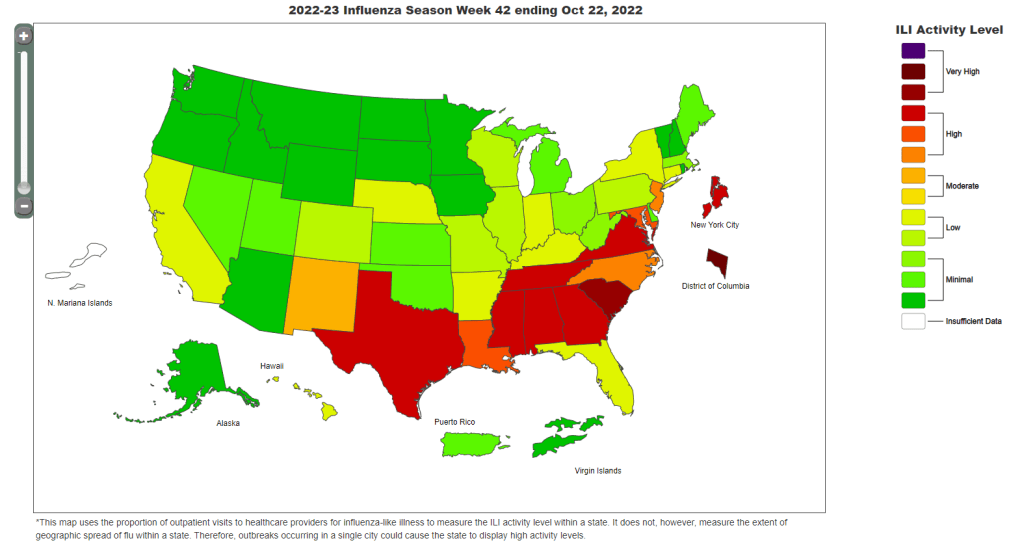
As hospitals around the country brace for a winter COVID-19 surge, they’re already dealing with high transmission of the flu. Flu hospitalizations have not been as high as they are this season since 2010-2011, the CDC reports. Last week, Washington D.C., Tennessee, South Carolina, and Alabama reported influenza-like illness rates so high that the CDC needed a new map color to express it.
Even if COVID-19 isn’t (yet) surging in your community, this is a good time to stock up on high-quality masks and rapid tests, and plan holiday gatherings that will keep friends and family members safe. Your Local Epidemiologist has a helpful guide for the latter.
The CDC’s FluView dashboard does not provide precise case numbers, only an approximation of “activity level.”
I recently received a question from a reader, asking how to follow both COVID-19 and the flu in the county where she lives. For COVID-19, county-level data sources aren’t too hard to find: the CDC still provides some clinical data—though case numbers are now updated weekly, instead of daily—and many counties have wastewater surveillance available. (See last week’s post for more details.)
But following flu transmission is much harder: there’s no county-level tracking of this virus. The same thing goes for respiratory syncytial virus (RSV), a virus currently sending record cases to children’s hospitals across the country. There are a few data sources available, which I’ll list later in this post, though nothing as comprehensive as what we’ve come to expect for COVID-19.
As I’ve previously written, the COVID-19 pandemic inspired nationwide disease surveillance at a level the U.S. has never seen before. The healthcare and public health systems had not previously attempted to count up every case of a widely-spreading virus and share that information back to the public in close-to-real-time.
It’s unlikely that flu, RSV, and other diseases will get the same resources as COVID-19 did for intensive tracking—at least not in the near future. But the scale of data we’ve had during the pandemic reveals that our current surveillance for these diseases is pretty inadequate, even for such basic purposes as giving hospitals advanced warning about new surges.
Insufficient RSV data
A recent CNN story by Deidre McPhillips and Jacqueline Howard explains how data gaps have hindered preparation for the current RSV surge. The reporters explain that the CDC’s RSV data are “based on voluntary reporting from a few dozen labs that represent about a tenth of the population.” The CDC uses these reports to provide weekly estimates about RSV cases, though recent data tend to be incomplete due to reporting delays.
Here’s a helpful quote from the story (though I recommend reading the whole piece):
“For hospitals [using CDC data], it’s a little like looking through the rearview mirror. They’ve already begun to experience that uptick in cases themselves before it’s noticeable in the federal data,” said Nancy Foster, vice president for quality and patient safety with the American Hospital Association.
“We’re talking about data that are collected inside hospitals, transmitted through a data trail to get to the federal government, analyzed there and then fed back to hospitals.”
In other words, it’s not surprising that we saw plenty of stories about higher-than-normal RSV cases in children’s hospitals before national data actually picked up the surge. For more details on why RSV is spreading this fall and how it’s impacting children’s hospitals, I recommend this piece by Jonathan Lambert at Grid.
Insufficient flu data
Meanwhile, this year’s flu season is clearly starting earlier than normal; but current data aren’t able to tell us how severe the season might get or who, exactly, is being hit the hardest. According to the CDC’s flu surveillance report for this week, the agency estimates that the U.S. has seen “at least 880,000 flu illnesses, 6,900 hospitalizations, and 360 deaths from flu” so far this fall.
The CDC’s estimates come from networks of testing labs, hospitals, and outpatient healthcare providers that participate in the agency’s flu surveillance networks. National flu data tend to be imprecise estimates, clearly labeled as “preliminary” by the CDC, while state-by-state data are estimates reported with delays. Note, for example, that the CDC’s map of “influenza-like-activity” by state and by metro area provides only general categories of activity (ranging from “minimal” to “very high”) rather than actual case numbers.
The flu data we have so far aren’t sufficient for making predictions about how the rest of this fall and winter will go, explains STAT’s Helen Branswell in a recent story. “The virus is maddeningly unpredictable,” she writes. U.S. experts often look to the flu season in the Southern Hemisphere, which precedes ours, for clues, but this can be unreliable (just as the U.S. shouldn’t rely on other countries for all its vaccine effectiveness data).
For both flu and RSV, one major problem with our surveillance methods is that our systems overly rely on healthcare centers. When public health agencies have to wait for hospitals and clinics to report cases of these viruses before starting to analyze data, they miss the opportunity to warn healthcare providers at the very beginning of a surge—and give them time to prepare.
In the future, expanding non-clinical surveillance methods like wastewater and population surveys to these diseases would provide more data, more quickly; both for healthcare providers and for the general public. (I provided some more specific ideas here.)
Existing sources
With all the above caveats in mind, here are a few sources you can look at to track flu and RSV:
CDC’s weekly flu surveillance report: This page is updated once a week with national estimates of flu activity, hospitalizations, flu virus variants, and more. Data tend to be preliminary.
CDC’s FluView dashboard: Information from the CDC’s flu surveillance system also appears on this dashboard in a more interactive format; for example, you can see how flu activity by state has changed over time.
CDC’s RSV trends report: Similar to its flu reports, the CDC provides weekly updates of estimated RSV tests and cases, including national, regional, and state-by-state trends.
Walgreens flu index: Walgreens tracks prescriptions for antiviral medications at its pharmacies as a proxy for flu activity, by state and for select metro areas. For more information on the index, see this press release.
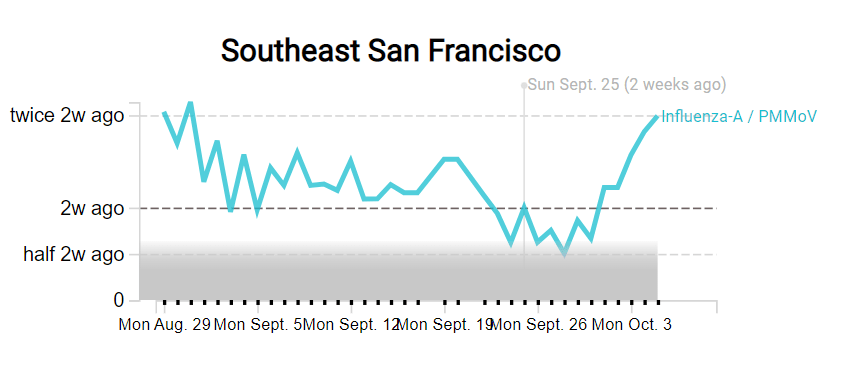
WastewaterSCAN: The SCAN network, run by researchers at Stanford University and Emory University, tests wastewater for flu, RSV, and monkeypox in addition to COVID-19 in select counties across the U.S. So far, this network is the first I know of to publicly share flu and RSV wastewater data, though other researchers are working in this area.
Please let me know if I missed any data sources! (You can email me or comment below.)
As you might have guessed from the last couple weeks of National numbers posts, I am anticipating that the U.S. will see a new COVID-19 surge this fall, along with potential surges of the flu and other respiratory diseases. And I’m not the only person making this prediction: in the last couple of weeks, this potential surge has been a major theme in news publications and health experts’ Twitter threads.
Yes, most of the U.S.’s major COVID-19 indicators appear to be at low levels right now (at least compared to earlier in the Omicron era). But rising numbers in Europe, as well as trends from some parts of the Northeast, provide reasons to worry. Here’s why it’s worth worrying, and some thoughts on better tracking these viruses in the future.
Why experts anticipate a fall surge
One likely reason for a fall surge, as writer Ewen Callaway explains in Nature, is an influx of new subvariants that have continued to evolve off of Omicron. While there are several lineages on the rise in various countries, researchers are finding that they tend to have similar mutations and capacities for reinfecting people, Callaway reports. Scientists call this “convergent evolution.”
From the story:
SARS-CoV-2-watchers are tracking an unprecedented menagerie of variants from a number of branches of the Omicron family tree, says Tom Peacock, a virologist at Imperial College London. Despite these variants’ distinct ancestries, they carry many of the same mutations to the SARS-CoV-2 spike protein (the part of the virus that immune systems target). “Clearly, there’s an optimal way for a variant to look going into this season,” says Peacock.
The new bivalent booster shots will help reduce severe disease from these newer Omicron iterations. But Americans are currently getting boosted in such small numbers that the shots might not help alleviate healthcare systems as much as experts might’ve hoped. And that brings me to another surge driver: behavior.
More than at any point in the pandemic, Americans are acting like COVID-19 is not worth a simple mask in public or test before a gathering—even though the coronavirus is still very capable of sending people to the hospital or giving them long-term symptoms. Indoor gatherings, holiday travel, fully opened schools, and all the behaviors that come with them will inevitably lead to outbreaks that are poorly tracked by our increasingly-less-resourced public health system (and that are largely ignored by leaders who encouraged the unsafe behavior).
So we can call this winter “post-pandemic” if we want. But given the policy failures and institutional dysfunctions that have accumulated over the past three years, it won’t be anything like a pre-pandemic winter, either. The more we resist that reality, the worse it will become. If we treat this winter as normal, it will be anything but.
In addition to COVID-19 and the flu, the U.S. is seeing increased transmission of other respiratory viruses particularly primed to spread among children, such as RSV, rhinoviruses and enteroviruses. Pediatricians and hospital directors told USA TODAY’s Adrianna Rodriguez that they’re seeing more sick kids, earlier in the school year than they would typically expect. Kids have less immunity to these viruses after limited spread in the last two winters, while minimal health precautions are making it easier for the viruses to infect more people.
Expanding COVID-19 surveillance to other viruses
In short, we could see a lot of respiratory virus cases in the next few months. These trends have got me thinking about how, in an ideal world, the U.S. public health system might expand our existing COVID-19 surveillance to better track all of the viruses that wreak havoc on our bodies during colder weather. (As I pointed out last month, our flu tracking is pretty terrible right now.)
Here are a few suggestions:
Expand wastewater surveillance to other respiratory viruses. Some pilot programs, such as the SCAN network based at Stanford and Emory Universities, have already started to monitor the flu, RSV, and other viruses in wastewater. But we need this type of tracking on a much broader scale, and we need it to be funded by the CDC and other major health institutions. (Biobot and the CDC’s expansion into monkeypox surveillance is a good first step here.)
Make multipurpose PCR tests widely available. My favorite place to get a COVID-19 test is one of the NYC health department’s express PCR sites. These public labs conduct PCR analysis on-site, so I get my test results in a few hours. And the results don’t just include COVID-19: the lab also tests for flu and RSV, so I can immediately rule out several explanations as to why my throat might be sore. We need many more labs doing this type of multi-virus testing.
Conduct population surveys for multiple respiratory diseases. I frequently reference the work of epidemiologist Denis Nash and his team at the City University of New York, who have surveyed New Yorkers and nationally to understand true COVID-19 infection rates. This type of work should be expanded to other diseases, in order to develop better, closer-to-real-time estimates of multiple conditions.
Add more diseases to hospital surveillance systems. Did you know that the HHS’s hospital utilization dataset includes hospitalizations for flu? While facilities have the opportunity to submit their flu patient numbers through the same system that they report on COVID-19 patients, flu reporting is optional—and therefore not very useful for analysis. A future iteration of the HHS’s hospital surveillance system should include mandatory flu reporting as well as other diseases, so that we can track severe cases more closely.
Incorporate respiratory virus tracking into school systems. For the first couple of pandemic-era semesters, many K-12 school systems maintained detailed records of their COVID-19 cases. This process has largely disappeared along with other COVID-19 measures—and while it lasted, it was incredibly burdensome for the school officials doing the tracking (many of them already-overworked school nurses). Still, in a future with more resources devoted to health in public schools, I’d like to see them become sites for tracking a variety of diseases and health conditions. The more collaboration between public schools and public health, the better.
If you know of researchers or organizations working on any of these surveillance mechanisms—or anything I haven’t included on this list—please reach out! I am always on the lookout for solutions story ideas.