
I recently learned about the Kinsa HealthWeather dashboard, a resource providing COVID-19 risk estimates by state and county based on data from smart thermometers.
Kinsa is a health tech company based in San Francisco that offers a health app paired with a smart thermometer. Users can submit their temperature data and symptoms to receive guidance on how to manage their illness. And at the population level, epidemiologists and data scientists can predict disease prevalence based on information from 2.5 million households using the app.
Danielle Bloch, epidemiology lead at Kinsa (and a former COVID Tracking Project volunteer, like myself), explained the process this way:
The data come from a network of 2.5 million households (of which about 600,000 users have taken a temperature in the past year) that have opted in to share information about their body temperature and symptoms, which are recorded through an app and smart thermometer. We’re currently in the process of updating our site to better incorporate other circulating infectious illnesses beyond COVID (Flu, GI symptoms, other respiratory infections) given the current landscape of diseases.
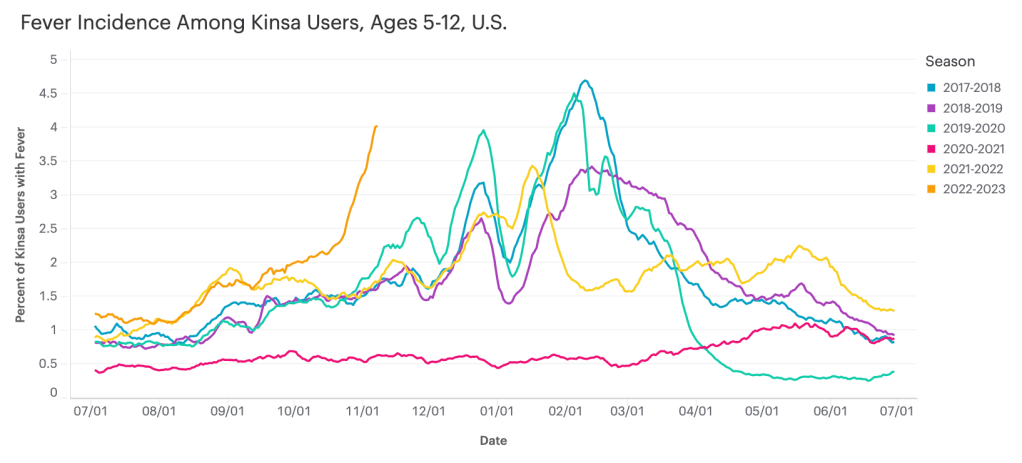
Right now, Bloch said, Kinsa’s data are showing an increase in fevers across the U.S.—with the biggest uptick in children ages five to 12. This trend likely reflects increasing COVID-19, flu, and RSV spread all at once.
As official case data from public health agencies become less reliable, new sources like Kinsa’s dashboard are a helpful way to continue tracking disease spread at the local level. I hope to see more sources like these in the future, along with more environmental monitoring (wastewater, air quality, etc.)

Leave a comment