- CDC publishes list of archived data pages: As the CDC prepares to shift its COVID-19 data publication efforts when the federal public health emergency ends in May, the agency has published a list of COVID-19 data and visualization pages that are no longer receiving updates. These archived pages include vaccination demographics, COVID-19 outcomes among pregnant people, data from correctional facilities, and more. I expect the list will get longer as we approach May 11, though the CDC is still updating core COVID-19 metrics (like cases, deaths, wastewater surveillance, etc.).
- One federal COVID-19 emergency may end sooner: Speaking of ending emergencies: you might have seen some news this week about a Republican bill to end COVID-19’s emergency status, which President Biden has announced he would not veto if it comes to his desk. It’s important to note that this is actually a different emergency declaration than the public health one, which is under the control of the federal Department of Health and Human Services (HHS). The public health emergency is still slated to end on May 11, and its implications for COVID-19 tests, treatments, and vaccines have not changed. Also, related: this story in STAT explains the federal funding that’s currently left over for COVID-19 response.
- Firearm injuries rose during COVID-19: A new report from the CDC shows how emergency department visits due to firearms rose during the pandemic. Compared to a 2019 baseline, these vitis were 37% higher in 2020, 36% higher in 2021, and 20% higher in 2022, the researchers found. Firearm injuries and deaths are another example of how COVID-19 contributed to higher excess morbidity and mortality; while these injuries weren’t directly caused by the coronavirus, they may be connected to the social and economic unrest that the U.S. faced over the last three years.
- County Health Rankings 2023: This week, the County Health Rankings initiative at the University of Wisconsin Population Health Institute released its 2023 data. These rankings cover a wide array of health-related metrics, from health behaviors like alcohol and drug use to physical environment factors like air quality. The database may be a helpful resource for reporters or researchers looking to understand how their communities compare to others, while the organization’s 2023 report offers national health trends.
- Global health workforce statistics: This database from the World Health Organization details how many health workers are employed around the world and over time. Statistics cover a variety of different health professions (doctors, specialists, nurses, dentists, pharmacists, etc.) and up to 20 years of data, depending on the country. While the dataset doesn’t cover through the pandemic—2020 is the most recent year included —it still shows how health workers have declined in many places over the last couple of decades. (H/t Data Is Plural.)
- Public health worker declines: Speaking of health workers: a new study, published in the journal Health Affairs, shows how the public health workforce in the U.S. has severely declined during the pandemic. The researchers used data from a workforce survey conducted in 2017 and 2021, comparing past “intent to leave or retire” with actual rates of workers leaving. Nearly half of the state and local public health workers in the survey sample left between 2017 and 2021, the researchers found. This paper shows how recruitment and retention among health workers drastically needs improvement.
Tag: Federal data
-
Sources and updates, April 2
-
COVID-19 dashboards that haven’t shut down yet

The Health Equity Tracker, run by the Morehouse School of Medicine’s Satcher Health Leadership Institute, is one of a few COVID-19 dashboards that is not shutting down at this time. We are in an era of dashboard shutdowns. Government agencies, research groups, and media organizations alike are winding down their COVID-19 reporting efforts. Some of these changes are directly tied to the end of the federal public health emergency in May, while others are more broadly attributed to shifting resources.
In the last couple of weeks alone: the Johns Hopkins COVID-19 dashboard stopped collecting new data, the New York Times switched its COVID-19 tracker to show CDC data instead of compiling original information from states and counties, and the CDC itself announced that its COVID-19 data newsletter will end in May. The White House COVID-19 team will also be disbanded in May, according to reporting from the Washington Post.
I haven’t done a comprehensive review of state and local COVID-19 dashboards, but I’m sure many of those are similarly shutting down, reporting less frequently, and reducing the types of data that they offer to the public. This is a trend I’ve been following since early last year, when state health departments started to declare COVID-19 was now “endemic” and didn’t require special monitoring resources, PCR testing infrastructure, etc. But it’s been accelerating in recent weeks, following the White House announcement about the end of the federal emergency.
When explaining why their COVID-19 reporting efforts are ending, organizations often state that the disease is “no longer a major threat” or say that public interest in tracking COVID-19 has waned. I’m skeptical about both of those claims. First of all, we know that COVID-19 is still killing hundreds of Americans each week, with a majority of those being people who have had multiple vaccine doses. And we know that millions are facing activity limitations from Long COVID. As I wrote last month, the U.S. didn’t have a “mild” winter this year; we’re just getting better at ignoring COVID-19’s continued impacts.
And second of all, I know there’s still an audience for this work—including many of the people who remain most vulnerable to COVID-19. Thank you to everyone who regularly reads this newsletter and blog, sends me questions, shares my work on social media, etc. for constantly validating that the interest is still here.
With all of you great readers in mind, I’ve compiled this list of COVID-19 dashboards that I know haven’t yet shut down. The list is focused on national sources rather than state/local or international ones, in the interest of being most helpful to the majority of readers.
- CDC COVID Data Tracker: The CDC’s COVID-19 dashboard is, of course, the primary source for federal data at this point in the pandemic. It provides weekly updates for most metrics (cases, hospitalizations, deaths, vaccinations, variant estimates, etc.); wastewater surveillance data are updated daily, with individual testing sites reporting on different cadences (usually about twice per week).
Post-PHE update: Still active, but greatly changed. Cases and testing metrics are no longer available (with testing labs and state/local health agencies no longer required to report to the CDC), while other key metrics are updated less frequently or with more of a delay. See this post for more details. - Census Household Pulse Survey: Since early in the pandemic, the U.S. Census’ Household Pulse Survey has provided data on how COVID-19 impacted Americans’ day-to-day lives. This survey’s most recent iteration is scheduled for March through May 2023. The Census collaborates with other federal agencies on its surveys, including the CDC for Long COVID questions.
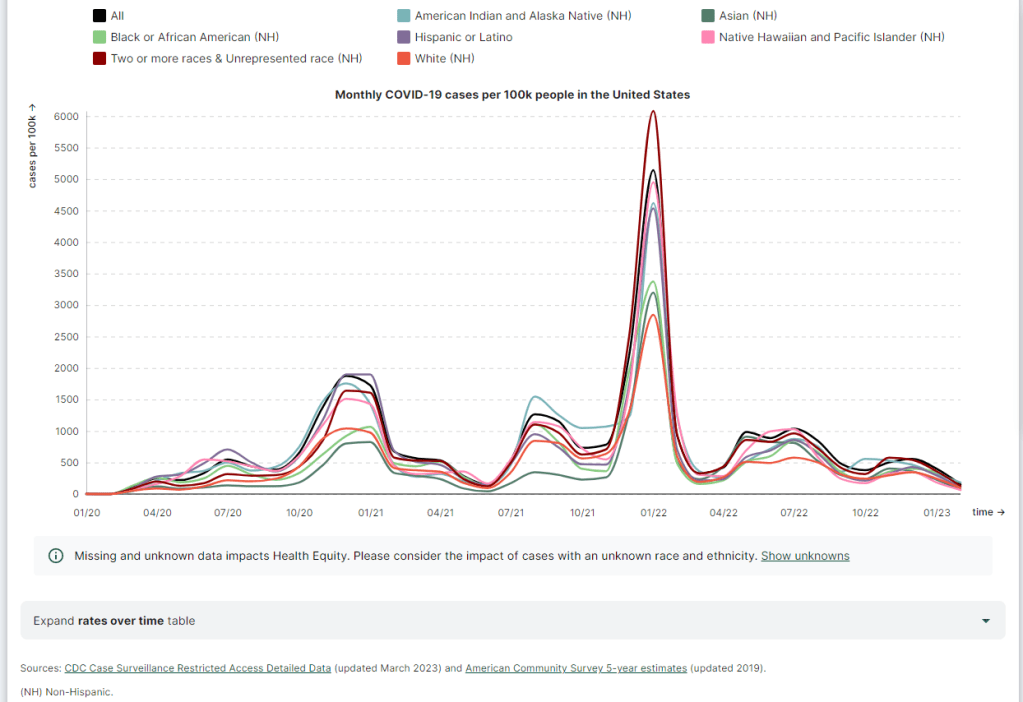
Post-PHE update: The Pulse survey is typically conducted in two-month installments, with several weeks between each installment to adjust questions and process data. Its most recent installment ended in early May, and the next one has yet to be announced; we should know within the next month whether this data source is ending with the PHE or if it will continue. - Morehouse Health Equity Tracker: This project, from the Satcher Health Leadership Institute at the Morehouse School of Medicine, tracks COVID-19 metrics and a variety of other health conditions by race and ethnicity. The COVID-19 data are based on a CDC restricted access dataset; updates will continue “for as long as the CDC gives us data,” software engineer Josh Zarrabi said on Twitter this week.
Post-PHE update: For COVID-19 data, this tracker utilizes a CDC dataset of cases with detailed demographic information, compiled from case reports sent to the CDC by state health agencies. The CDC dataset was last updated in April 2023, and it’s unclear whether it’ll be updated again (but my guess is it’ll end with the PHE). The Morehouse tracker includes plenty of other health metrics, though, so I expect this dashboard will be able to adjust to the CDC change. - APM Research Lab: This research organization, run by American Public Media, has several ongoing COVID-19 trackers. These include COVID-19 deaths by race and ethnicity (national and by state), vaccination rates (national and by state), and Minnesota-specific data, in collaboration with Minnesota Public Radio.
Post-PHE update: APM is continuing to update its tracker; the most recent update to its COVID-19 deaths by race and ethnicity page occurred on May 17. Its staff will likely need to make some changes to their underlying data sources, since the CDC is now reporting COVID-19 deaths differently, but the basic metrics remain available. - Walgreens COVID-19 Index: Walgreens shares data from COVID-19 tests conducted at over 5,000 pharmacy locations nationwide. The tracker includes test positivity (national trends and state-by-state), variant prevalence, and positivity by vaccination status.
Post-PHE update: Still active, with no change due to the PHE’s end. - COVIDcast by CMU Delphi: COVIDcast is a COVID-19 monitoring project by the Delphi Group at Carnegie Mellon University. The dashboard pulls in COVID-19 data from the CDC and other sources, such as Google search trends and antigen test positivity.
Post-PHE update: No longer includes cases and deaths (which were pulled from the CDC), but still updating other metrics, including hospital admissions, symptom searches from Google trends, and COVID-related doctor visits. - Iowa COVID-19 Tracker: Despite its name, the Iowa COVID-19 Tracker displays data from across the country, sourced from the CDC. It’s run by Sara Anne Willette, a data expert based in Ames, Iowa. Willette frequently shares data updates on social media and streams on Twitch when updating her dashboard.
Post-PHE update: Still active, but with some changes due to the new limitations in CDC data. Dashboard manager Sara Anne Willette shares frequent updates on Twitter about what she’s changing and why. - COVID-19 dashboard by Jason Salemi: This dashboard by University of South Florida epidemiologist Jason Salemi is another page displaying CDC data in somewhat-more-user-friendly visualizations. The dashboard is focused on Florida, but shares national state- and county-level data.
Post-PHE update: Salemi shared on Twitter last week that he is currently assessing whether to keep the dashboard running or decomission the site. - Biobot Analytics: Biobot Analytics is the leading wastewater surveillance company in the U.S., tracking COVID-19 at hundreds of sewershed sites through its partnership with the CDC National Wastewater Surveillance System and independent Biobot Network. The dashboard has helpful national- and regional-level charts along with county-level data for sites in Biobot’s network.
Post-PHE update: Still active, no changes due to the PHE’s end. In fact, Biobot continues to add more wastewater testing sites to its network. - WastewaterSCAN: WastewaterSCAN is another leading wastewater project, led by professors at Stanford and Emory Universities. The project started with sites in California, but has since expanded nationwide; it’s tracking several other common viruses in addition to COVID-19.
Post-PHE update: Still active, similarly to Biobot’s dashboard. - For more wastewater data: Check out the COVID-19 Data Dispatch resource page with annotations on state and local dashboards.
- KFF COVID-19 Vaccine Monitor: Since late 2020, the Kaiser Family Foundation has monitored American attitudes around COVID-19 vaccines and other pandemic issues. Updates were initially released monthly, but have become less frequent in the last year (the latest update was published on February 7, 2023).
Post-PHE update: This KFF project appears to be ongoing, but at a lower frequency of updates; the most recent update is still February 2023. A newer KFF dashboard (tracking Medicaid enrollment and unwinding) is also receiving ongoing updates. - Axios-Ipsos COVID-19 polls: Axios has partnered with the polling firm Ipsos on regular polls tracking COVID-19 views and behaviors. The polling data are available in PDF reports and in spreadsheets from Roper. In 2023, Axios and Ipsos shifted their focus from COVID-19 to broader questions about public health, with a new series of quarterly polls.
Post-PHE update: These two organizations will continue their new series of quarterly polls about public health, launched in early 2023. The most recent installment was posted this past week and includes questions about the PHE’s end, gun violence, opioids, and more.
Have I missed any major data sources? Send me an email or comment below to let me know, and I’ll highlight it in a future issue.
Editor’s note, April 2, 2023: This post has been updated with two additional dashboards (APM Research Lab and Walgreens), and additional information on the CDC’s wastewater surveillance dashboard.
Editor’s note, May 21, 2023: This post has been updated with notes about changes impacting these dashboards due to the end of the federal public health emergency (PHE).
More federal data
- CDC COVID Data Tracker: The CDC’s COVID-19 dashboard is, of course, the primary source for federal data at this point in the pandemic. It provides weekly updates for most metrics (cases, hospitalizations, deaths, vaccinations, variant estimates, etc.); wastewater surveillance data are updated daily, with individual testing sites reporting on different cadences (usually about twice per week).
-
COVID source callout: CDC ends its data newsletter
This past Friday, the CDC’s COVID-19 data team announced that its newsletter, the COVID Data Tracker Weekly Review, will send its final issue on Friday, May 12. That’s the day after the federal public health emergency for COVID-19 ends.
For the last two years, the Weekly Review newsletter has been a great source of accessible updates on the state of COVID-19 in the U.S.; it includes summary statistics on cases, hospitalizations, vaccinations, variants, wastewater surveillance, and deaths. I’ve frequently referenced the newsletter in my own National Numbers updates, and have pointed other journalists to it.
But this newsletter hasn’t been as reliable as one might expect from the CDC. Its writers have frequently taken the week off for federal holidays, even when the holiday falls on a Monday—and the newsletter is sent on Fridays. In recent months, the CDC has only compiled this newsletter every other week, making the “weekly review” title a misnomer. And now, the CDC has announced there will be only three more issues: sent on March 31, April 14, and May 12. (Seems like the newsletter is briefly shifting to a monthly schedule before it ends?)
While the CDC will continue to regularly update its main COVID-19 dashboard and other data sources, the agency’s failure to maintain even a fairly basic update newsletter really speaks to its deprioritization of COVID-19. It honestly boggles the mind that I, a freelance journalist writing about COVID-19 data in her spare time, send updates with more continuity than the entire national public health agency.
Yet somehow, here we are! This newsletter may see continued shifts to its format, but it isn’t going anywhere.
-

COVID-19 is inspiring improvements to surveillance for other common viruses
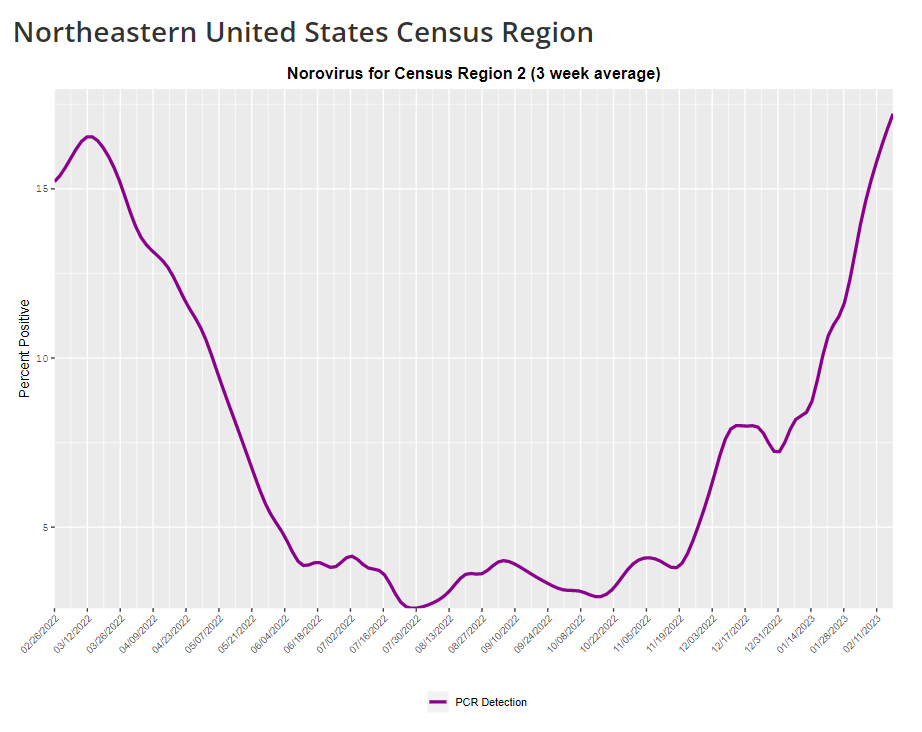
The CDC provides norovirus test positivity data from a select number of labs that report test results for this virus. Due to limited reporting, data are only available at the regional level. This week, I have a new story out in Gothamist and WNYC (New York City’s public radio station) about norovirus, a nasty stomach bug that appears to be spreading a lot in the U.S. right now. The story shares some NYC-specific norovirus information, but it also talks more broadly about why it’s difficult to find precise data on this virus despite its major implications for public health.
Reporting this story led me to reflect on how COVID-19 has revealed cracks in the country’s infrastructure for tracking a lot of common pathogens. I’ve written previously about how the U.S. public health system monitored COVID-19 more comprehensively than any other disease in history; the scale of testing, contact tracing, and innovation into new surveillance technologies went far beyond the previous standards. Now, people who’ve gotten used to detailed data on COVID-19 have been surprised to find out that such data aren’t available for other common pathogens, like the flu or norovirus.
It might feel disappointing to realize how little we actually know about the impacts of endemic diseases. But I choose to see this as an opportunity: as COVID-19 revealed gaps in public health surveillance, it inspired development in potential avenues to close those gaps. Wastewater surveillance is one big example, along with the rise of at-home tests and self-reporting mechanisms, better connectivity between health systems, mobility data, exposure notifications, and more.
Norovirus is a good example of this trend. Here are a few main findings from my story:
- Norovirus is a leading cause of gastrointestinal disease in the U.S., and is estimated to cause billions of dollars in healthcare and indirect societal costs every year.
- People who become infected with norovirus are often hesitant to seek medical care, because the symptoms are disgusting and embarrassing. Think projectile vomit, paired with intense diarrhea.
- Even when patients do seek medical care, norovirus tests are not widely available, and there isn’t a ton of incentive for doctors to ask for them. Testing usually requires a stool sample, which patients are often hesitant to do, one expert told me.
- The virus is not a “reportable illness” for the CDC, meaning that health agencies and individual doctors aren’t required to report norovirus cases to a national monitoring system. (So even when a patient tests positive for norovirus, that result might not actually go to a health agency.)
- The CDC does require health agencies and providers to report norovirus outbreaks (i.e. two or more cases from the same source), but national outbreak estimates are considered to be a vast undercount of true numbers.
- Even in NYC, where the city’s health agency does require reporting of norovirus cases, there’s no recent public data from test results or outbreaks. (The latest data is from 2020.)
As I explained in an interview for WNYC’s All Things Considered, the lack of a national reporting requirement and other challenges with tracking norovirus are linked:
It seems like the lack of a requirement and the difficulty of tracking kind-of play into each other, where it’s not required because it’s hard to track—but it’s also hard to track because it’s not required.
The lack of detailed data on pathogens like norovirus can be frustrating on an individual level, for health-conscious people who might want to know what’s spreading in their community so that they can take appropriate precautions. (For norovirus, precautions primarily include rigorous handwashing—hand sanitizer doesn’t work against it—along with cleaning surfaces and care around food.)
These data gaps can also be a challenge for public officials, as more detailed information about where exactly a virus is spreading or who’s getting sick could inform specific public health responses. For example, if the NYC health department knew which neighborhoods were seeing the most norovirus, they could direct handwashing PSAs to those areas. In addition, scientists who are developing norovirus vaccines could use better data to estimate the value of those products, and determine who would most benefit.
So, how do we improve surveillance for norovirus and other viruses like it? Here are a few options I found in my reporting:
- Wastewater surveillance, of course. The WastewaterSCAN project is already tracking norovirus along with coronavirus and several other common viruses; its data from this winter has aligned with other sources showing a national norovirus surge, one of the project’s principal investigators told me.
- Better surveillance based on people’s symptoms. The Kinsa HealthWeather project offers one example; it aggregates anonymous information from smart thermometers and a symptom-tracking app to provide detailed data on respiratory illnesses and stomach bugs.
- At-home tests, if they’re paired with a mechanism for people to report their results to a local public health agency. Even without a reporting mechanism, at-home tests could help curb outbreaks by helping people recognize their illness when they might be asymptomatic.
- Simply increasing awareness and access to the tests that we already have. If more people go to the doctor for gastrointestinal symptoms and more doctors test for norovirus, our existing data would get more comprehensive.
Are there other options I’ve missed? Is there another pathogen that might be a good example of common surveillance issues? Reach out and let me know.
-
This winter’s COVID-19 surge wasn’t “mild”

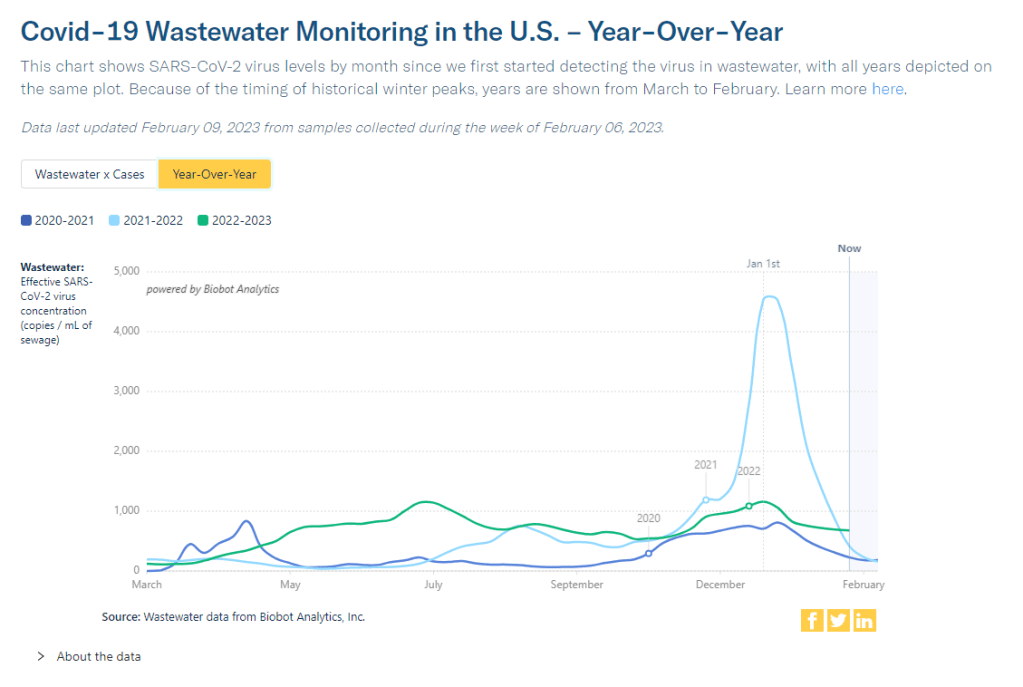
Wastewater surveillance data from Biobot suggests that COVID-19 spread this winter (2022-2023) was higher than all other surges prior to Omicron’s emergence. You might have seen some headlines like this in the last few weeks: COVID-19 was “mild” this winter. This winter was “better” than previous winters. COVID-19 is becoming “another seasonal virus” like flu and RSV. But is this true?
While it’s accurate that the U.S. reported fewer COVID-19 cases this past winter compared to last year (when the country experienced our first, massive Omicron surge) or the prior year (our biggest surge pre-vaccines), this winter still saw an extraordinary amount of severe illness, death, and potential future disability due to COVID-19. Surges of other respiratory viruses also put enormous strain on the healthcare system.
If we call this winter “mild,” we run the risk of believing this level of disease is acceptable. Such portrayals of COVID-19 seek to make us think future surges will be nothing to worry about, despite clear evidence to the contrary.
Let’s go through some numbers. Since the beginning of November, the U.S. has reported:
- More than 5 million new COVID-19 cases (reported). Note that cases are likely underreported by 10 to 20 times in our era of under-testing, so the true number may be closer to 100 million.
- More than 400,000 new COVID-19 hospitalizations, piling on top of hospitalizations for the flu, RSV, and other diseases, and coming as hospitals deal with staff shortages and worker burnout.
- More than 40,000 new COVID-19 deaths, amounting to more than 400 new deaths per day. This number is also likely an undercount, as death certificates can take a long time to be processed.
- The majority of COVID-19 deaths were among vaccinated people. A report from the Kaiser Family Foundation found that breakthrough deaths started to outnumber those among unvaccinated people in summer 2022, a trend that has continued with low booster uptake.
- Coronavirus levels in wastewater were higher than all surges prior to Omicron, including the winter surge in 2020-2021 and the Delta surge in summer 2021, according to data from Biobot.
- XBB.1.5, the latest and most contagious Omicron subvariant, evolved in the U.S. this winter, likely in New York State. Unchecked COVID-19 spread makes it easier for the virus to keep mutating.
- More than 5% of American adults are currently experiencing Long COVID. This number has ranged from 5.5% to 7% since September 2022, according to the CDC and Census’ Household Pulse Survey.
- Almost 80% of adults with Long COVID report activity limitations due to the condition, including about 25% who report “significant” activity limitations, per the Household Pulse Survey.
In an average week this winter, the U.S. reported more deaths from COVID-19 than the number of casualties on September 11, 2001. The latter event was a horrific tragedy that inspired lasting changes to national security, while the former has been written off as “mild.”
Past surveys from many sources—including the CDC itself—have suggested that, when people know COVID-19 is spreading widely in their communities, they’re willing to take basic safety precautions. But when government leaders and mainstream media outlets downplay the risks, people don’t have the information they need to make informed choices. We’ve seen this pattern at a large scale this winter, and I worry that the trend will only continue.
And here’s what concerns me even more: in previous winters, cases went up over the holidays, then declined through January and February. This year, however, the decline isn’t really happening. Transmission has gone down a bit from its peak, but it’s now plateaued at a level higher than the peaks of previous surges, per Biobot’s data.
So, not only did we have a bad surge this winter, we’re now stuck at a high-COVID baseline that seems very difficult to shake, in the era of many new variants and few public health precautions. The situation reminds me of a Twitter thread from the evolutionary biologist T. Ryan Gregory, which I shared when writing about XBB.1.5 in early January:
That “area under the curve” is what the U.S. is seeing now, as COVID-19 spread stays at high levels. Thousands of cases a day, thousands of hospitalizations a day, hundreds of deaths a day.
As a journalist and as an individual capable of taking precautions, I resist the narrative that any of this is acceptable. If you’re reading this, I hope you can, too.
More federal data
-
New wastewater surveillance report highlights need for expansion, standardization

Nearly a year after the CDC’s National Wastewater Surveillance System began reporting public data, the system still has very unequal representation across the U.S. This week, the National Academies of Sciences, Engineering, and Medicine (NASEM) released a major report about the state of wastewater surveillance for infectious diseases in the U.S. The report, written by a committee of top experts (and peer-reviewed before its release), is an extensive description of the promise and the challenges of wastewater testing.
Its authors describe how a grassroots network of researchers, public officials, and wastewater treatment plant staff developed strategies for sewage testing, analysis, and communicating results. Now, as committee chair Guy Hughes Palmer writes in the report’s introduction, broader collaboration and resources are needed to “solidify this emergency response to the COVID-19 pandemic into a national system” that continues to monitor COVID-19 as well as other public health threats. To this end, the report includes specific recommendations for the CDC’s National Wastewater Surveillance System.
Here are some key findings from the report, taken from its summary section and a NASEM webinar presentation last Thursday:
- Overall, the report finds that wastewater surveillance data “are useful for informing public health action and that wastewater surveillance is worthy of further development and continued investment.” The authors recommend that public agencies at all levels keep funding and promoting this monitoring tool.
- Wastewater surveillance is not a new technology; it’s been used for decades to monitor the spread of polio. But COVID-19 led to widespread adoption of this technology and innovation into how it could be used, driven by some municipalities and universities that were early to embrace wastewater.
- As a population-level tool, wastewater surveillance provides data on how diseases spread through a community without relying on access to clinical testing. This surveillance is becoming more important for COVID-19 as people opt for at-home tests over PCR tests, and should be used specifically to track new variants.
- Community sewersheds that may be tested range in size from serving hundreds of people to serving millions; they also differ based on geography, demographics, and many other factors. As a result, early researchers in this space developed testing and analysis methods that were specific to their communities.
- Now, however, the CDC faces a challenge: “to unify sampling design, analytical methods, and data interpretation to create a truly representative national system while maintaining continued innovation.” In other words, standardize the system while allowing local communities to keep doing what works best for them.
- Sites in the CDC’s National Wastewater Surveillance System (NWSS) are currently not representative of the U.S. as a whole, as the system is based on wastewater utilities and public health agencies choosing to participate.
- The CDC needs to expand this system to be more equitable across the country, with targeted outreach, offering resources to sites not currently participating, and other similar tactics. This expansion process should be open and transparent, the report’s authors write.
- As NWSS expands, the CDC should select and prioritize “sentinel sites” that can help detect new coronavirus variants and other new emerging health threats early on. These sites might include international airports as well as zoos and livestock farms, where potential animal-to-human transmission may be monitored.
- Better public communication is needed: the CDC (and other agencies) should improve its public outreach about wastewater data, including addressing any privacy concerns that people may have. The report specifically recommends that the CDC “convene an ethics advisory committee” to assist with privacy concerns and data-sharing concerns.
- In assessing potential new targets for wastewater surveillance, the report recommends three criteria: “(1) public health significance of the threat, (2) analytical feasibility for wastewater surveillance, and (3) usefulness of community-level wastewater surveillance data to inform public health action.”
- NWSS needs more funding from the federal government to expand its sites, continue its COVID-19 tracking efforts, fund projects at state and local levels, and pivot to new public health threats as needed. This funding needs to be “predictable and sustained,” the report’s authors write.
In related news: I just updated the COVID-19 Data Dispatch’s resource page for wastewater data dashboards in the U.S.
- The dashboard now includes information on four national dashboards, 24 state dashboards, seven local dashboards, and four regional dashboards.
- New states added in this update: Illinois (see last week’s source shout-out for more details), as well as Vermont and New Hampshire.
As always, please reach out if you see any errors on the page or would like to recommend a new source!
More wastewater data
-
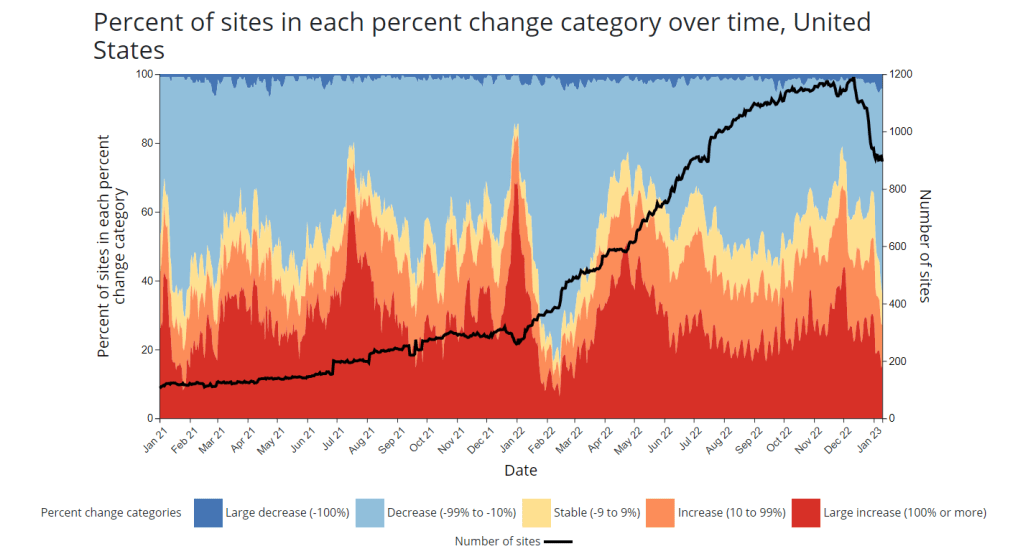
Looking ahead to the big COVID-19 stories of 2023

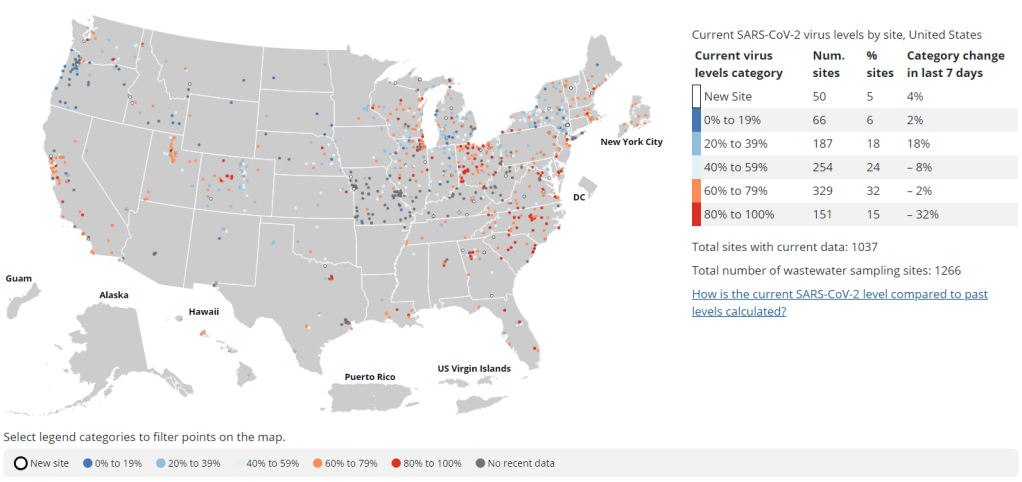
The number of sites reporting to the National Wastewater Surveillance System (see the black line) has declined in recent weeks. This may be a worrying trend going into 2023. It’s the fourth year of the pandemic. I’ve written this statement in a few pitches and planning documents recently, and was struck by how it feels simultaneously unbelievable—wasn’t March 2020, like, yesterday?—and not believable enough—haven’t we been doing this pandemic thing for an eternity already?
As someone who’s been reporting on COVID-19 since the beginning, a new year is a good opportunity to parse out that feels-like-eternity. So this week, I reflected on the major trends and topics I hope to cover in 2023—both building on my work from prior years and taking it in new directions.
(Note: I actually planned to do this post last week, but then XBB.1.5 took higher priority. Hence its arrival two weeks into the new year.)
Expansions of wastewater, and other new forms of disease surveillance
As 2022 brought on the decline of large-scale PCR testing, wastewater surveillance has proven itself as a way to more accurately track COVID-19 at the population level—even as some health departments remain wary of its utility. We also saw the technology’s use for tracking monkeypox, polio, and other conditions: the WastewaterSCAN project, for example, now reports on six different diseases.
This year, I expect that wastewater researchers and public agencies will continue expanding their use of this surveillance technology. That will likely mean more diseases as well as more specific testing locations, in addition to entire sewersheds. For example, we’re already seeing wastewater testing on airplanes. I’m also interested in following other, newer methods for tracking diseases, such as air quality monitors and wearable devices.
At the same time, these surveillance technologies will continue to face challenges around standardization and public buy-in. The CDC’s big contract with Biobot expires this month, and I’ve already noticed a decline in sites with recent data on the agency’s dashboard—will CDC officials and local agencies step in to fill gaps, or will wastewater testing become even more sporadic?
New variants, and how we track them
For scientists who track the coronavirus’ continued evolution, 2022 was the year of Omicron. We didn’t see all-new virus lineages sweeping the world; instead, Omicron just kept mutating, and mutating, and mutating. It seems likely that this pattern will continue in 2023, but experts need to continue watching the mutation landscape and preparing for anything truly concerning.
With declining PCR testing, public agencies and companies that track variants have fewer samples to sequence. (This led to challenges for the CDC team tracking XBB.1.5 over the holidays.) As a result, I believe 2023 will see increased creativity in how we keep an eye on these variants—whether that’s sequencing wastewater samples, taking samples directly from healthcare settings, increased focus on travel surveillance, or other methods.
Public health experts—and journalists like myself—also need to rethink how we communicate about variants. It’s no longer true that every new, somewhat-more-contagious variant warrants alarm bells: variants can take off in some countries or regions while having relatively little impact in others, thanks to differences in prior immunity, seasonality, behavior, etc. But new variants still contribute to continued reinfections, severe symptoms, Long COVID, and other impacts of COVID-19. Grid’s Jonathan Lambert recently wrote a helpful article exploring these communication challenges.
Long COVID and related chronic diseases
As regular readers likely know, Long COVID has been an increased topic of interest for me over the last two years. I’ve covered everything from disability benefits to mental health challenges, and am now leading a major project at MuckRock that will focus on government accountability for the Long COVID crisis.
Long COVID is the epidemic following the pandemic. Millions of Americans are disabled by this condition, whether they’ve been pushed out of work or are managing milder lingering symptoms. Some people are approaching their three-year anniversary of first getting sick, yet they’ve received a fraction of the government response that acute COVID-19 got. Major research projects are going in the wrong directions, while major media publications often publish articles with incorrect science.
For me, seeing poor Long COVID coverage elsewhere is great motivation to continue reporting on this topic myself, at MuckRock and other outlets. I’m also planning to spend more time reading about (and hopefully covering) other chronic diseases that are co-diagnosed with Long COVID, like ME/CFS and dysautonomia.
Ending the federal public health emergency.
Last year, we saw many state and local health agencies transition from treating COVID-19 as a health emergency to treating it as an endemic disease, like the many others that they respond to on a routine basis. This transition often accompanied changes in data reporting, such as shifts from daily to weekly COVID-19 updates.
This year, the federal government will likely do the same thing. POLITICO reported this week that the Biden administration is renewing the federal public health emergency in January, but will likely allow it to expire in the spring or summer. The Department of Health and Human Services has committed to telling state leaders about this expiration 60 days before it happens.
I previously wrote about what the end of the federal emergency could mean for COVID-19 data: changes will include less authority for the CDC, less funding for state and local health departments, and vaccines and treatments controlled by private markets rather than the federal government. I anticipate following up on this reporting when the emergency actually ends.
Transforming the U.S. public health system
Finally, I intend to follow how public health agencies learn from—or fail to learn from—the pandemic. COVID-19 exposed so many cracks in America’s public health system, from out-of-date electronic records systems to communication and trust issues. The pandemic should be a wakeup call for agencies to get their act together, before a new crisis hits.
But will that actually happen? Rachel Cohrs has a great piece in STAT this week about the challenges that systemic public health reform faces, including a lack of funding from Congress and disagreements among experts on what changes are necessary. Still, the window for change is open right now, and it may not be at this point in 2024.
More federal data
-
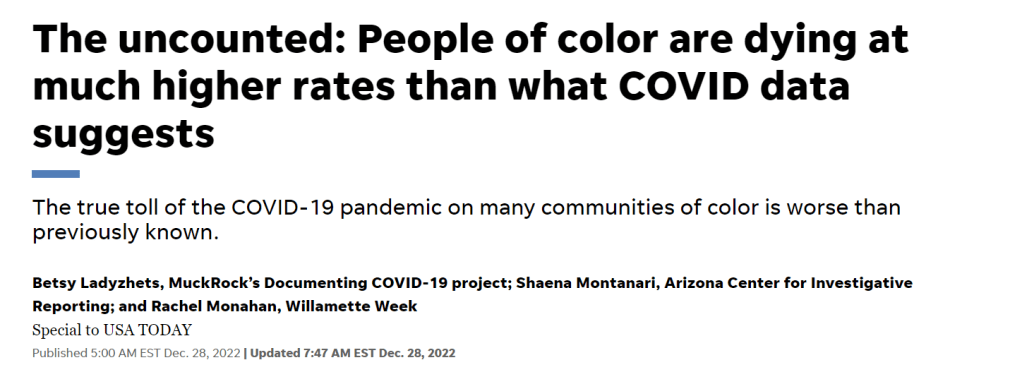
How official death data underestimate COVID-19’s inequities
In the last week of December, I had a major story published at MuckRock, USA TODAY, and local newsrooms in Arizona, Oregon, and Texas. The story explains that official COVID-19 statistics underestimate the pandemic’s true toll—particularly on people of color, who are more likely to have their deaths inaccurately represented in mortality data.
This story was part of Uncounted, MuckRock’s broader project to investigate death certificate errors and other death reporting issues uncovered by looking at all excess deaths during the pandemic, not just those deaths officially marked as COVID-19. It relies on data from the CDC’s provisional mortality statistics and excess death estimates by a team of demography researchers at Boston University led by Andrew Stokes.
I’ve copied the introductory section of the story here, because I don’t think anything else I write would do a better job at summarizing it. I encourage you to read the full piece; it is the biggest (and likely most important) story that I wrote in 2022.
It’s not always easy to identify a COVID-19 death.
If someone dies at home, if they have symptoms not typically associated with the disease or if they die when local health systems are overwhelmed, their death certificate might say “heart disease” or “natural causes” when COVID-19 is, in fact, at fault.
New research shows such inaccuracies also are more likely for Americans who are Black, Hispanic, Asian or Native.
The true toll of the COVID-19 pandemic on many communities of color – from Portland, Oregon, to Navajo Nation tribal lands in Arizona, New Mexico and Utah, to sparsely populated rural Texas towns – is worse than previously known.
Incorrect death certificates add to the racial and ethnic health disparities exacerbated by the pandemic, which stem from long-entrenched barriers to medical care, employment, education, housing and other factors. Mortality data from the Centers for Disease Control and Prevention point to COVID-19’s disastrous impacts, in a new analysis by the Documenting COVID-19 Project at Columbia University’s Brown Institute for Media Innovation and MuckRock, in collaboration with Boston University’s School of Global Public Health; the USA TODAY Network; the Arizona Center for Investigative Reporting; Willamette Week in Portland; and the Texas Observer.
The data shows that deaths from causes the CDC and physicians routinely link to COVID– including heart disease, respiratory illnesses, diabetes and hypertension–have soared and remained high for certain racial and ethnic groups.
In Arizona’s Navajo and Apache counties, which share territory with Navajo Nation, COVID deaths among Native Americans drove nation-leading excess death rates in 2020 and 2021. While COVID death rates among Natives dropped during the second year of the pandemic thanks to local health efforts, other causes of death such as car accidents and alcohol poisoning increased significantly from 2020 to 2021.
In Portland, deaths from causes indirectly related to the pandemic went up in 2021 even as official COVID deaths remained relatively constant. Black residents were disproportionately impacted by some of these causes, such as heart disease and overdose deaths – despite a county-wide commitment to addressing racism as a public health threat.
In Texas, smaller, rural counties served by Justices of the Peace were more likely to report potential undercounting of COVID deaths than larger, urban counties served by medical examiners. Justices of the Peace receive limited training in filling out death certificates and often do not have sufficient access to postmortem COVID testing, local experts say.
Experts point to several reasons for increased inaccurate death certificates among non-white Americans. These include resources available for death investigations, the use of general or unknown causes on death certificates, and how the race and ethnicity fields of these certificates are filled out.
Such barriers to accurate death reporting add on to existing health disparities that made non-white Americans more susceptible to COVID in 2021, despite widespread vaccination campaigns and health equity efforts.
“Even if you try to level the playing field, from the jump, certain populations are dealing with things that put them at greater risk,” said Enrique Neblett, a health equity expert at the University of Michigan’s School of Public Health. These issues include higher exposure to COVID, as people of color are overrepresented among essential workers, as well as higher rates of chronic conditions that confer risk for severe disease. “Those things aren’t eliminated just by increasing access to a vaccine,” Neblett said.
It is critical to improve data collection and reporting for deaths beyond those officially labeled as COVID because data is a “major political determinant of health,” said Daniel Dawes, executive director of the Satcher Health Leadership Institute at the Morehouse School of Medicine. Information on how people are dying in a particular community can shape priorities for local public health departments and funding for health initiatives.
“If there is no data, there is no problem,” Dawes said.
-
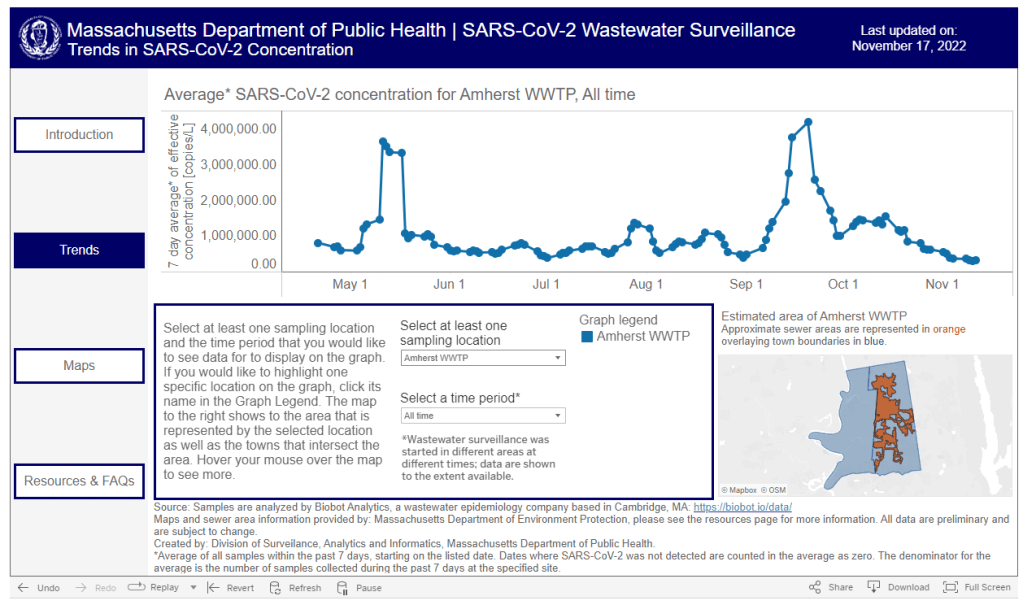
Where to find wastewater data for your community

The Massachusetts Department of Public Health is one of the latest state agencies to set up a public wastewater dashboard. As we head into the holidays with limited COVID-19 testing and undercounted case numbers, wastewater surveillance is the best way to evaluate how much the virus is spreading in your region. And it’s now available in more places than ever, thanks to the many research groups and public health agencies setting up sewage testing.
To help you find wastewater surveillance in your area, I recently updated my COVID-19 Data Dispatch resource page about U.S. wastewater dashboards. The page includes links to and notes about national, state, and a few local dashboards.
Let’s review the options. First, there are now three national dashboards with U.S. wastewater data, each covering a different set of locations.
- The CDC’s National Wastewater Surveillance System is the biggest, including more than 1,000 sites from almost every state, though some states have far better coverage than others. Click on an individual site to see coronavirus trends for that location.
- Biobot Analytics is the biggest private company doing wastewater surveillance; it provides analysis for hundreds of sites in the CDC NWSS network as well as its own, separate network. Biobot’s national and regional data (which include NWSS sites) are particularly helpful for large-scale trends.
- WastewaterSCAN is a project that started from an academic partnership between Stanford University, Emory University, the University of Michigan, and communities in California. It’s since expanded to include sites in about 20 states, and participating sewersheds are tested for monkeypox, flu, and RSV in addition to the coronavirus.
Second, 21 states currently have their own wastewater dashboards or reporting systems. If this is available in your area, I highly recommend looking at your local dashboard in addition to the national options. State and local dashboards tend to include more detailed and/or more frequently updated data, and are often tailored to their community’s needs more closely.
These are the states with wastewater dashboards; see the resource page for links and more info:
- California, Colorado, Georgia, Hawaii, Idaho, Indiana, Maine, Maryland, Massachusetts, Michigan, Minnesota, Missouri, Nebraska, New York State, North Carolina, Ohio, Oklahoma, Oregon, Utah, West Virginia, Wisconsin.
Wastewater trends do not correspond directly to infection trends, because people sick with COVID-19 might shed the virus at different rates (based on where they are in their infection, variants, and other factors). Some researchers are working to better understand the correlation between wastewater trends and cases, but for now, the sewage data are best understood as a broad indicator of risk—not a precise estimate of how many people in your community are sick.
For tips on interpreting wastewater data, I recommend looking at past COVID-19 Data Dispatch posts on this topic, as well as this FAQ from the People’s CDC.
More wastewater data
-
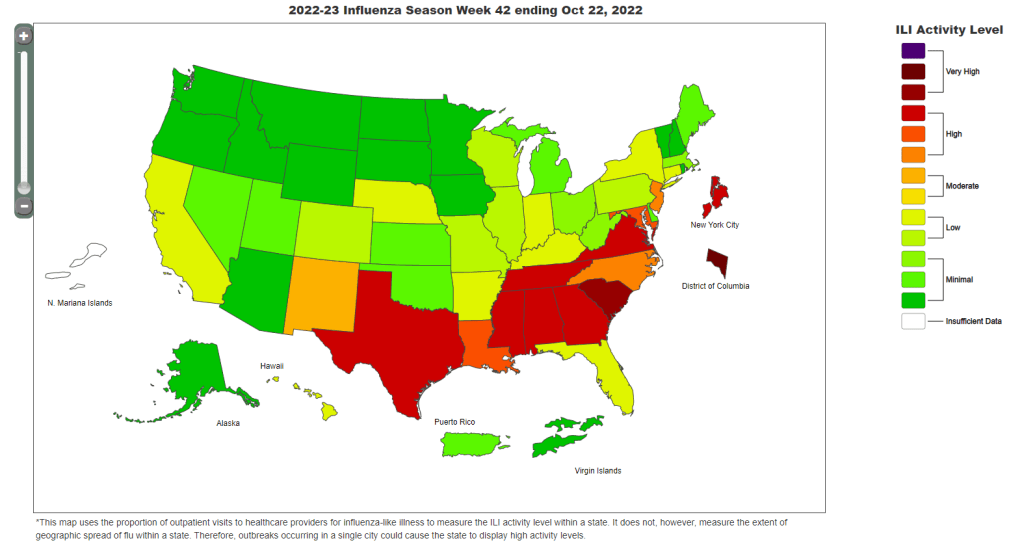
The U.S.’s flu and RSV surveillance is insufficient for tracking this fall’s outbreaks

The CDC’s FluView dashboard does not provide precise case numbers, only an approximation of “activity level.” I recently received a question from a reader, asking how to follow both COVID-19 and the flu in the county where she lives. For COVID-19, county-level data sources aren’t too hard to find: the CDC still provides some clinical data—though case numbers are now updated weekly, instead of daily—and many counties have wastewater surveillance available. (See last week’s post for more details.)
But following flu transmission is much harder: there’s no county-level tracking of this virus. The same thing goes for respiratory syncytial virus (RSV), a virus currently sending record cases to children’s hospitals across the country. There are a few data sources available, which I’ll list later in this post, though nothing as comprehensive as what we’ve come to expect for COVID-19.
As I’ve previously written, the COVID-19 pandemic inspired nationwide disease surveillance at a level the U.S. has never seen before. The healthcare and public health systems had not previously attempted to count up every case of a widely-spreading virus and share that information back to the public in close-to-real-time.
It’s unlikely that flu, RSV, and other diseases will get the same resources as COVID-19 did for intensive tracking—at least not in the near future. But the scale of data we’ve had during the pandemic reveals that our current surveillance for these diseases is pretty inadequate, even for such basic purposes as giving hospitals advanced warning about new surges.
Insufficient RSV data
A recent CNN story by Deidre McPhillips and Jacqueline Howard explains how data gaps have hindered preparation for the current RSV surge. The reporters explain that the CDC’s RSV data are “based on voluntary reporting from a few dozen labs that represent about a tenth of the population.” The CDC uses these reports to provide weekly estimates about RSV cases, though recent data tend to be incomplete due to reporting delays.
Here’s a helpful quote from the story (though I recommend reading the whole piece):
“For hospitals [using CDC data], it’s a little like looking through the rearview mirror. They’ve already begun to experience that uptick in cases themselves before it’s noticeable in the federal data,” said Nancy Foster, vice president for quality and patient safety with the American Hospital Association.
“We’re talking about data that are collected inside hospitals, transmitted through a data trail to get to the federal government, analyzed there and then fed back to hospitals.”
In other words, it’s not surprising that we saw plenty of stories about higher-than-normal RSV cases in children’s hospitals before national data actually picked up the surge. For more details on why RSV is spreading this fall and how it’s impacting children’s hospitals, I recommend this piece by Jonathan Lambert at Grid.
Insufficient flu data
Meanwhile, this year’s flu season is clearly starting earlier than normal; but current data aren’t able to tell us how severe the season might get or who, exactly, is being hit the hardest. According to the CDC’s flu surveillance report for this week, the agency estimates that the U.S. has seen “at least 880,000 flu illnesses, 6,900 hospitalizations, and 360 deaths from flu” so far this fall.
The CDC’s estimates come from networks of testing labs, hospitals, and outpatient healthcare providers that participate in the agency’s flu surveillance networks. National flu data tend to be imprecise estimates, clearly labeled as “preliminary” by the CDC, while state-by-state data are estimates reported with delays. Note, for example, that the CDC’s map of “influenza-like-activity” by state and by metro area provides only general categories of activity (ranging from “minimal” to “very high”) rather than actual case numbers.
The flu data we have so far aren’t sufficient for making predictions about how the rest of this fall and winter will go, explains STAT’s Helen Branswell in a recent story. “The virus is maddeningly unpredictable,” she writes. U.S. experts often look to the flu season in the Southern Hemisphere, which precedes ours, for clues, but this can be unreliable (just as the U.S. shouldn’t rely on other countries for all its vaccine effectiveness data).
For both flu and RSV, one major problem with our surveillance methods is that our systems overly rely on healthcare centers. When public health agencies have to wait for hospitals and clinics to report cases of these viruses before starting to analyze data, they miss the opportunity to warn healthcare providers at the very beginning of a surge—and give them time to prepare.
In the future, expanding non-clinical surveillance methods like wastewater and population surveys to these diseases would provide more data, more quickly; both for healthcare providers and for the general public. (I provided some more specific ideas here.)
Existing sources
With all the above caveats in mind, here are a few sources you can look at to track flu and RSV:
- CDC’s weekly flu surveillance report: This page is updated once a week with national estimates of flu activity, hospitalizations, flu virus variants, and more. Data tend to be preliminary.
- CDC’s FluView dashboard: Information from the CDC’s flu surveillance system also appears on this dashboard in a more interactive format; for example, you can see how flu activity by state has changed over time.
- CDC’s RSV trends report: Similar to its flu reports, the CDC provides weekly updates of estimated RSV tests and cases, including national, regional, and state-by-state trends.
- Walgreens flu index: Walgreens tracks prescriptions for antiviral medications at its pharmacies as a proxy for flu activity, by state and for select metro areas. For more information on the index, see this press release.
- WastewaterSCAN: The SCAN network, run by researchers at Stanford University and Emory University, tests wastewater for flu, RSV, and monkeypox in addition to COVID-19 in select counties across the U.S. So far, this network is the first I know of to publicly share flu and RSV wastewater data, though other researchers are working in this area.
Please let me know if I missed any data sources! (You can email me or comment below.)
More federal data
