Tag: BA.4 and BA.5

  • The Omicron subvariants start coming and they don’t stop coming

    The Omicron subvariants start coming and they don’t stop coming

    A veritable alphabet soup of subvariants. Chart from the CDC, data as of October 15.

    When the CDC updated its variant prevalence estimates this week, the agency added new versions of Omicron to the dashboard. In the U.S., COVID-19 cases are now driven by: BA.5, BA.4.6, BQ.1, BQ.1.1, BF.7, BA.2.75, and BA.2.75.2. And possibly more subvariants that we aren’t tracking yet.

    As evolutionary biology expert T. Ryan Gregory pointed out on Twitter recently, Omicron’s evolution is “off the chart.” 

    Or, to parody Smash Mouth: the Omicron variants start coming and they don’t stop coming and they don’t stop coming and they don’t stop coming…

    Let’s go over the veritable alphabet soup of variants we’re dealing with right now, as well as one newer variant identified in east Asia that experts are closely watching.

    BA.5, BA.4, BA.4.6

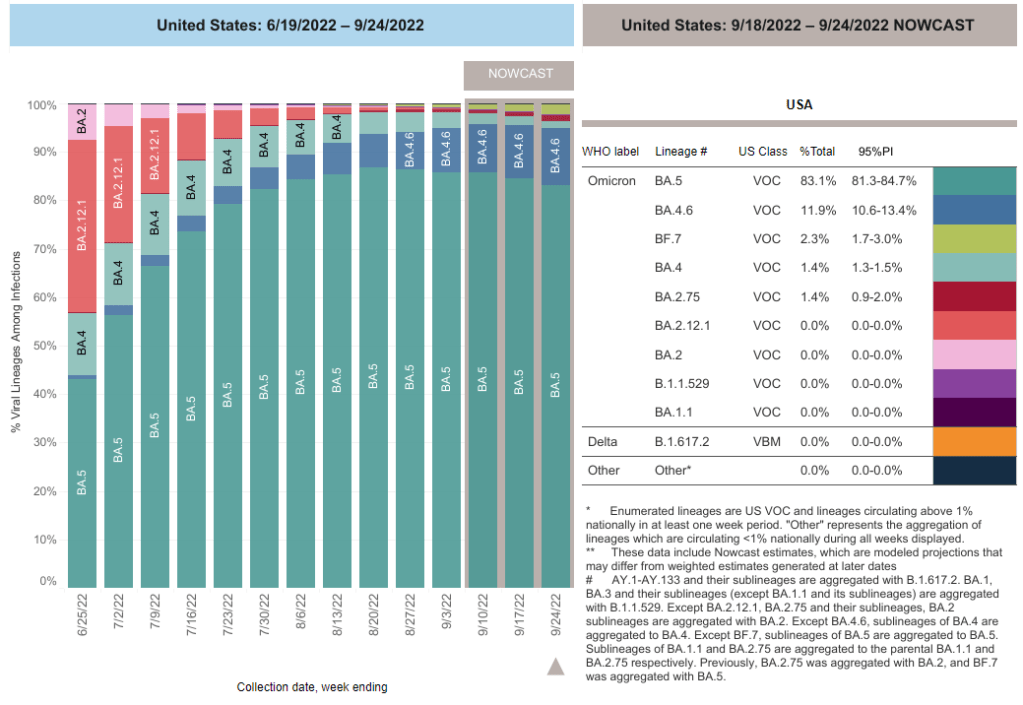
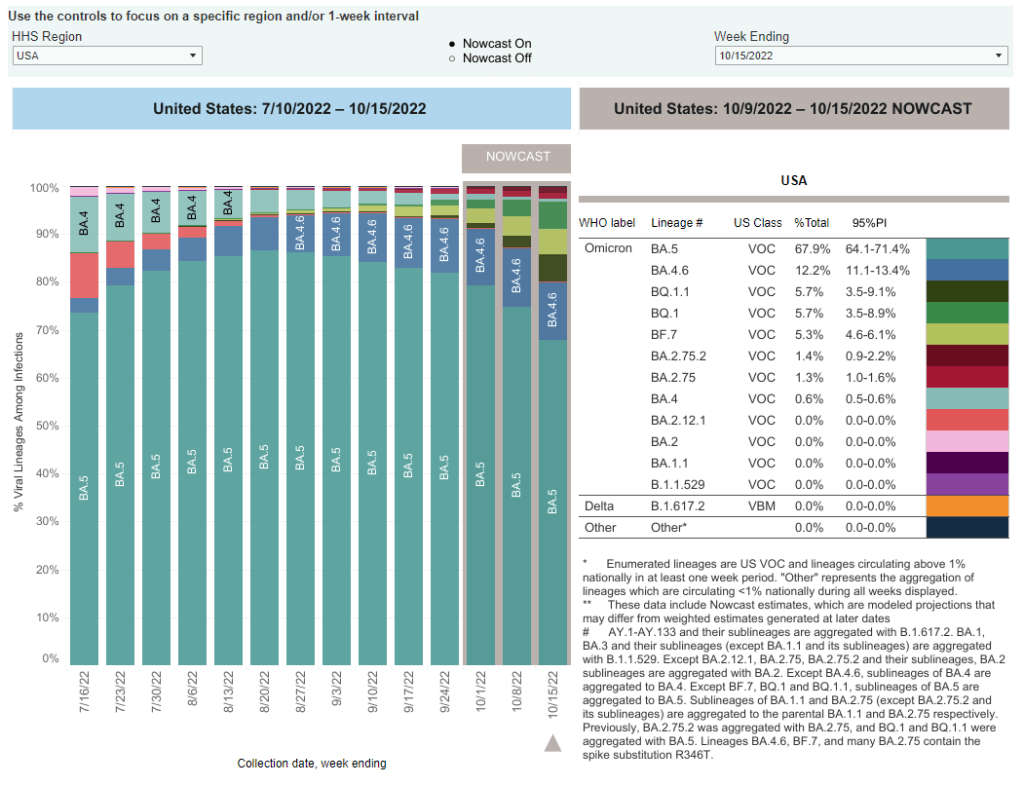
    BA.5 is currently the dominant Omicron lineage in the U.S., causing about two-thirds of new COVID-19 cases in the week ending October 15. Along with BA.4, BA.5 split off from the original Omicron lineage and was first identified by South African scientists over the summer.

    As these two subvariants spread around the world, it quickly became clear that they could spread faster than other versions of Omicron and reinfect people who’d previously gotten sick with those prior lineages. For more details, see this post from June. BA.5 later pulled out from BA.4 as the most competitive lineage.

    BA.4.6 evolved out of BA.4. It appears to have a small advantage over BA.5, but can’t really compete with the newer subvariants we’re seeing now; according to the CDC’s estimates, it’s been causing around 10% to 12% of new cases nationwide for the last few weeks (without much growth).

    BQ.1 and BQ.1.1

    BQ.1 and its descendant BQ.1.1 are the two newest subvariants to show up in the CDC’s prevalence estimates, both causing about 5.7% of new cases nationwide in the last week. They actually evolved out of BA.5: BQ.1 is shorthand for a much longer, more unwieldy variant name that nobody wants to type out on Twitter.

    In the U.S., BQ.1 and BQ.1.1 are starting to outcompete their parent lineage, BA.5. They’ve grown from causing less than 1% of new cases to over 10% of new cases in the last month. These subvariants are also now outcompeting other strains in the U.K. and other European countries.

    As CBS News’s Alexander Tin explains, health experts are concerned that COVID-19 treatments like monoclonal antibodies might work less well against BQ.1 and BQ.1.1. We don’t have clear data on this yet, but pharmaceutical companies will test out the newer variants in the weeks to come. The Omicron bivalent boosters, at least, are expected to continue working against this lineage.

    BF.7

    BF.7 is another offshoot of BA.5 (again, this is shorthand for a longer name). I dedicated a post to it in late September, and the subvariant’s position hasn’t changed significantly since then: it seems to be a bit more transmissible than BA.5, but not so much that it is quickly outcompeting the parent lineage. BF.7 caused about 5% of new cases nationwide in the last week.

    Similarly to BQ.1 and BQ.1.1, there are some concerns that COVID-19 treatments will be less effective against BF.7 than other versions of Omicron based on the subvariant’s spike protein mutations, but we do not have clinical data at this point.

    BA.2.75 and BA.2.75.2

    BA.2.75, as you might guess from the notation, evolved out of BA.2—the same original Omicron lineage that produced BA.2.12.1 and drove surges in places like New York City over the summer. It has also remained present at fairly low levels across the U.S. recently, causing just 1.3% of new cases in the last week, according to the CDC’s estimates.

    But BA.2.75 now has its own offshoot, called BA.2.75.2, that appears to be a bit more competitive. The CDC recently started splitting BA.2.75.2 out of its parent lineage in its prevalence estimates, showing that it’s growing a bit faster (from 0.4% to 1.4% in the last month). Of course, this growth rate pales in comparison to what we’re seeing from the BA.5 sublineages described above.

    XBB

    XBB is the latest international subvariant of concern, identified this week in several east Asian countries. It has spread particularly quickly in Singapore, as described in this article by David Axe at the Daily Beast.

    Like BA.2.75, XBB descended from Omicron BA.2—though it’s gone through more rounds of spike protein mutation; this is why experts are calling it XBB, rather than a long string attached to BA.2. Data so far indicate its growth advantage over BA.5 is similar to what we’re seeing from BQ.1.1. XBB has also raised concerns about treatment and vaccine efficacy, since the bivalent boosters were developed from BA.4 and BA.5. 

    The CDC and other health agencies have yet to identify XBB in the U.S.; experts are closely watching how this new subvariant might be able to compete with our current variations on BA.5.

    Overall takeaways

    Overall, both in the U.S. and around the world, we’re seeing a lot of competition between these subvariants. All of them have small growth advantages over BA.5—which is currently dominant in the U.S.—but none are so different that they’re completely pulling ahead.

    As I wrote last weekend, many experts are anticipating a surge this fall and winter, driven by both new subvariants and less-cautious beavior. We likely won’t see a huge spike at the level of last winter’s massive Omicron surge, but this season will still have plenty of infections (and reinfections).

    We will need more data on how all these newer variants respond to vaccines and treatments, especially the antiviral Paxlovid. But it’s at least promising that many of the circulating variants right now evolved from BA.5, against which our bivalent boosters were specifically designed. It’s a great time to get that booster!

    More variant data

  • BF.7, yet another Omicron subvariant of concern

    BF.7, yet another Omicron subvariant of concern

    BF.7 (shown here in light green) is among the Omicron subvariants starting to push out BA.5. Chart via the CDC.

    Omicron BF.7, an offshoot of BA.5, is the latest subvariant to raise red flags among experts tracking COVID-19 in the U.S.

    This week, BF.7 passed BA.2.75, another worrying lineage, in the CDC’s prevalence estimates: the CDC found that it caused about 2.3% of new cases nationwide in the week ending September 24. It’s most prevalent in the Northeast right now: in New England, it caused almost 4% of new cases last week, the CDC estimates.

    BF.7 has an additional spike protein mutation compared to BA.5, CDC spokesperson Jasmine Reed told CBS News last week. The agency is concerned that this “genetic change” could lead to Evusheld, an antibody drug used by immunocompromised people, becoming less effective. It could also contribute to a new wave of reinfections, as we’ve seen with other Omicron subvariants in the last few months.

    Here’s a quote from Dr. Stuart Ray, a data expert at John Hopkins’ Department of Medicine, in a Fortune article about BF.7:

    “The same growth advantage in multiple countries makes it reasonable to think that BF.7 is gaining a foothold,” and that it’s potentially more transmissible than parent BA.5, Ray said. Children of variants “don’t grow relative to their parent unless they have an advantage.”

    We have relatively little data on BF.7 so far, but it’s worth monitoring closely in the coming weeks.

    More on variants

  • National numbers, September 11

    National numbers, September 11

    A week after new COVID-19 boosters were authorized, the U.S. has yet to see a significant jump in vaccine doses administered. Chart via the CDC.

    In the past week (September 3 through 9), the U.S. reported about 500,000 new COVID-19 cases, according to the CDC. This amounts to:

    • An average of 70,000 new cases each day
    • 150 total new cases for every 100,000 Americans
    • 19% fewer new cases than last week (August 27-September 2)

    In the past week, the U.S. also reported about 32,000 new COVID-19 patients admitted to hospitals. This amounts to:

    • An average of 4,600 new admissions each day
    • 9.9 total admissions for every 100,000 Americans
    • 11% fewer new admissions than last week

    Additionally, the U.S. reported:

    • 2,200 new COVID-19 deaths (0.7 for every 100,000 people)
    • 88% of new cases are caused by Omicron BA.5; 9% by BA.4.6 (as of September 10)
    • An average of 25,000 vaccinations per day (per Bloomberg)

    It might appear that the U.S. reported a significant drop in COVID-19 cases last week, as the CDC’s numbers dropped to about 70,000 new cases a day last week from 87,000 new cases a day in the prior week. But in fact, the decline was likely exaggerated by Labor Day weekend, as testing labs and the public health workers who crunch data took time off.

    Wastewater data from the last two weeks tell a different story. In Biobot’s most recent update, the company reported a slight increase in coronavirus concentration in wastewater at the national level. Regionally, the virus grew in the Northeast, Midwest, and South.

    While hospital admissions and other healthcare system metrics continue to show a decline, wastewater data is often an advanced indicator for new coronavirus surges. In this case, it could mean the often-predicted fall wave is beginning in some parts of the country. Remember: wastewater surveillance can catch transmission upticks early because it doesn’t rely on individuals getting PCR tests or seeking out healthcare—factors that can cause lags and undercounting in case and hospitalization data.

    Potential factors contributing to increased COVID-19 outbreaks might include holiday gatherings and travel, the start of the school year, and new Omicron subvariants taking over. BA.4.6, the lineage from BA.4 that may be even more transmissible, went from causing about 8% of new cases in the week ending September 3 to 9% in the week ending September 10, according to CDC estimates; meanwhile, BA.5’s prevalence dropped by about 1%.

    This might seem like a small shift, but it is an indicator of BA.4.6’s capacity to eventually outcompete BA.5—and reinfect people who previously caught a different version of Omicron. BA.4.6 is causing a higher share of cases in the Midwest, specifically in Iowa, Kansas, Missouri, and Nebraska, so those are states to particularly watch for increased COVID-19 spread.

    At the same time, the CDC reports that 1% of cases nationwide were caused by BA.2 lineages (not BA.2.12.1) last week. This is likely the work of BA.2.75, another subvariant of concern that the CDC isn’t yet tracking separately. (More on that later in the issue.)

    The federal government’s main action to mitigate this probably-coming surge is a new booster campaign, with the Omicron BA.4/BA.5 shots authorized last week. But vaccination numbers have been low so far, with far fewer than 100,000 doses administered each day last week.

  • National numbers, September 4

    National numbers, September 4

    Coronavirus trends in wastewater compared to official case numbers, since spring 2020. Screenshot from Biobot’s dashboard, retrieved September 4.

    In the past week (August 27 through September 2), the U.S. reported about 590,000 new COVID-19 cases, according to the CDC. This amounts to:

    • An average of 80,000 new cases each day
    • 179 total new cases for every 100,000 Americans
    • 8% fewer new cases than last week (August 20-26)

    In the past week, the U.S. also reported about 36,000 new COVID-19 patients admitted to hospitals. This amounts to:

    • An average of 5,100 new admissions each day
    • 10.8 total admissions for every 100,000 Americans
    • 4% fewer new admissions than last week

    Additionally, the U.S. reported:

    • 2,800 new COVID-19 deaths (0.9 for every 100,000 people)
    • 89% of new cases are caused by Omicron BA.5; 8% by BA.4.6 (as of September 3)
    • An average of 70,000 vaccinations per day (per Bloomberg)

    Over the past month, COVID-19 trends in the U.S. have been fairly consistent: disease spread has declined slowly around the country. Official case counts dropped from about 120,000 a day in the first week of August, to about 80,000 a day last week.

    New hospital admissions, a more reliable metric these days, have also declined. A month ago, U.S. hospitals were admitting over 6,000 new COVID-19 patients a day; last week, that number was about 5,000. Wastewater data from Biobot and from the CDC suggest that this trend has been broadly consistent across different regions.

    But coronavirus transmission is not currently at low levels by any means. For example, look at Biobot’s national chart showing virus concentration in wastewater compared to officially-reported case numbers. From case numbers alone, you might think that COVID-19 is much less prevalent now than it was in late August or early September last year. But the wastewater data reveal that transmission now is actually pretty close to early-Delta surge levels. (It is, in fact, PCR testing that has declined.)

    Similarly, the CDC’s Community Transmission Levels (also known as the older metrics, based on cases and test positivity) show that about 90% of U.S. counties are currently facing high transmission and should require masks indoors. Even the current—and much more lenient—Community Levels suggest that more than half of the country is in a high- or medium-COVID-risk zone.

    The summer surge has waned so slowly thanks to the U.S.’s complete abandonment of measures to mitigate COVID-19’s spread, combined with the rise of newer Omicron subvariants. BA.5 continues to dominate here, causing almost 90% of new cases in the week ending September 3, though it’s facing competition from BA.4.6: a version of BA.4 that appears to have a slight advantage.

    Most experts agree that we will probably face another surge this fall and winter, as more people gather inside and travel for the holidays. The question is how severe that wave will be, which may be determined via a contest between updated vaccines (more on that later in the issue) and the coronavirus’ continued capacity for mutation.

    One potential sign of such a wave: wastewater surveillance in South Africa has picked up an increase in coronavirus concentration, Bloomberg reported yesterday. Also: your usual reminder to be wary of data trends in the days following the holiday weekend.

  • National numbers, July 31

    National numbers, July 31

    New hospital admissions for COVID-19 are slowing nationwide, a potential sign of the subvariant surge peaking. Chart via the CDC, retrieved on July 31.

    In the past week (July 23 through 29), the U.S. reported about 880,000 new COVID-19 cases, according to the CDC. This amounts to:

    • An average of 130,000 new cases each day
    • 269 total new cases for every 100,000 Americans
    • 1% fewer new cases than last week (July 16-22)

    In the past week, the U.S. also reported about 44,000 new COVID-19 patients admitted to hospitals. This amounts to:

    • An average of 6,300 new admissions each day
    • 13.5 total admissions for every 100,000 Americans
    • 2% more new admissions than last week

    Additionally, the U.S. reported:

    • 2,500 new COVID-19 deaths (0.8 for every 100,000 people)
    • 82% of new cases are caused by Omicron BA.5; 13% by BA.4 (as of July 23)
    • An average of 100,000 vaccinations per day (per Bloomberg)

    The U.S.’s Omicron BA.5 wave appears to be creeping past its plateau, according to several major indicators. Nationwide, 1% fewer new cases were reported this week compared to last week, the second week in a row of clear deceleration in this metric (with no major holidays interrupting reports).

    New hospital admissions are also slowing down: the number of COVID-19 patients newly admitted to hospitals this week was only 2% higher than it was last week. It’s a smaller increase than any reported week-over-week in the last couple of months.

    And the plateau is showing up in wastewater, too: data from Biobot Analytics show that the coronavirus concentration in America’s sewers dipped slightly last week in all four regions of the country. About 55% of sewersheds in the CDC’s wastewater surveillance network reported coronavirus decreases or very slight increases in the last week, compared to 45% reporting more significant increases.

    To me, these metrics are suggesting that the Omicron subvariant wave may be, finally, running out of people to infect (or reinfect). But the decline is incredibly slow, likely because the U.S. has taken almost no measures to curb transmission.

    The CDC’s community transmission guidance (also known as the old guidance, pre-February 2022 switch to “Community Levels”) suggests that Americans in 98% of counties should be masking indoors right now. But almost no state or local public health departments have actually brought back mask requirements. Even Los Angeles County failed to institute its planned indoor mask mandate, due to public pushback at the measure and cases trending down.

    Meanwhile, testing indicators continue to suggest that reported case counts are a small fraction of the actual coronavirus infections happening across the country right now. The national PCR test positivity rate was 18% last week, according to the CDC; and almost every state reported a positivity rate over 10%, according to the July 28 Community Profile Report. (Experts consider test positivity over 10% to be evidence of high transmission and insufficient testing.)

    As fewer PCR tests are conducted, the companies that process these tests are laying off workers and cutting their capacity, according to the Wall Street Journal. Even some companies that make at-home rapid tests are taking these measures, though rapid test capacity is still much higher than PCR testing capacity right now.

    The safety measures that can prevent coronavirus transmission have not changed with BA.5. Individuals and small communities still have the ability to keep using masks, testing, gathering in outdoor spaces, etc., even as our institutions fail to keep us safe.

  • National numbers, July 24

    National numbers, July 24

    Has the BA.5 surge reached a plateau? Data from wastewater and other sources seem to suggest, maybe. Chart via Biobot Analytics.

    In the past week (July 16 through 22), the U.S. reported about 880,000 new COVID-19 cases, according to the CDC. This amounts to:

    • An average of 130,000 new cases each day
    • 268 total new cases for every 100,000 Americans
    • 1% more new cases than last week (July 9-15)

    In the past week, the U.S. also reported about 43,000 new COVID-19 patients admitted to hospitals. This amounts to:

    • An average of 6,200 new admissions each day
    • 13.2 total admissions for every 100,000 Americans
    • 5% more new admissions than last week

    Additionally, the U.S. reported:

    • 2,400 new COVID-19 deaths (0.7 for every 100,000 people)
    • 78% of new cases are caused by Omicron BA.5; 13% by BA.4 (as of July 16)
    • An average of 100,000 vaccinations per day (per Bloomberg)

    Reported COVID-19 cases and hospital admissions seem to suggest that maybe the BA.5 surge is slowing down, at the national level. (And it is, definitively, the BA.5 surge, with almost 80% of new cases caused by this subvariant in the week ending July 16). According to CDC data, new cases only increased by 1% this week, compared to the week prior; last week, they increased by 17%.

    New hospital admissions, similarly, increased by 5% this week, compared to 15% the week prior. And wastewater data from Biobot are showing a potential national plateau in the last week, with very slight increases or decreases in all four main regions of the country.

    The CDC’s wastewater monitoring also shows that “most of the country is reporting moderate to high SARS-CoV-2 levels in wastewater.” About half of the 800 sites in the CDC network reported a decrease in coronavirus levels in the last two weeks, while 43% reported an increase.

    These are all good signs. But I’m skeptical that we’re anywhere near the end of this current surge, for a few reasons. First, the continued underreporting of cases makes it difficult to evaluate case data, both nationally and in local settings. (For example, is NYC actually seeing a decline in transmission, or is the recent decline there a result of less PCR testing?) The CDC reported a national PCR test positivity of 17% last week, and it’s even higher in many states.

    Second, the declines we’re seeing in hospital admissions and coronavirus levels in wastewater—both more reliable indicators than cases—are very slight. These patterns suggest that, while we may be near the peak of the BA.5 surge, it could take several weeks for it to actually abate. And by the time that happens, another new variant (maybe BA.2.75, maybe something else entirely) could likely come in and bump transmission again.

    Finally, the U.S. as a whole is doing very little to manage this surge. I think this subheading from a recent POLITICO Pro article provides a good summary of the situation: “Strategies for managing 130,000 new daily Covid cases are largely the same as they were for managing 30,000 new daily cases four months ago.”

    There’s been a slight uptick in second booster shots for Americans over age 50, according to CDC data. And a few, isolated localities are considering new mask mandates. But by and large, most people are heading into potential reinfection from BA.5 with limited protection. Stay safe out there.

  • National numbers, July 17

    National numbers, July 17

    More than 40% of COVID-19 tests conducted at Walgreens pharmacies in the last week came back positive. This is not a good indicator, to put it mildly.

    In the past week (July 9 through 15), the U.S. reported about 870,000 new COVID-19 cases, according to the CDC. This amounts to:

    • An average of 120,000 new cases each day
    • 265 total new cases for every 100,000 Americans
    • 16% more new cases than last week (July 2-8)

    In the past week, the U.S. also reported about 41,000 new COVID-19 patients admitted to hospitals. This amounts to:

    • An average of 5,900 new admissions each day
    • 12.5 total admissions for every 100,000 Americans
    • 14% more new admissions than last week

    Additionally, the U.S. reported:

    • 2,500 new COVID-19 deaths (0.8 for every 100,000 people)
    • 65% of new cases are caused by Omicron BA.5; 16% by BA.4 (as of July 9)
    • An average of 80,000 vaccinations per day (per Bloomberg)

    As I suspected last week, the small dip in official COVID-19 case numbers was a result of the July 4 holiday, not an actual decline in transmission. This week, cases are up again nationwide, with the highest number reported since early February.

    Of course, PCR testing capacity has declined substantially since February. And test positivity rates are high across the country: the CDC reported a nationwide rate of 17.5%, while the Walgreens COVID-19 Index (which compiles data from testing at Walgreens pharmacies) reports a rate of 42%. Such high positivity numbers indicate that our official case data are capturing a small fraction of cases.

    And we have other indicators of the substantial COVID-19 spread happening right now. Biobot’s wastewater tracker reports increased transmission nationwide and in all four regions in the last two weeks. Over half of sewershed sites in the CDC’s National Wastewater Surveillance System reported increases in the two weeks ending July 11—and for about one-third of sites, those increases were more than 100%.

    New hospital admissions of COVID-19 patients went up by 14% last week, similarly to the highest levels reported since February. Reports of COVID-19 symptoms are also on the upswing, according to survey data collected by the Delphi Group at Carnegie Mellon University.

    While some hospitalization metrics and deaths may be low at the moment, remember that these are lagging indicators: they go up a few weeks after cases. And cases are definitely going up right now, driven by the Omicron subvariant BA.5—which is now dominant in the country.

    BA.5 and BA.4 together caused more than 80% of new COVID-19 cases in the week ending July 9, according to CDC estimates. BA.5 is pulling ahead, though, readily reinfecting people in a national climate that seems to have largely given up on safety measures.

    But measures like masking, testing, and booster shots can still reduce transmission. I was heartened this week to see Los Angeles County preparing for a new indoor mask mandate in response to rising cases; other places should follow this lead.

  • BA.2.75 is the latest Omicron subvariant of concern

    BA.2.75 is the latest Omicron subvariant of concern

    BA.2.75 has further mutations which could allow the variant to bypass past immunity. Figure via scientist Ulrich Elling on Twitter.

    As if BA.4 and BA.5 aren’t already enough to worry about: some COVID-19 experts are sounding the alarm about BA.2.75, a new version of Omicron that evolved out of BA.2.

    This subvariant was first identified in India in late May, and has now been reported in the U.K., Germany, and several other countries, according to the World Health Organization. Scientists are concerned because it has new spike protein mutations that could heighten its ability to bypass immunity from past infections or vaccinations—including, potentially, from BA.4 or BA.5.

    At least three BA.2.75 cases have been reported in the U.S. so far, according to a Friday press release from the surveillance company Helix. Two of these cases were on the West Coast, in Washington and California. These cases are currently lumped in with other versions of BA.2 on the CDC dashboard.

    The information on BA.2.75 is fairly preliminary at this point; the WHO is monitoring it as an additional lineage of Omicron, not a separate variant of concern, and watching for new data. It’s unclear how competitive it might be with BA.5, now dominant in the U.S., but is worth keeping an eye on. As Dr. Katelyn Jetelina points out in a recent issue of Your Local Epidemiologist, the spread of BA.2.75 could further complicate fall booster shot plans. 

    More variant reporting

  • National numbers, July 10

    National numbers, July 10

    Almost the entire country is currently experiencing high COVID-19 transmission, according to the old CDC guidance. And that’s just the cases we know about.

    In the past week (July 2 through 8), the U.S. reported about 750,000 new COVID-19 cases, according to the CDC. This amounts to:

    • An average of 110,000 new cases each day
    • 227 total new cases for every 100,000 Americans
    • 4% fewer new cases than last week (June 25-July 1)

    In the past week, the U.S. also reported about 36,000 new COVID-19 patients admitted to hospitals. This amounts to:

    • An average of 5,000 new admissions each day
    • 10.8 total admissions for every 100,000 Americans
    • 3% more new admissions than last week

    Additionally, the U.S. reported:

    • 1,900 new COVID-19 deaths (0.6 for every 100,000 people)
    • 27% of new cases are Omicron BA.2.12.1-caused; 70% BA.4/BA.5-caused (as of July 2)
    • An average of 150,000 vaccinations per day (per Bloomberg)

    Our prolonged Omicron subvariant surge continues, now dominated clearly by BA.5. While reported COVID-19 cases dipped slightly last week at the national level, this is almost certainly a result of the July 4 holiday rather than an actual slowing in coronavirus transmission.

    As evidence, note that the number of COVID-19 patients newly reported to hospitals—a metric less impacted by holidays—continued to rise last week. About 5,000 new patients were admitted each day, double the hospitalization rate in early May.

    Anecdotally, it seems like everyone knows someone who has COVID-19, even if their cases aren’t making it into official data due to at-home tests. And many of those people sick right now already had Omicron BA.1—or even BA.2—earlier this year. Such is the power of BA.4 and BA.5, the subvariants that have taken over the U.S. and many other countries in recent weeks.

    BA.5 in particular seems to have a competitive advantage over all other Omicron subvariants. It’s now causing the majority of new COVID-19 cases in the country, with the most recent CDC estimates placing it at 54% prevalence as of July 2. This recent New York Magazine article does a good job of explaining by BA.5 is so worrying, as does this piece in the Guardian.

    To quote from Melody Schreiber’s Guardian article:

    “Covid-19 is very clearly not over. We’re seeing dramatic increases in the number of cases and hospitalizations in many places throughout the United States,” said Jason Salemi, an associate professor of epidemiology at the University of South Florida’s College of Public Health.

    As BA.5, one of the Omicron sub-variants, begins buffeting the US, “we’re headed in a bad direction”, Salemi said. “We’ve seen it coming for a while … We’ve seen it go pretty unabated.”

    More than one in three Americans live in a county at medium risk from Covid, and one in five are at high risk, according to the US Centers for Disease Control and Prevention (CDC) . That’s the highest proportion of the country facing risks since February, Salemi said.

    Wastewater data from Biobot similarly shows transmission continuing to plateau or increase throughout the country. The Northeast, one region where BA.2 and BA.2.12.1 seemed to peak a couple of weeks ago, is now reporting case increases again. In New York City, for example, all five boroughs are now back in the CDC’s “high risk for hospitalizations” category.

    As this surge continues, essential workers and those who are medically vulnerable continue to be most at risk. Remember this, when you consider masking and other precautions.

  • We need more data for fall booster decisions

    We need more data for fall booster decisions

    At the FDA advisory committee meeting this week, Pfizer presented data from different options of Omicron-specific booster shots.

    This week, the FDA’s vaccine advisory committee met to discuss fall booster shots, in anticipation of another COVID-19 surge next winter. The discussion demonstrated the U.S.’s continued failure to provide the data that are really needed to make these decisions.

    I have written a lot about this topic in the past, so to avoid being too repetitive, I’ll link to a couple of past articles:

    But here’s the TL;DR: due to the fractured nature of America’s public health system, it’s difficult for researchers to connect data on different health metrics. For example, a state might have one database with vaccination records and another database with case records, and the databases might not easily link to answer questions about breakthrough cases.

    Some state health departments have figured out how to make these links, but the process is not uniform. And the breakthrough case data we do have generally aren’t linked to information on variants, or demographic data, or outcomes like Long COVID.

    The more specific the vaccine effectiveness question, the more complicated it becomes to answer. This is a bigger problem now as the FDA considers fall boosters, because the agency needs to determine the best vaccine candidate and identify priority populations for shots—while operating in a politcal climate where vaccine funding is less popular than it was a year ago.

    Here are a few questions that the FDA is trying to answer, drawing from the STAT News meeting recap:

    • Should the fall booster be a monovalent vaccine, meaning it only includes Omicron-specific genetic material? Or should it be bivalent, meaning it includes both Omicron and the original, Wuhan strain? Pfizer and Moderna presented different options; some experts say a bivalent vaccine may provide more long-term protection.
    • Should the booster shot be specific to BA.4 and BA.5? The panel agreed that it should, as these strains are now dominant in the U.S., but there’s a timing trade-off as vaccine companies have yet to do clinical trials (or provide substantial data) for a subvariant-specific vaccine.
    • Should the booster shot be another type of vaccine entirely? In addition to Pfizer and Moderna, the FDA panel also heard from Novavax. This company has developed a protein-based vaccine that hasn’t yet received FDA authorization, but panelists were impressed by its potential for long-term protection.
    • How well do the vaccines provide non-antibody-based protection? As in past advisory committee meetings, the vaccine companies primarily presented data based on antibodies generated from their shots. Experts wanted to see more data about T cells and other aspects of immunity which are harder to measure, but may be more important in the long term.
    • Who would most benefit from another booster? If the federal government isn’t able to buy enough shots for everyone, priortization will need to happen. Will Omicron-specific boosters be most useful for seniors, or for people with certain health conditions? These groups will likely get priority again, though we could still be collecting more data on how the vaccines fare for them.

    Of course, despite the dearth of data and cautions from some members of the FDA advisory committee, the U.S. government seems to be going full-speed ahead with fall boosters. The Biden administration has placed a $3.2 billion order from Pfizer for 105 million doses of whichever Omicron-specific vaccine the FDA chooses to authorize.

    More vaccine reporting