
In the past week (August 27 through September 2), the U.S. reported about 590,000 new COVID-19 cases, according to the CDC. This amounts to:
- An average of 80,000 new cases each day
- 179 total new cases for every 100,000 Americans
- 8% fewer new cases than last week (August 20-26)
In the past week, the U.S. also reported about 36,000 new COVID-19 patients admitted to hospitals. This amounts to:
- An average of 5,100 new admissions each day
- 10.8 total admissions for every 100,000 Americans
- 4% fewer new admissions than last week
Additionally, the U.S. reported:
- 2,800 new COVID-19 deaths (0.9 for every 100,000 people)
- 89% of new cases are caused by Omicron BA.5; 8% by BA.4.6 (as of September 3)
- An average of 70,000 vaccinations per day (per Bloomberg)
Over the past month, COVID-19 trends in the U.S. have been fairly consistent: disease spread has declined slowly around the country. Official case counts dropped from about 120,000 a day in the first week of August, to about 80,000 a day last week.
New hospital admissions, a more reliable metric these days, have also declined. A month ago, U.S. hospitals were admitting over 6,000 new COVID-19 patients a day; last week, that number was about 5,000. Wastewater data from Biobot and from the CDC suggest that this trend has been broadly consistent across different regions.
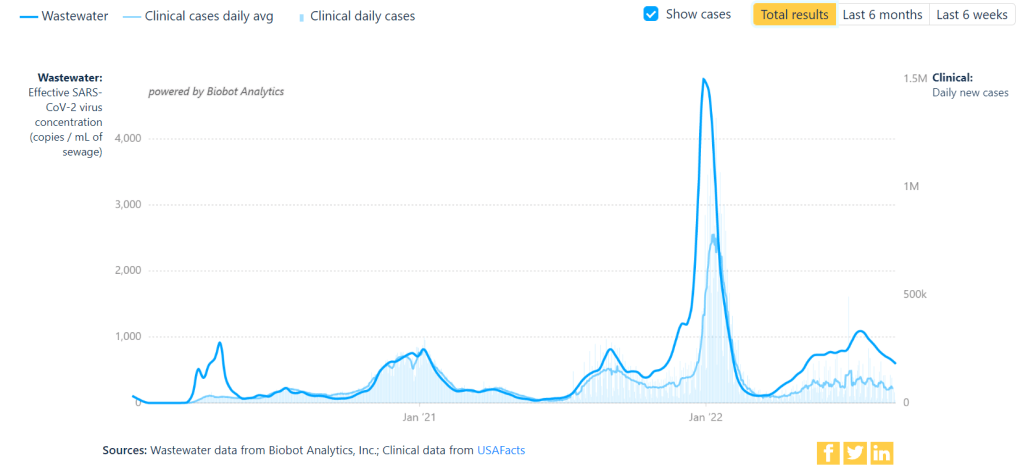
But coronavirus transmission is not currently at low levels by any means. For example, look at Biobot’s national chart showing virus concentration in wastewater compared to officially-reported case numbers. From case numbers alone, you might think that COVID-19 is much less prevalent now than it was in late August or early September last year. But the wastewater data reveal that transmission now is actually pretty close to early-Delta surge levels. (It is, in fact, PCR testing that has declined.)
Similarly, the CDC’s Community Transmission Levels (also known as the older metrics, based on cases and test positivity) show that about 90% of U.S. counties are currently facing high transmission and should require masks indoors. Even the current—and much more lenient—Community Levels suggest that more than half of the country is in a high- or medium-COVID-risk zone.
The summer surge has waned so slowly thanks to the U.S.’s complete abandonment of measures to mitigate COVID-19’s spread, combined with the rise of newer Omicron subvariants. BA.5 continues to dominate here, causing almost 90% of new cases in the week ending September 3, though it’s facing competition from BA.4.6: a version of BA.4 that appears to have a slight advantage.
Most experts agree that we will probably face another surge this fall and winter, as more people gather inside and travel for the holidays. The question is how severe that wave will be, which may be determined via a contest between updated vaccines (more on that later in the issue) and the coronavirus’ continued capacity for mutation.
One potential sign of such a wave: wastewater surveillance in South Africa has picked up an increase in coronavirus concentration, Bloomberg reported yesterday. Also: your usual reminder to be wary of data trends in the days following the holiday weekend.

Leave a comment