This week, the CDC titled its weekly COVID-19 data report, “Keep Variants at Bay. Get Vaccinated Today.” I love a good rhyme, but the report also makes a valuable point: vaccinations not only protect individuals from coronavirus variants, they also reduce community transmission—slowing down future viral mutation.
Delta, or B.1.617.2, is particularly dangerous. As I’ve written before, this variant spreads much more quickly than other strains of the coronavirus and may cause more severe illness, though scientists are still investigating that second point. Thanks to this variant, it’s now much more dangerous to be unvaccinated than it was a year ago.
The Delta variant was first linked to a surge in India, but it’s now become dominant in the U.K., Russia, Indonesia, and other countries. As Eric Topol recently pointed out on Twitter, the variant’s dominance has led to sharp rises in cases—and in deaths—for these nations.
Countries where the Delta variant has become dominant. A sharp rise in cases. In Russia and Indonesia, where vaccination rates are low, 14% and 9%, respectively, also a spike in fatalities. pic.twitter.com/8omOCq6NIY
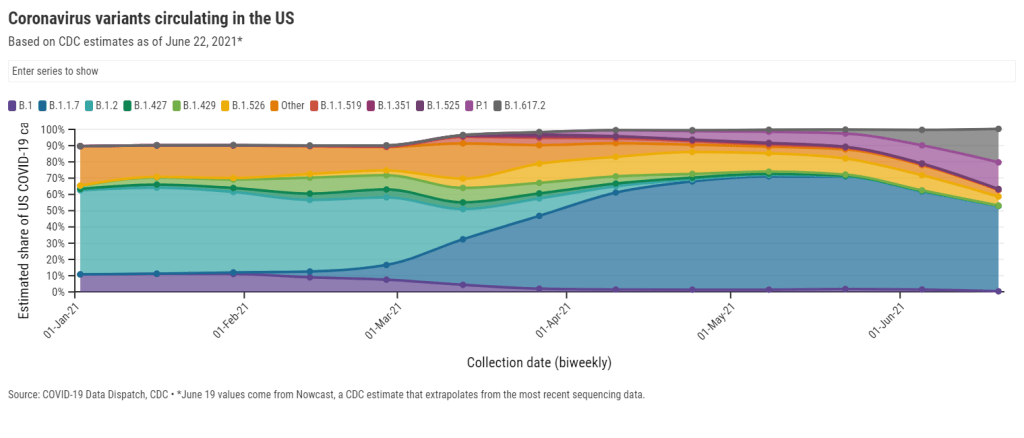
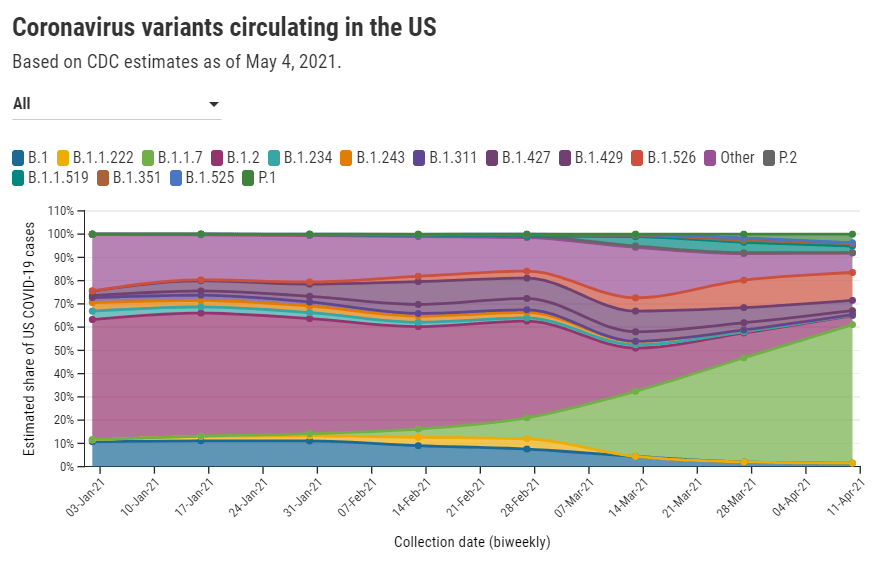
The U.S. is somewhat distinct from the U.K., though, because we had a more diverse group of variants circulating here before Delta hit. In the U.K., Delta arrived in a coronavirus pool that was 90% Alpha (B.1.1.7); here, the Alpha variant peaked at about 70%, with several other variants of concern also circulating.
In other words: we can’t forget about Gamma. Gamma, or P.1, was first identified in Brazil late in 2020. While it’s not quite as fast-spreading as Delta, it’s also highly transmissible and may be able to more easily re-infect those who have already recovered from a past coronavirus infection.
The Gamma variant now causes an estimated 16% of cases in the U.S. while the Delta variant causes 21%, per the CDC’s most recent data (as of June 19). Both are rapidly increasing as the Alpha variant declines, now causing an estimated 53% of cases.
A recent preprint from Helix researchers suggests an even starker change in the U.S.’s variant makeup. Helix’s analysis shows that Alpha dropped from 70% of cases in April 2020 to 42% of cases, within about six weeks.
Delta will certainly dominate the U.S. in a few weeks, but Gamma will likely be a top case-causer as well. Other variants that once worried me—like those that originated in New York and California—are getting solidly outcompeted.
The TL;DR here is, get vaccinated. Don’t wait. Tell everyone you know.
The Delta variant (also known as B.1.617.2) was first identified in India earlier this spring. It’s now known to spread more easily than any other variant found so far and evade immunity from a prior COVID-19 infection. Scientists are also investigating the variant’s potential to more easily cause severe disease—as well as links to a “black fungus” that has become a secondary epidemic in India.
Harvard epidemiologist William Hanage called the variant “really, really anxiety-inducing,” STAT’s Andrew Joseph reports. (If you’d like to read more on the biology of this variant, Joseph’s article provides a useful overview.)
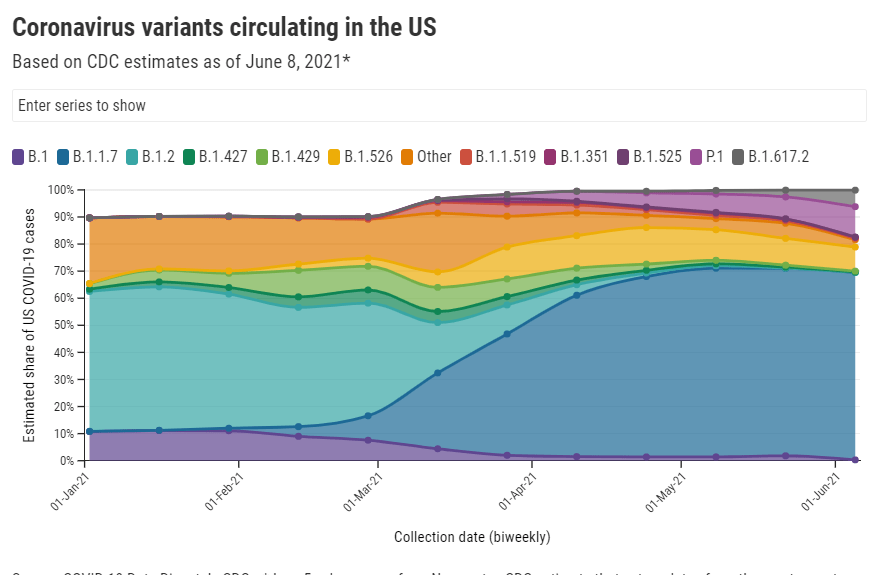
The Delta variant was first identified in the U.S. in April. It’s making up a small fraction of new cases at the moment, but is spreading rapidly: from an estimated 1.3% of cases on May 8, to 2.5% of cases on May 22, to 6.1% of cases on June 5. The June 5 estimate comes from CDC’s Nowcast predictions, which extrapolate from the most recent available sequencing data (typically reported with a lag of two weeks or more.)
The share of cases caused by this variant appears to be doubling every two weeks, which means that Delta could become the dominant variant here this summer. Some data suggest that domination could happen within a month—a dashboard run by the testing company Helix puts Delta at 10% of new cases as of May 31, suggesting an even faster transmission rate for the variant.
Helix scientist Alexandre Bolze wrote on Twitter that Delta could become dominant “next week or next 2 weeks” based on these trends.
Other variant trends also support Delta’s dominance. This variant, along with Gamma (or P.1, the variant first identified in Brazil), appears to be outcompeting other variants of concern in the U.S. Alpha (or B.1.1.7) has now plateaued at around 70% of U.S. cases, according to CDC data. The variants found in California and New York, both of which made up more than 10% of new cases earlier in the spring, are now declining.
While the CDC is not yet publishing data on Delta’s prevalence in individual states, we can assume that state-by-state variant trends—especially in those states where Delta cases were first identified—are reflecting the variant’s rise on a national level.
Many experts are now looking at Delta’s spread in the U.K. as a portent for its spread here. The variant has become dominant in the U.K., thoroughly outcompeting Alpha, and is driving a new surge—even though over half of the British population has received at least one vaccine dose. In fact, the U.K. has delayed its full reopening plans by a month due to this case resurgence.
The COVID-19 vaccines currently in use in both the U.K. and the U.S. do work well against Delta, especially the Pfizer and Moderna vaccines—and especially after a full two-dose regimen is complete. But anyone not yet vaccinated is highly vulnerable to this variant. In the U.K., the current case surge is driven by young adults and teenagers who aren’t yet eligible for vaccination.
As physician and public health expert Vin Gupta put it: “Being unvaccinated on June 9, 2021 is much more risky to your own wellbeing than being unvaccinated on June 9, 2020.” And the longer one waits, the riskier this condition becomes.
The Delta variant should serve both as an additional reason for those in wealthy nations who aren’t yet vaccinated to get their shots—and a reason for wealthy nations to share doses with the rest of the world.
B.1.1.7. B.1.351. P1. B.1.671.2. It’s exhausting trying to keep up with emerging SARS-CoV-2 variants with names as inscrutable as these.
But thankfully, we finally have a straightforward naming system: on May 31, the WHO announced a system using letters of the Greek alphabet. B.1.1.7 (first identified in the U.K. is now Alpha, B.1.351 (first identified in South Africa) is now Beta, and so on. You can find the complete list (so far) here. While there are an innumerable amount of SARS-CoV-2 variants, so far the WHO naming system only applies to “variants of concern” and “variants of interest.”
While there have been non-place-related names for these variants for a while, colloquially they have been called things like “the U.K. variant” and “the South African variant” because most people won’t just toss “B.1.1.7” around in conversation. (I tried, and no one knew what I was talking about.) However, this is problematic for a few reasons. First, we don’t know for sure that B.1.1.7. originated in the United Kingdom — that’s just where they found it first. And for other countries, naming a coronavirus variant after them associates a dangerous stigma with that country (like how nicknaming the coronavirus “the China virus” earlier in the pandemic contributed to a rise in anti-Asian hate). According to WHO coronavirus lead Maria Van Kerkhove in an interview with STAT News, a country will be more likely to report a variant if the name of the variant will not be associated with the country name.
The WHO naming system is nice for now, but it’s not clear if it’ll catch on and become the norm or if it’ll just be yet another naming system in a crowded patchwork. It’s also unclear what will happen if we run out of Greek letters, but we certainly hope it doesn’t come to that. (Making this yet another reason to vaccinate the world.)
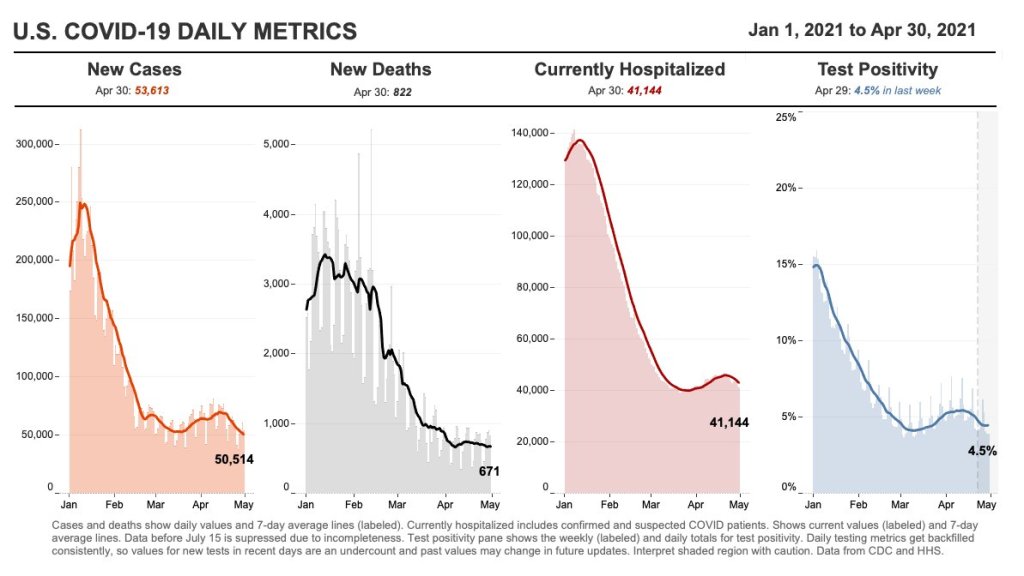
In the past week (May 22 through 28), the U.S. reported about 151,000 new cases, according to the CDC. This amounts to:
An average of 22,000 new cases each day
46 total new cases for every 100,000 Americans
22% fewer new cases than last week (May 15-21)
Last week, America also saw:
21,900 new COVID-19 patients admitted to hospitals (6.7 for every 100,000 people)
3,000 new COVID-19 deaths (0.9 for every 100,000 people)
70% of new cases in the country now B.1.1.7-caused (as of May 8)
An average of 1.4 million vaccinations per day (per Bloomberg)
Cases, deaths, and hospitalizations all continue to drop nationwide. The U.S. reported about 3,000 COVID-19 deaths last week, in total—at the peak of the winter surge, we saw more than 3,000 deaths a day.
This trend is echoed in most states. In the May 27 Community Profile Report, the HHS classifies almost every state as “orange” (between 50 and 100 new cases per 100,000 residents over the past week) or “yellow” (between 10 and 50 cases per 100,000). Wyoming is the only state in the “red” classification, at 101 cases per 100,000 over the past week—while California is in the green, with only 9 cases per 100,000.
In New York City, where I live, every single ZIP code currently has a test positivity rate at 3% or lower—for the first time since last summer. This is yet another piece of good news showing how well the vaccines work. Half of the total U.S. population has had at least one dose and more than half of the adult population is fully vaccinated, as of yesterday.
The vaccines also continue to do their part against variants. The CDC variant data—updated this week—indicate that B.1.1.7 is still growing, but it’s leveling off as new cases slow. This variant has gone from causing about 60% of cases in early April, to 67% in mid-April, to 70% in early May; a much slower decline than what we saw in February and March.
Of more concern: P.1, the variant first identified in Brazil, is causing 7% of U.S. cases as of May 8—and the CDC’s Nowcast estimate puts it at almost 10% of cases by May 22. B.1.617, the variant first identified in India, is also sharply increasing; its case share doubled from April 24 to May 8. Both of these variants are more transmissible (B.1.617 dangerously so) and may have lowered vaccine efficacy.
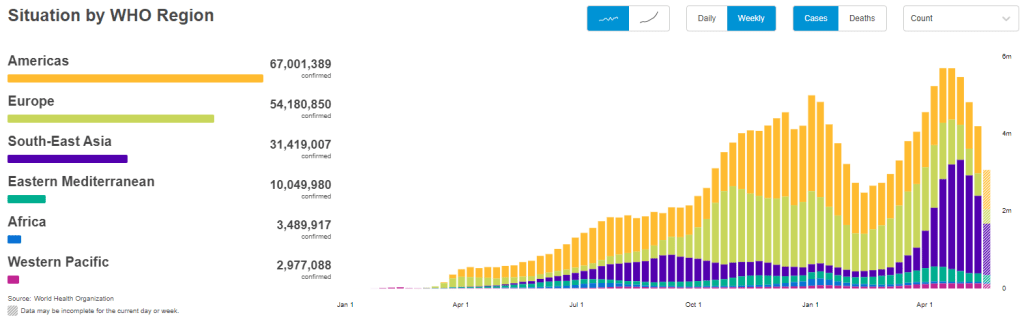
But the harm these variants can cause in the heavily-vaccinated U.S. pales in comparison to the risk they pose in other nations. As evidenced by the World Health Organization chart above, the share of cases in Southeast Asia and other lower-income nations is increasing even as cases in the U.S. and Europe drop. The U.S. should focus on providing aid to the nations where vaccinations are lagging so that we can help inoculate people before more, harder-to-contain variants evolve.
In other words, there’s a reason I’m not giving space to the lab leak theory in this publication. If you’d like to read more about the issue, I recommend this article by Amy Maxmen.
very fun and fresh how the "china deliberately released a bioweapon" narrative is "suddenly plausible" and "taking over global covid discourse" now when the US is hoarding vaccines and basically refusing to send supplies/money/etc to other nations :))))
— betsy ladyzhets 📊 (@betsyladyzhets) May 28, 2021
Two more important CDC data updates for this week:
Vaccine demographics, for the past 14 days and over time: This week, the CDC added a new category to its Vaccine Demographics page. Previously, the page allowed users to compare overall first dose and fully vaccinated rates for different race/ethnicity, age, and sex groups; now, you can also make those comparisons specifically for vaccinations in the last two weeks. For a time series view, check out the Vaccine Demographic Trends page, which shows vaccination rates over time—now available for race/ethnicity, sex, and age. The race/ethnicity view clearly shows that White and Asian Americans are getting vaccinated at higher rates than other groups.
Variant tracker “Nowcast”: Loyal CDD readers will already know that I love to drag the CDC for reporting their variant data with an enormous lag; often the most recent figures on the agency’s Variant Proportions page are a month old. Well, maybe somebody on their team is reading, because this week, the CDC added a new option to its variant dashboard that addresses this issue. Selecting “Nowcast On” (below the variant color bars) allows you to view prevalence estimates for the current week, in addition to the agency’s most recent week of data collection. A note below the dashboard explains that the “Nowcast” figures are based on modeling estimates that extrapolate from known proportions. For example, B.1.1.7 is known to cause 66% of U.S. cases as of April 24, but the “Nowcast” estimate puts it at 72% of cases as of May 8. This is actually pretty useful, thanks CDC!
It takes three to four weeks for data on a variant COVID-19 case to be made public. I have been quietly stressing out about this fact for about a month, since I learned it from Will Lee, VP of science at the genomics company Helix.
I talked to Lee for a recent Science News piece on the drivers and demographic patterns of the U.S.’s April rise in COVID-19 cases. During our conversation, he shared many details of Helix’s coronavirus sequencing process; most of this information was too technical for me to include in my Science News story, but in the COVID-19 Data Dispatch, I can get as technical as I want.
Here’s an excerpt from our interview, following my question: What is the turnaround time for sequencing? How does it compare to getting a PCR test result?
It is much, much slower. The median time from collection to [PCR] results, it’s varied quite a bit over time, but I think right now, for many labs, it’s less than 48 hours. And so what we do is, after the test result is done—we’re only picking from positive tests, obviously, for sequencing—so we would select the sample, probably somewhere on the order of two to three days after the sample is collected, after the test result is reported. From then, I’d say there’s probably seven to ten days before the sequencing result is available…
What happens is, we do the [PCR] test result, we send it out for sequencing. The turnaround time for sequencing—I’d say in a good case, it’s in the seven to eight day timeframe, sometimes it’s longer than that. There’s an additional holdback on the data before we make it publicly available, because the CDC wants to make sure that public health agencies have time to act on the information first, if it turns out [the case is] someone in their jurisdiction who’s identified to have a variant of concern. That’s potentially another week, depending on how fast they [the local public health agency] act.
And then there’s additionally a lag for when you submit to somewhere like GISAID, and however long it takes them to do their review process and publish it. You add it all together, and you end up with something like 3-4 weeks [from test sample collection to sequence publication].
So, let’s recap. Here’s what it takes to sequence and report a coronavirus variant case:
PCR test: 1-2 days
The testing company selects the positive test sample for sequencing: 1-2 days
Genomic sequencing takes place: 7-10 days
Local public health department gets notified, uses the sequencing results for contact tracing: Up to one week
Sequence is submitted to a public repository: Possibly another 1-2 weeks
When you add all this up, it’s no surprise that the most recent variant data on the CDC’s COVID Data Tracker are as of April 10, almost four weeks ago. I’m focusing on this process today because I believe the data lag is worth emphasizing. When you see a news report about B.1.1.7 or another variant, remember that the data took several weeks to get from test sample to newspaper.
In other words, when the CDC tells us that B.1.1.7 now makes up about 60% of new cases in the U.S., remember that this number is a snapshot from a month ago. The true number as of today, May 9, is likely far higher.
My interview with Will Lee inspired me to look at lag times for other common variant data sources. Let’s compare:
CDC’s Variant Proportions page,data from the national genomic surveillance program: Lag of 2-4 weeks, depending on how far away one is from an update when checking the page. (The CDC updates this page every two weeks.)
Helix’s Surveillance Dashboard, data from the company’s testing sites: Lag of 3-4 weeks. As of May 8, Helix is reporting B.1.1.7 sequence data as of April 15 and SGTF data as of late April. (SGTF, or S gene target failure, is a coronavirus mutation which usually indicates that a case is B.1.1.7-caused.)
Nextstrain dashboard, data from GISAID: Lag of 1-2 weeks. When I looked at Nextstrain’s coronavirus page yesterday, the most recent available sample sequences were collected on May 1 and the global variant frequencies chart ended at April 27.
CoVariants dashboard, data from Nextstrain/GISAID: Lag of 2-4 weeks, depending on the country. As of May 8, CoVariants reports data from the week of April 19 for some countries with more robust sequencing programs (U.S., U.K., etc.) and data from the week of April 5 for others.
Nextstrain and CoVariants, both of which are powered by the public sequence repository GISAID, have more recent data than the CDC—likely because academic labs can submit sequences to GISAID without waiting on public health departments. Helix has a lag similar to the CDC’s because its partnerships require the company to submit sequences to public health departments before releasing the information publicly. Some state public health departments report variant data of their own, but this is often done in press releases rather than regular dashboard updates.
Now, bearing in mind that the variant data are all weeks old, what are the most recent variant numbers for the U.S.? And why should we be worried about these variants?
Here’s a status check on the major variants I’m watching:
B.1.1.7 (first identified in the U.K.): Causing about 60% of cases nationwide as of April 10. Among the states where the CDC reports variant data, it’s most prevalent in Tennessee (74%), Michigan (71%), Minnesota (68%), Georgia (65%), and Florida (63%). This variant is concerning because it spreads a lot more easily than older coronavirus variants; estimates range from 40% to 70% more transmissible.
B.1.526 (first identified in New York City): Causing about 12% of cases nationwide as of April 10. This variant is also likely more transmissible, but a recent CDC report suggests that it does not lead to more severe disease or increased risk for vaccine breakthrough cases. B.1.526 has yet to be classified nationally as a variant of concern, so the CDC isn’t publishing state-by-state data for it. (But if you live in NYC, check out this Gothamist article for ZIP code-level prevalence data.)
B.1.427/B.1.429 (first identified in California): Causing about 6% of cases nationwide as of April 10. I suspect the pair may be getting outcompeted by B.1.1.7, as it was representing closer to 10% of cases in a previous CDC reporting period—it’s more transmissible than the wildtype coronavirus, but not as transmissible as B.1.1.7 . This variant pair is most prevalent in California (38%), Arizona (28%), and Colorado (24%).
P.1 (first identified in Brazil): Causing about 4% of cases nationwide as of April 10. This variant has been tied to surges in Brazil and other South American countries; it’s more transmissible, associated with a higher death rate, and can reinfect patients who already recovered from COVID-19. While it currently represents a fairly small share of U.S. cases, computational biologist Trevor Bedford recently pointed out that P.1. “has been undergoing more rapid logistic growth in frequency” compared to other variants.
B.1.351 (first identified in South Africa): Causing about 1% of cases nationwide as of April 10. Soon after it was identified last December, the COVID-19 vaccines were shown to be less effective against this variant. But “less effective,” for the mRNA vaccines, is still pretty damn effective, as this recent study from Qatar demonstrates.
B.1.617 (first identified in India): Not yet represented in CDC data, but it’s been identified in several U.S. states over the course of April and May. This variant is strongly tied to India’s recent surge. While you may see it called a “double variant” because it has mutations at two key coding sequences, B.1.617 doesn’t actually have double the transmission bump or double the severity of older coronavirus variants, as explained here by epidemiologist Katelyn Jetelina.
It’s also worth emphasizing that genomic sequencing is still not conducted evenly across the country. The CDC releases state-by-state variant prevalence data for states which have submitted more than 300 coronavirus sequences in a four-week period. As of April 10, only half of the states have met this benchmark; many states in the Midwest and South still aren’t represented in the CDC’s data.
I am considering adding a variant data annotations page to the CDD website, in order to more consistently keep track of all the different info sources on these lineages. Would you use this page? What information would you like to see there? Shoot me an email (betsy@coviddatadispatch.com) or leave a comment here on the website to let me know.
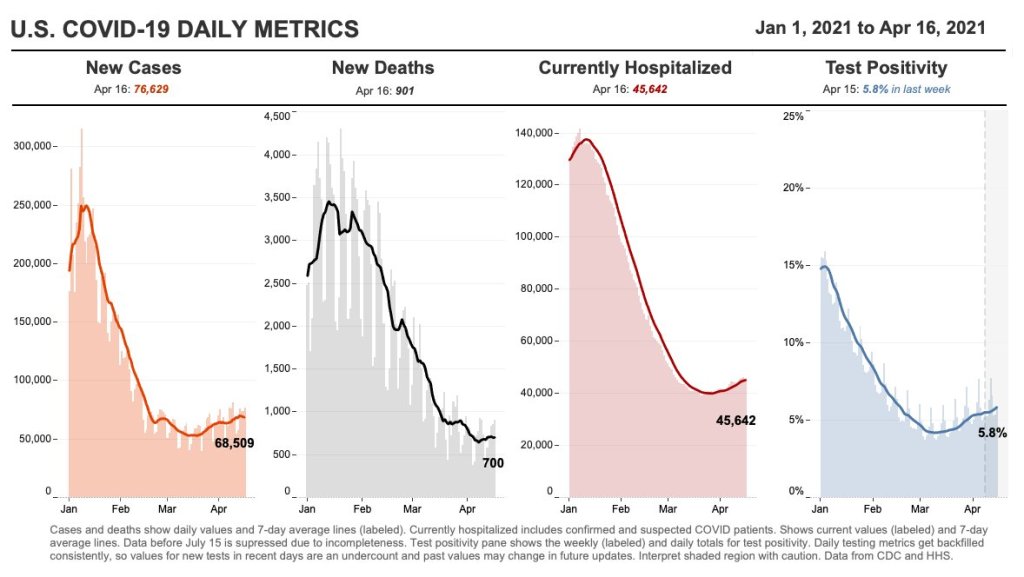
35,400 new COVID-19 patients admitted to hospitals (11 for every 100,000 people)
4,400 new COVID-19 deaths (1.3 for every 100,000 people)
59.2% of new cases in the country now B.1.1.7-caused (as of April 10)
An average of 2.55 million vaccinations per day (per Bloomberg)
New cases are down for the second week in a row—good news after the 70,000-plus peak of mid-April. Still, 50,000-plus cases in a day is no good place to plateau, new hospital admissions remain over 5,000 a day, and vaccinations are slowing: the U.S. is now averaging about 2.6 million shots a day, down from 3.4 million a couple of weeks ago.
As we discussed last week, the U.S. vaccination campaign has entered a phase in which supply is higher than demand. Even with Johnson & Johnson now back on the market, many of the people who were desperate to get their shots have already secured those doses, leaving public health experts and local leaders to figure out how to both lower access barriers and alleviate concerns in less vaccine-confident communities.
There is one good piece of vaccine news this week, though: several states are closing their vaccine equity gaps, according to Bloomberg’s tracker. White vaccination rates are slowing more drastically than rates in minority populations, allowing those communities to catch up. “Since early February, Alabama, Louisiana, Maryland, Mississippi and North Carolina have narrowed their Black vaccination gaps most,” Bloomberg’s team reports.
Meanwhile, the coronavirus variants just keep spreading. The CDC updated its variant proportions data this week, reporting that B.1.1.7 is now causing a clear majority of COVID-19 cases in the country (59%). Michigan, Minnesota, and Tennessee have B.1.1.7 proportions closer to 70%. B.1.1.7 also appears to be outcompeting the California variants (B.1.427/B.1.429) in parts of the West where those variants had previously dominated. Still, as we keep emphasizing, these data are several weeks old; this week’s CDC update includes figures as of April 10, and the true B.1.1.7 numbers are likely higher.
Stay safe out there, readers, and help your communities get vaccinated.
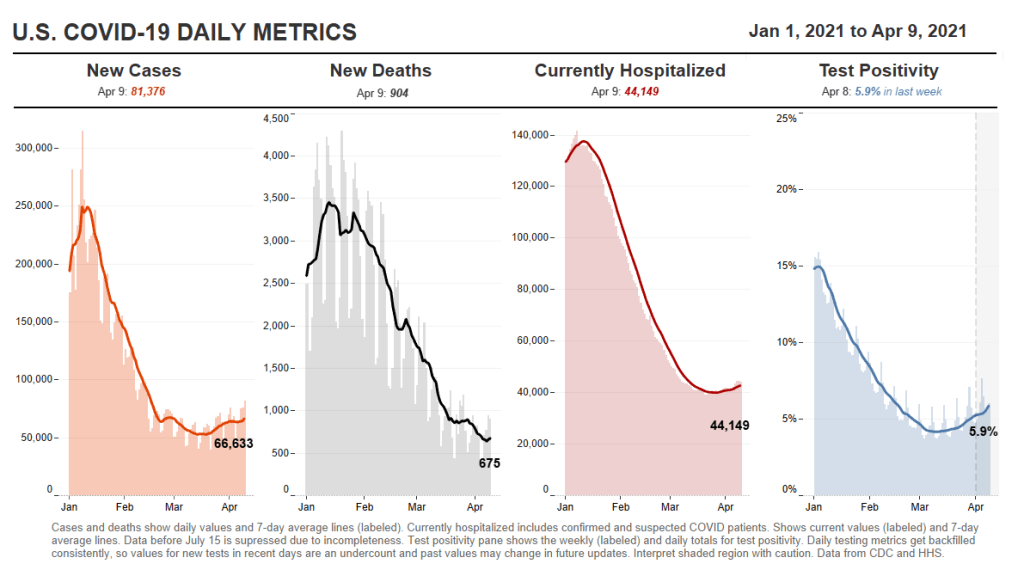
38,500 new COVID-19 patients admitted to hospitals (11.7 for every 100,000 people)
5,000 new COVID-19 deaths (1.5 for every 100,000 people)
44.1% of new cases in the country now B.1.1.7-caused (as of March 27)
An average of 3.2 million vaccinations per day (per Bloomberg)
I am really worried about Michigan. The state comprises a full 11% of new U.S. cases in the past week—and Michigan only makes up 3% of the national population. On any COVID-19 chart right now, Michigan sticks out like a sore thumb. Over 500 new cases per 100,000 people in a week, 4,200 new COVID-19 patients in a week, 15% positivity rate… none of the signs are good.
B.1.1.7 seems to have truly taken hold in Michigan. Combine that with a resistance to safety restrictions, and the state may serve as a warning of what other parts of the country may experience soon if we don’t keep up the pace on vaccinations. For more reporting on the state, I recommend Jonathan Cohn’s recent story in HuffPost.
B.1.1.7 has taken hold elsewhere, too. The variant is now causing at least 44% of the new cases in the country, as of the CDC’s most recent data (March 27). As that figure is now over two weeks old, the true prevalence is most likely much higher. Meanwhile, the NYC variant (B.1.526) and California variants (B.1.427/B.1.427) are each accounting for 10% of cases nationally, troubling figures on their own.
On the optimistic front, though, the daily average for vaccinations is now up at 3.2 million. The last few states that haven’t yet opened up eligibility to their entire adult populations will do so tomorrow, meeting President Biden’s deadline. We’ve also reached 200 million doses administered, ahead of Biden’s (revised) goal for his first 100 days in office.
Will these vaccinations be enough to break the tide of variant cases? I hope so. The vaccines at least appear to be protecting our most vulnerable neighbors so far, though; the death rate has remained below 1,000 per day despite several weeks of rising cases and hospitalizations.
37,400 new COVID-19 patients admitted to hospitals (11.4 for every 100,000 people)
5,000 new COVID-19 deaths (1.5 for every 100,000 people)
An average of 3.1 million vaccinations per day (per Bloomberg)
This is the fourth week in a row of case increases in the U.S. While this week’s jump is lower (we went from 57,000 new daily cases two weeks ago, to 63,000 last week, to 64,000 this week), the level where we’ve landed is still reason for concern. Our case numbers now are comparable to last July, when the summer surge was threatening hospital systems in the South and West.
Five states now account for almost half of our new cases, Dr. Katelyn Jetelina notes in her newsletter Your Local Epidemiologist. Those states are Michigan, New York, New Jersey, Florida, and Pennsylvania. “These states also happen to have some of the highest B.1.1.7 levels reported by the CDC,” Jetelina writes. “Is this a coincidence? Probably not.”
CDC data on coronavirus variants are reported with a significant time lag, as I discussed in detail last week. Still, the most recent update of the agency’s Variant Proportions page (now reflecting data as of March 13) tells us that B.1.1.7 accounts for at least 39% of cases in Michigan, 35% of cases in Tennessee, and 35% of cases in Florida. B.1.1.7 accounts for at least 20% of cases in five other states; it is now the most common variant in the country, CDC Director Dr. Rochelle Walensky said in a press briefing last week.
Vaccinations are of course continuing—more than one in three Americans has now had a shot, and one in five is fully vaccinated—but we can’t get complacent. This week’s seven-day average is barely above last week’s (both about 3 million), and as more states open up their eligibility to all adults, we’re seeing access issues and vaccine hesitancy prevent all shots from getting used.
Also, as Dr. Eric Topol pointed out on Twitter, the federal government is refusing to send surplus vaccine supply to Michigan despite pleas from Michigan leaders and public health experts to support this hotspot state in its time of crisis.
If the U.S. does see a fourth surge this spring, one of the main culprits will be variants. Three months after the first B.1.1.7-caused case was detected in this country, that variant now causes about one third of new COVID-19 cases nationwide. The B.1.1.7 variant, first detected in the U.K., spreads more readily and may pose a higher risk of hospitalization and death.
Meanwhile, other variants have taken root. There’s the variant that originated in California, B.1.427/B.1.429, which now accounts for over half of cases in the state. There’s the variant that originated in New York City, B.1.526, which is quickly spreading in New York and likely in neighboring states. And there’s the variant that originated in Brazil, P.1; this variant has only been identified about 200 times in the U.S. so far, but it’s wreaking havoc in Brazil and some worry that it may be only a matter of time before we see it spread here.
The thing about viral variants—especially those more-transmissible variants—is, they’re like tribbles. They might seem innocuous at first, but if left to multiply, they’ll soon take over your starship, eat all your food, and bury you in the hallway. (If you didn’t get that reference, watch this clip and then get back to me.) The only way to stop the spread is to first, identify where they are, and then use the same tried-and-true COVID-19 prevention measures to cut off their lineages. Or, as Dr. McCoy puts it: “We quit feeding them, they stop breeding.”
In the U.S., that first part—identify where the variants are—is tripping us up. The CDC has stepped up its sequencing efforts in a big way over the past few months, going from 3,000 a week in early January to 10,000 a week by the end of March. But data on the results of these efforts are scarce and uneven, with some states doing far more sequencing than others. New York City, for example, has numerous labs frantically “hunting down variants,” while many less-resourced states have sequenced less than half a percent of their cases. And the CDC itself publishes data with gaping holes and lags that make the numbers difficult to interpret.
The CDC has three places you can find data on variants and genomic sequencing; each one poses its own challenges.
First, there’s the original variant data tracker, “US COVID-19 Cases Caused by Variants.” This page reports sheer numbers of cases caused by three variants of concern: B.1.1.7 (U.K. variant), B.1.351 (South Africa variant), and P.1 (Brazil variant). It’s updated three times a week, on Tuesdays, Thursdays, and Sundays—the most frequent schedule of any CDC variant data.
But the sheer numbers of cases reported lack context. What does it mean to say, for example, the U.S. has about 12,500 B.1.1.7 cases, and 1,200 of them are in Michigan? It’s tricky to explain the significance of these numbers when we don’t know much sequencing Michigan is doing compared to other states.
This dataset is also missing some pretty concerning variants: both the B.1.526 (New York) and B.1.427/B.1.429 (California) variants are absent from the map and state-by-state table. According to other sources, these variants are spreading pretty rapidly in their respective parts of the country, so there should be case numbers reported to the CDC—it’s unclear why the CDC hasn’t yet made those numbers public.
(To the CDC’s credit, the California variant was recently reclassified as a “variant of concern,” and Dr. Walensky said at a press briefing this week that the New York variant is under serious investigation to get that same reclassification bump. But that seems to be a long process, as it hasn’t happened weeks after the variant emerged.)
Second, there’s the variant proportions tracker, which reports what it sounds like: percentages, representing the share of COVID-19 cases that CDC researchers estimate are caused by different coronavirus variants. The page includes both national estimates and state-by-state estimates for a pretty limited number of states that have submitted enough sequences to pass the CDC’s threshold.
I wrote about this page when it was posted two weeks ago, calling out the stale nature of these data and the lack of geographic diversity. There’s been one update since then, but only to the national variant proportions estimates; those numbers are now as of March 13 instead of February 27. The state numbers are still as of February 27, now over a month old.
Note that Michigan—the one state everyone’s watching, the state that has reported over 1,000 B.1.1.7 cases alone—is not included in the table. How are we supposed to use these estimates when they so clearly do not reflect the current state of the pandemic?
!function(){“use strict”;window.addEventListener(“message”,(function(a){if(void 0!==a.data[“datawrapper-height”])for(var e in a.data[“datawrapper-height”]){var t=document.getElementById(“datawrapper-chart-“+e)||document.querySelector(“iframe[src*=’”+e+”‘]”);t&&(t.style.height=a.data[“datawrapper-height”][e]+”px”)}}))}();
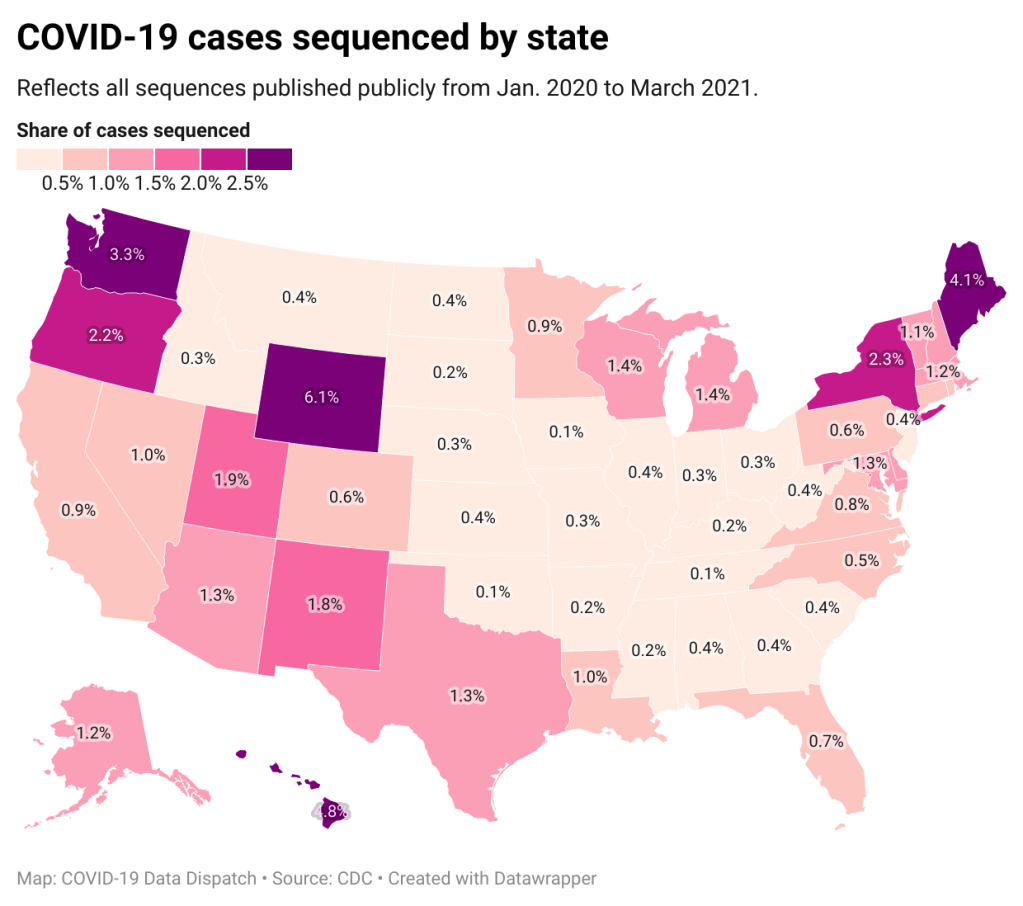
A third variant-adjacent data page, added to the overall CDC COVID Data Tracker this past week, provides a bit more context. This page provides data on published SARS-CoV-2 sequences provided by the CDC, state and local public health departments, and other laboratory partners. You can see the sheer number of sequenced cases grow by week and compare state efforts.
It’s pretty clear that some states are doing more sequencing than others. States with major scientific capacity—Washington, Oregon, New York, D.C.—are near the top. Some states with smaller populations are also on top of the sequencing game: Wyoming, Hawaii, Maine. But 32 states have sequenced fewer than 1% of their cases in total, and 21 have sequenced fewer than 0.5%. That’s definitely not enough sequences for the states to be able to find pockets of new variants, isolate those transmission chains, and stop the breeding.
!function(){“use strict”;window.addEventListener(“message”,(function(a){if(void 0!==a.data[“datawrapper-height”])for(var e in a.data[“datawrapper-height”]){var t=document.getElementById(“datawrapper-chart-“+e)||document.querySelector(“iframe[src*=’”+e+”‘]”);t&&(t.style.height=a.data[“datawrapper-height”][e]+”px”)}}))}();
Chart captions state that the state-by-state maps represent cases sequenced “from January 2020 to the present,” while a note at the bottom says, “Numbers will be updated every Sunday by 7 PM.” So are the charts up to date as of today, April 4, or are they up to date as of last Sunday, March 28? (Note, I put simply “March 2021” on my own chart with these data.)
Obviously, the lack of date clarity is annoying. But it’s also problematic that these are cumulative numbers—reflecting all the cases sequenced during more than a year of the pandemic. Imagine trying to make analytical conclusions about COVID-19 spread based on cumulative case numbers! It would simply be irresponsible. But for sequencing, these data are all we have.
So, if anyone from the CDC is reading this, here’s my wishlist for variant data:
One singular page, with all the relevant data. You have a COVID Data Tracker, why not simply make a “Variants” section and embed everything there?
Regular updates, coordinated between the different metrics. One month is way too much of a lag for state-by-state prevalence estimates.
Weekly numbers for states. Let us see how variants are spreading state-by-state, as well as how states are ramping up their sequencing efforts.
More clear, consistent labeling. Explain that the sheer case numbers are undercounts, explain where the prevalence estimates come from, and generally make these pages more readable for users who aren’t computational biologists.
And if you’d like to see more variant case numbers, here are a couple of other sources I like:
Coronavirus Variant Tracker by Axios, providing estimated prevalence for four variants of concern and two variants of interest, along with a varants FAQ and other contextual writing.
Nextstrain, an open-source genome data project. This repository was tracking pathogens long before COVID-19 hit, and it is a hub for sequence data and other related resources.
The U.S. has blown past its current sequencing goal (7,000 cases per week), but is aiming to ramp up to 25,000—and has invested accordingly. I hope that, in addition to ramping up all the technology and internal communications needed for this effort, the CDC also improves its public data. The virus is multiplying; there’s no time to waste.