Tag: April data

  • National numbers, April 30

    National numbers, April 30

    The number of COVID-19 tests reported to the CDC has declined precipitously since peak COVID-19 surges, even though COVID-19 spread has not. Chart from the CDC.

    In the past week (April 20 through 26), the U.S. officially reported about 88,000 new COVID-19 cases, according to the CDC. This amounts to:

    • An average of 13,000 new cases each day
    • 10% fewer new cases than last week (April 13-19)

    In the past week, the U.S. also reported about 11,000 new COVID-19 patients admitted to hospitals. This amounts to:

    • An average of 1,500 new admissions each day
    • 3.2 total admissions for every 100,000 Americans
    • 16% fewer new admissions than last week

    Additionally, the U.S. reported:

    • 1,100 new COVID-19 deaths (150 per day)
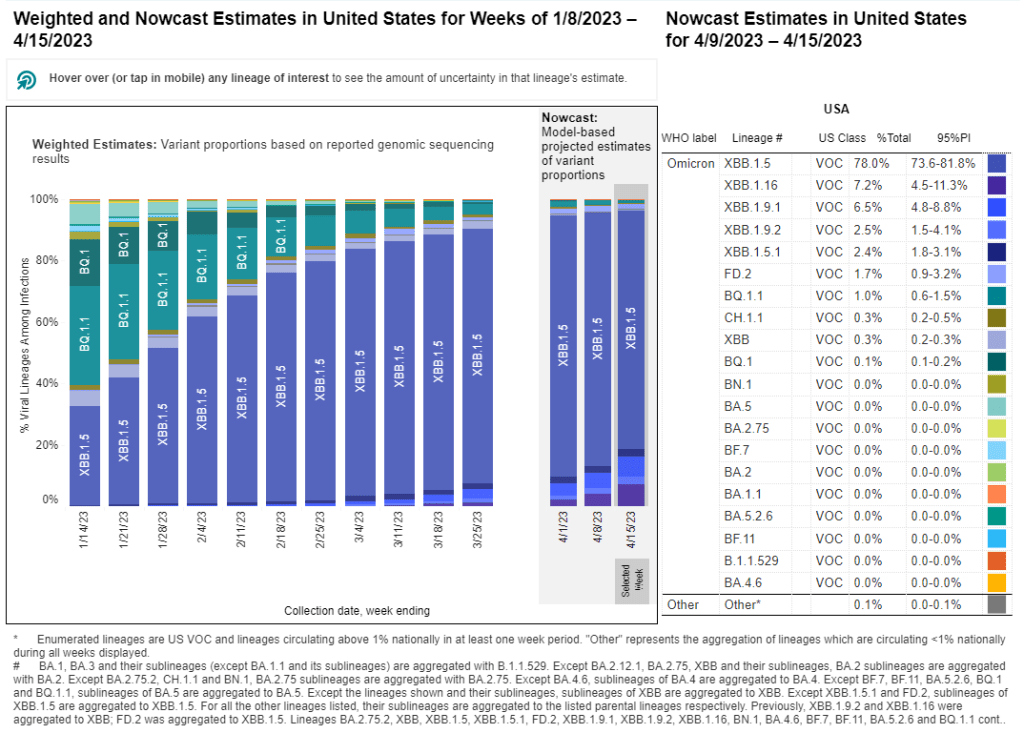
    • 69% of new cases are caused by Omicron XBB.1.5; 13% by XBB.1.9; 12% by XBB.1.16 (as of April 29)
    • An average of 40,000 vaccinations per day

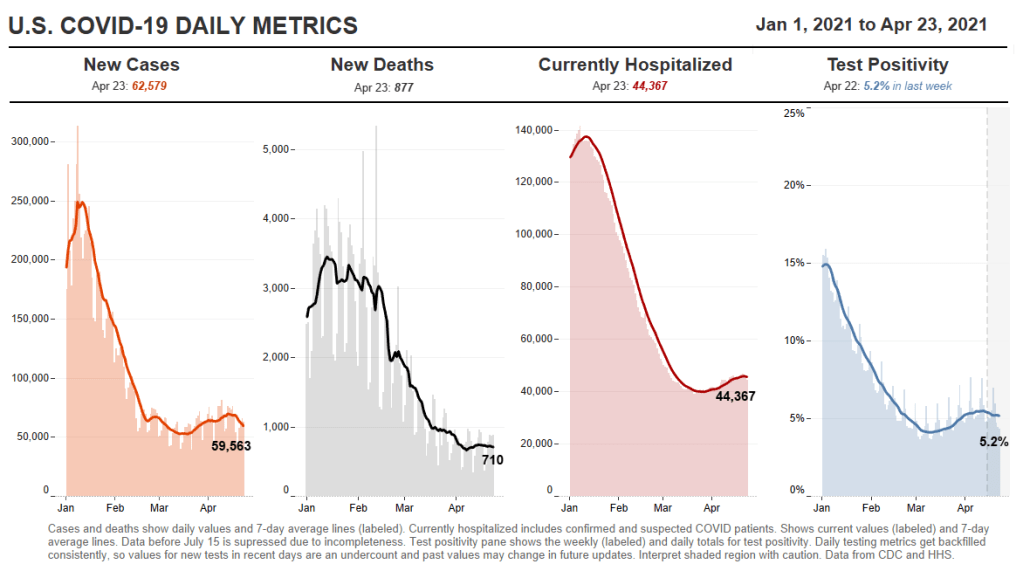
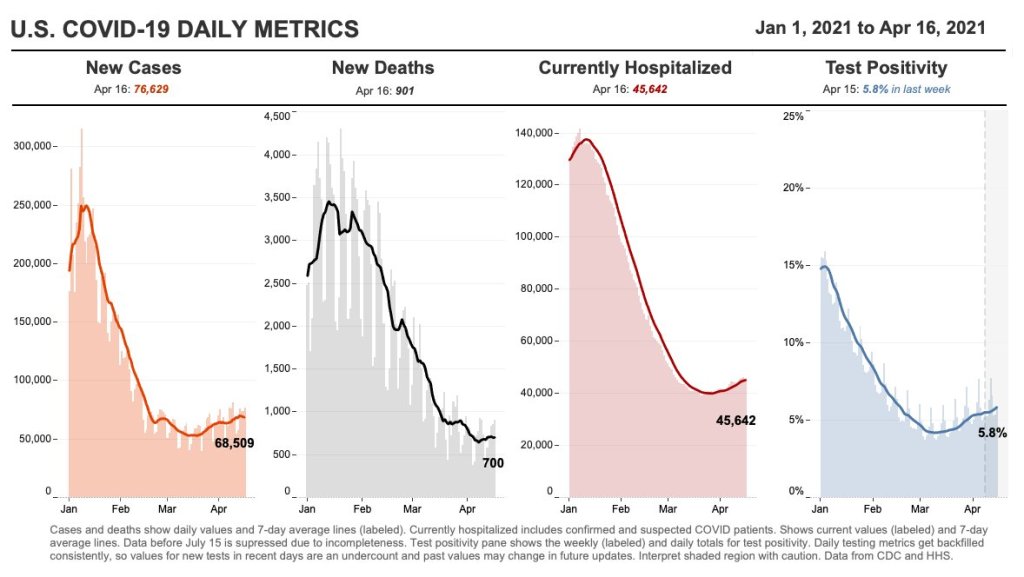
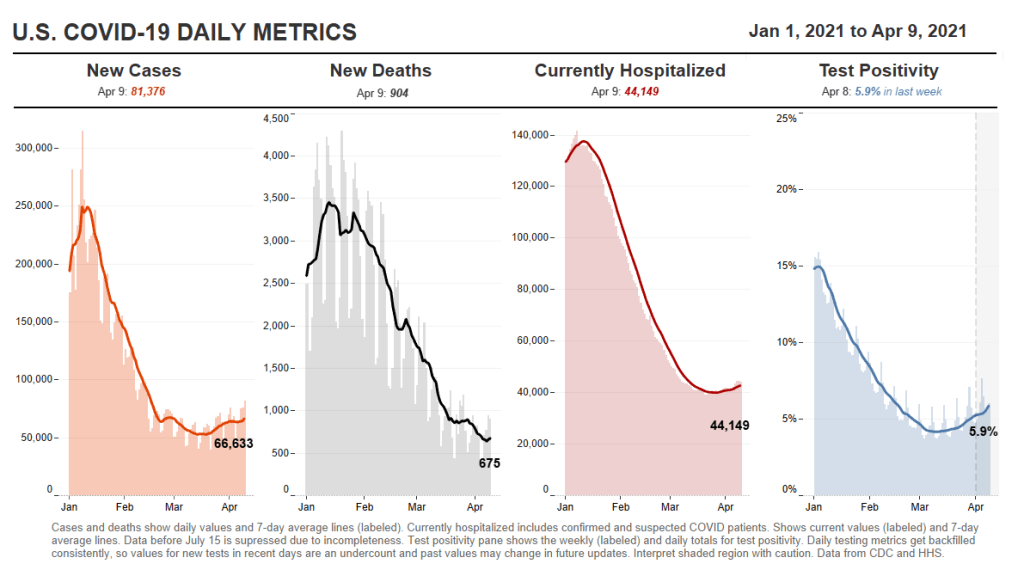
    Major COVID-19 metrics continue to suggest an ongoing (though slight) decline in the virus’ spread nationally, despite the rise of newer and more contagious variants. The moderate plateau persists.

    Officially-reported cases and new hospital admissions declined by 10% and 16% respectively last week, compared to the week prior. According to the CDC’s data notes, three states (Florida, Iowa, and Pennsylvania) did not report cases last week, while two states (Louisiana and Indiana) reported extra cases from their historical backlogs.

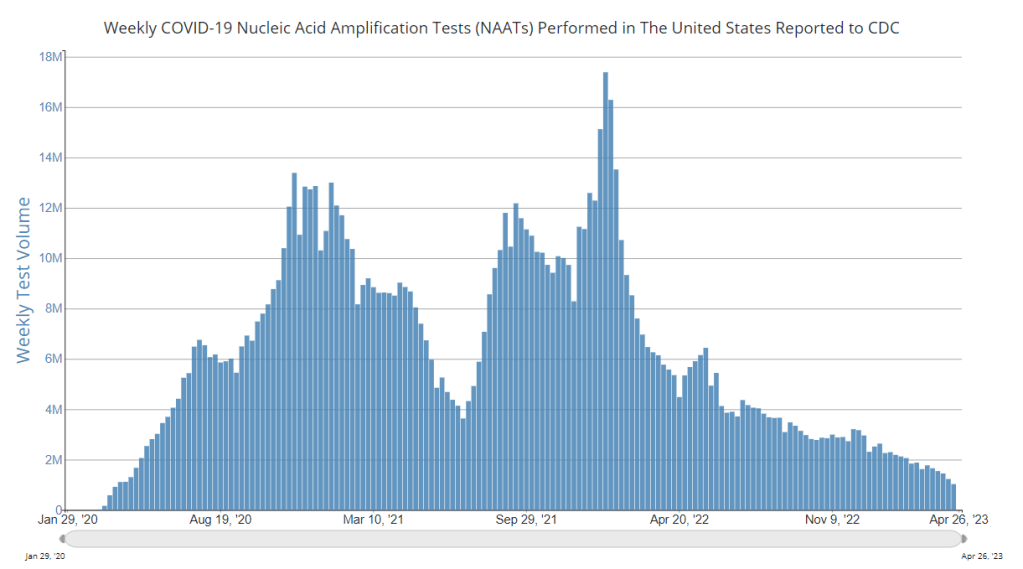
    In addition to the ongoing reporting issues from state health departments, it’s important to remember that PCR testing continues to decline across the country. About one million PCR and similar lab test results were reported to the CDC last week, compared to peaks over 10 million per week during major surges.

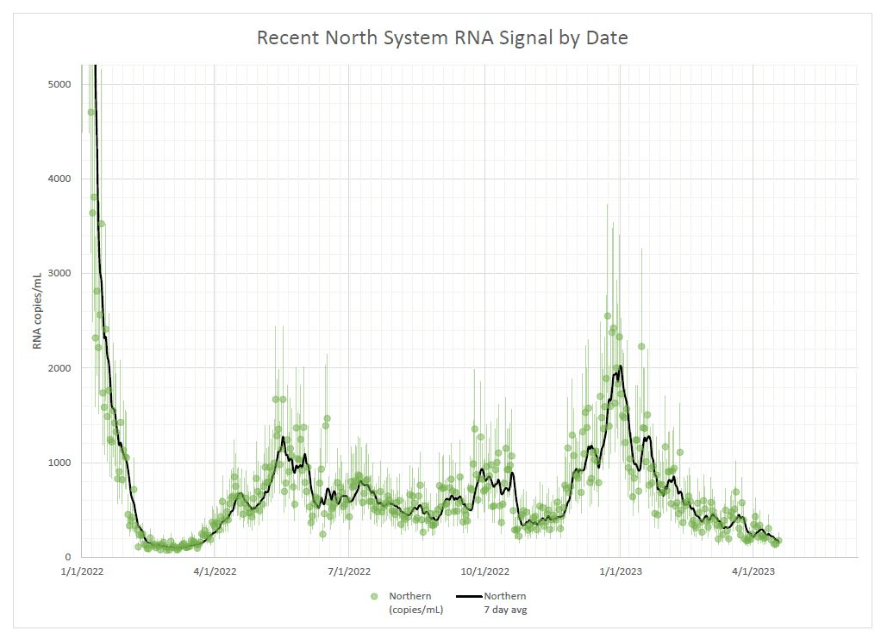
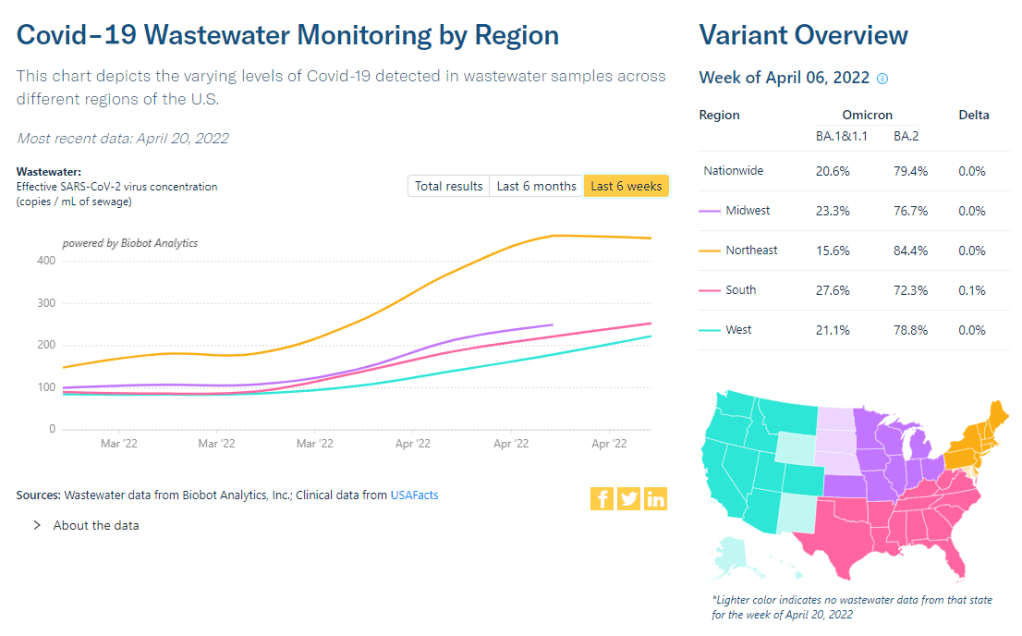
    Still, the hospitalization numbers and wastewater surveillance data lead me to suggest that we really are in a transmission plateau. Wastewater data from Biobot show a slight decline in national coronavirus concentrations over the last month.

    All four regions of the country are also experiencing COVID-19 plateaus, according to Biobot’s data. The West Coast and Midwest have slightly higher coronavirus levels than the Northeast and South, but there aren’t huge differences between the regions.

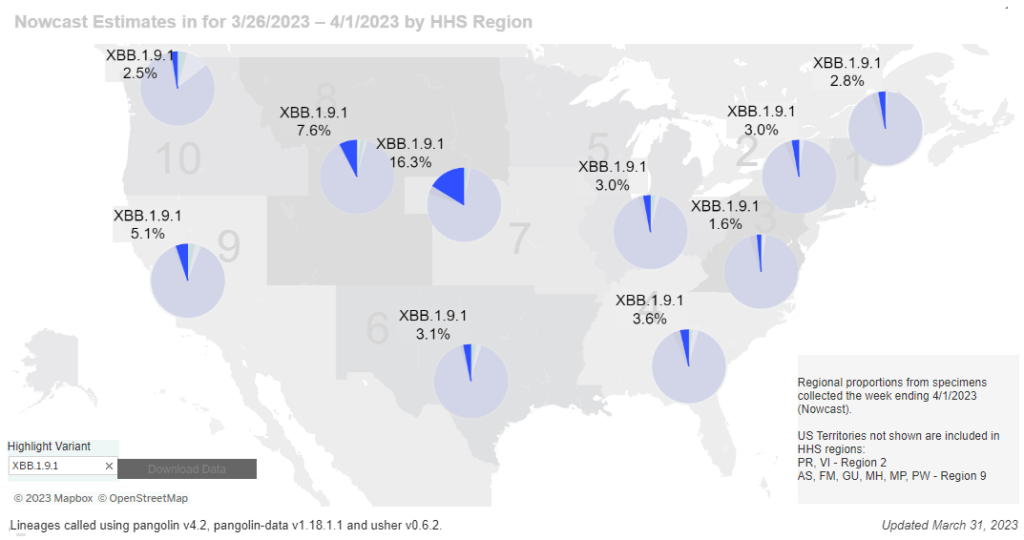
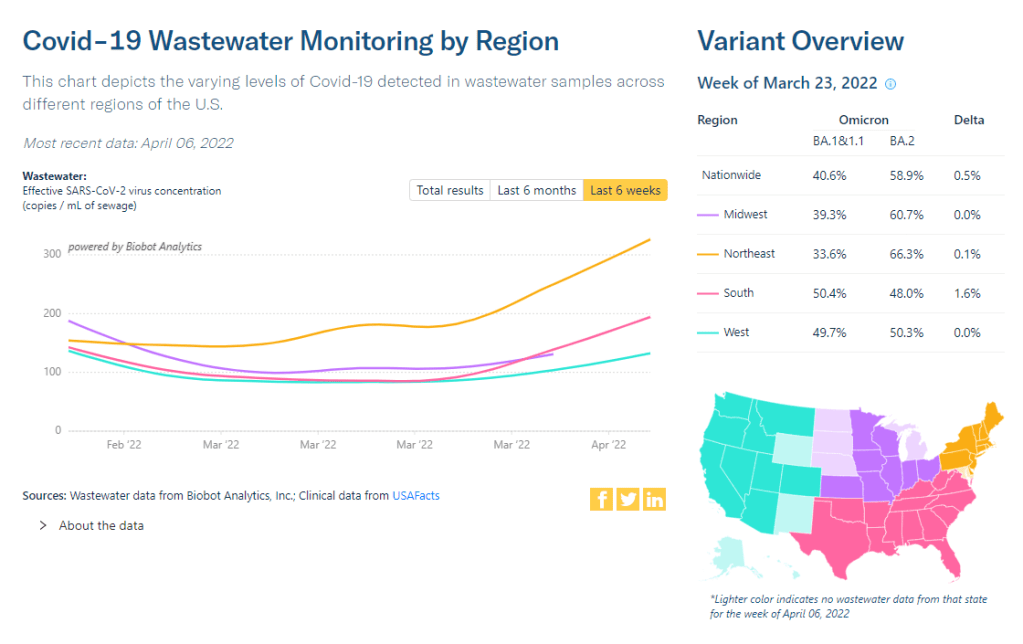
    The West and Midwest are also hotspots for XBB.1.16 and XBB.1.9, the two Omicron subvariants that have started competing with XBB.1.5 over the last few weeks. This competition is happening slowly; XBB.1.5 declined from an estimated 84% of new cases during the last week of March to 69% of new cases this past week, according to the CDC’s estimates.

    At this point, it’s hard to tell how much of an impact the latest variants will have on overall COVID-19 spread. And these connections likely will only get more difficult to parse out, as PCR testing continues to decline and reporting gets less reliable. The CDC itself is currently evaluating how to adjust its data-sharing practices when the federal public health emergency ends on May 11.

  • National numbers, April 23

    National numbers, April 23

    Coronavirus concentrations are trending down in Boston’s wastewater, a promising signal.

    In the past week (April 13 through 19), the U.S. officially reported about 94,000 new COVID-19 cases, according to the CDC. This amounts to:

    • An average of 13,000 new cases each day
    • 7% fewer new cases than last week (April 6-12)

    In the past week, the U.S. also reported about 12,000 new COVID-19 patients admitted to hospitals. This amounts to:

    • An average of 1,700 new admissions each day
    • 3.7 total admissions for every 100,000 Americans
    • 8% fewer new admissions than last week

    Additionally, the U.S. reported:

    • 1,200 new COVID-19 deaths (170 per day)
    • 74% of new cases are caused by Omicron XBB.1.5; 11% by XBB.1.9; 10% by XBB.1.16 (as of April 22)
    • An average of 35,000 vaccinations per day

    Across the U.S., COVID-19 spread continues at a moderately high plateau as newer versions of Omicron compete with XBB.1.5. Officially-reported cases and new hospitalizations declined by 7% and 8% respectively, compared to the prior week.

    Wastewater surveillance data from Biobot and from the CDC similarly show that COVID-19 spread is at a plateau. Nationally, coronavirus concentrations in sewage are higher than they were at this point in 2021 (when the initial vaccine rollout was in full swing), but lower than at this point in 2022 (when BA.2 had started spreading widely).

    Of course, it’s important to flag that official case counts are becoming even more unreliable these days, as PCR testing becomes increasingly difficult to access and state health departments no longer prioritize timely reporting to the CDC. According to CDC, five states didn’t report COVID-19 cases and deaths last week: Arkansas, Florida, Iowa, Mississippi, and Pennsylvania. (Iowa has permanently stopped reporting.)

    These case reporting issues are likely to continue—and perhaps accelerate—when the federal public health emergency ends next month. I’m thinking about how to adjust these National Numbers reports when that happens; that will likely involve foregrounding wastewater data and hospitalizations rather than cases.

    Regionally, Biobot’s surveillance shows a slight uptick in coronavirus spread on the West Coast and declines in the other major regions. Some counties in California have reported recent increases in wastewater, according to Biobot and WastewaterSCAN, but it’s currently tough to tell if this is a sustained surge or isolated outbreaks.

    The West Coast and Midwest continue to be hotspots for newer versions of Omicron, according to the CDC’s estimates, with XBB.1.9 still most prevalent by far in the region including Iowa, Kansas, Missouri, and Nebraska. Nationwide, the CDC estimates that XBB.1.9 caused about 11% of new cases in the last week and that XBB.1.16 caused 10% of new cases.

    XBB.1.16 (also called “Arcturus”) was recently classified as a variant of interest by the World Health Organization because it can spread significantly faster than other Omicron lineages. The variant is likely to “spread globally and contribute to an increase in case incidence,” according to the WHO.

    While I’m wary of the new variants, I have been heartened to see coronavirus levels in wastewater remain mostly at plateaus—or even decline—in many places across the U.S. In Boston, for example, coronavirus levels have been on a downward trend since early 2023. I hope to see this trend continue. 

  • National numbers, April 16

    National numbers, April 16

    New subvariants XBB.1.16, XBB.1.9.1, and XBB.1.9.2 are on the rise, according to the CDC’s estimates.

    In the past week (April 6 through 12), the U.S. officially reported about 100,000 new COVID-19 cases, according to the CDC. This amounts to:

    • An average of 15,000 new cases each day
    • 17% fewer new cases than last week (March 30-April 5)

    In the past week, the U.S. also reported about 13,000 new COVID-19 patients admitted to hospitals. This amounts to:

    • An average of 1,900 new admissions each day
    • 3.9 total admissions for every 100,000 Americans
    • 14% fewer new admissions than last week

    Additionally, the U.S. reported:

    • 1,300 new COVID-19 deaths (190 per day)
    • 78% of new cases are caused by Omicron XBB.1.5; 9% by XBB.1.9; 7% by XBB.1.16 (as of April 15)
    • An average of 35,000 vaccinations per day (CDC link)

    COVID-19 spread appears to be at a continued plateau nationally, with slight declines in cases, hospitalizations, and viral concentrations in wastewater. New variants are on the horizon, though, at a time when data are becoming increasingly less reliable. 

    The CDC reported about 100,000 new cases this week, the lowest this number has been since early summer 2021. Unlike that period, however, PCR tests are much less available and reporting infrastructures are being dismantled.

    Wastewater surveillance data from Biobot show that transmission is actually several times higher now than it was at that previous low point. We’re in an undercounted plateau, rather than a real lull. Even so, less COVID-19 is spreading now than we’ve seen throughout the last few months.

    To get a more accurate picture of potential COVID-19 case counts in your area, I recommend going to the Iowa COVID-19 Tracker, an independent dashboard run by Sara Anne Willette. Willette has mapped out “likely cases per 100,000 people” by county, by multiplying the CDC’s data by 20 to account for underreporting.

    Wastewater data suggest that most parts of the U.S. are seeing steady (though slight) declines in transmission, with the exception of the West coast. Some counties in California have reported increased coronavirus levels in wastewater in the last week, according to Biobot and WastewaterSCAN, including parts of the Bay Area.

    One culprit for the increases could be newer Omicron subvariants, particularly XBB.1.9 and XBB.1.16. The CDC added XBB.1.16—which has drawn international concern, due to its connection with a recent surge in India—to its variant proportion estimates, along with XBB.1.9.2, a relative of XBB.1.9.1. (Yes, we’re getting into alphabet soup territory again here.)

    Nationally, the CDC estimates that XBB.1.16 caused about 7% of new cases in the last week, while the XBB.1.9s together caused 9%. At the regional level, XBB.1.16 is more prevalent in the West and Southwest (at over 20% of new cases in the region including Texas and other Gulf coast states), while the XBB.1.9s are more prevalent in the Midwest.

    The CDC published its second-to-last data update yesterday (which is still called the “Weekly Review,” even though it is far from weekly at this point). According to this update, most of the CDC’s public COVID-19 data “won’t be affected by the end of the public health emergency,” though the agency says it’ll provide more details in its final update on May 12.

    I personally expect that, while the national data systems might remain in place, more state and local health agencies will stop reporting, as we saw from Iowa recently. This will, of course, make the numbers less and less reliable.

  • National numbers, April 2

    National numbers, April 2

    New subvariant Omicron XBB.1.9.1 is most prevalent in the Midwest, according to CDC estimates.

    In the past week (March 23 through 29), the U.S. officially reported about 140,000 new COVID-19 cases, according to the CDC. This amounts to:

    • An average of 20,000 new cases each day
    • 43 total new cases for every 100,000 Americans
    • 9% fewer new cases than last week (March 16-22)

    In the past week, the U.S. also reported about 17,000 new COVID-19 patients admitted to hospitals. This amounts to:

    • An average of 2,400 new admissions each day
    • 5.1 total admissions for every 100,000 Americans
    • 5% fewer new admissions than last week

    Additionally, the U.S. reported:

    • 1,600 new COVID-19 deaths (230 per day)
    • 88% of new cases are caused by Omicron XBB.1.5; 5% by XBB.1.9.1; 2% by XBB.1.5.1; 0.4% by CH.1.1 (as of March 18)
    • An average of 40,000 vaccinations per day

    While official COVID-19 cases and hospitalizations continue to trend ever-so-slightly downward, wastewater surveillance data show potential new upticks in transmission. Despite continued minimal safety measures in most places, we have to remain wary of a potential spring surge.

    Official data from the CDC suggested that cases and new hospital admissions dropped very slightly last week, compared to the week prior. But case data continue to be plagued with reporting delays; again this week, multiple states (Florida, Delaware, Mississippi, Oklahoma) reported no cases or had other issues. These delays make it difficult to assess patterns at state or county levels.

    Wastewater surveillance data provide more accurate early warnings about potential rising transmission. This week, Biobot’s data suggest slight increases in all four major regions of the country. It’s worth noting, though, that Biobot’s most recent data are preliminary. I’ll be closely watching the dashboard’s next updates, this coming Tuesday and Thursday.

    The latest Omicron variant of concern, XBB.1.9.1, could be one reason for increasing coronavirus levels. This subvariant caused an estimated 5% of new cases across the country nationwide last week, according to the CDC’s Nowcast analysis. At the same time, XBB.1.5 has declined for the first time since it emerged a couple of months ago, suggesting XBB.1.9.1 might slowly outcompete it.

    XBB.1.9.1 is most prevalent in the Midwest, particularly the region including Iowa, Kansas, Missouri, and Nebraska. Some counties in this region are also reporting significant coronavirus increases in their wastewater, according to Biobot and WastewaterSCAN. Missouri’s wastewater dashboard similarly shows increases across the state.

    In our current era of high background coronavirus spread (and few-to-no widespread safety measures), a new variant can easily cause concerning outbreaks. It’s important to remember that, no matter how much the virus evolves, simple measures like masks and ventilation can still make transmission less likely.

  • National numbers, April 24

    National numbers, April 24

    Coronavirus levels in wastewater may be plateauing in the Northeast, while the remaining regions of the country catch up. Chart via Biobot, retrieved on April 24.

    In the past week (April 16 through 22), the U.S. reported about 300,000 new COVID-19 cases, according to the CDC. This amounts to:

    • An average of 43,000 new cases each day
    • 91 total new cases for every 100,000 Americans
    • 35% more new cases than last week (April 9-15)

    In the past week, the U.S. also reported about 11,000 new COVID-19 patients admitted to hospitals. This amounts to:

    • An average of 1,600 new admissions each day
    • 3.4 total admissions for every 100,000 Americans
    • 8% more new admissions than last week

    Additionally, the U.S. reported:

    • 2,600 new COVID-19 deaths (0.8 for every 100,000 people)
    • 93% of new cases are Omicron BA.2-caused; 19% BA.2.12.1-caused (as of April 16)
    • An average of 100,000 vaccinations per day (per Bloomberg)

    After weeks of me warning about it, a BA.2 surge is upon us. Nationwide, new COVID-19 cases have gone up for the third week in a row; we’ve seen a 68% increase since the last week of March.

    And that’s just the reported cases: Americans may be doing about four times more at-home tests than they’re doing lab-based PCR tests, according to Mara Aspinall, a COVID-19 testing expert (who cowrites a testing-focused newsletter). The vast majority of these at-home tests are never reported to public health officials and don’t make it into our trends analysis.

    But there are other metrics that similarly indicate a national rise in coronavirus transmission. Viral levels in wastewater are going up, according to both Biobot’s tracker and the CDC’s national monitoring system; the CDC’s COVID-19 data team noted in this Friday’s Weekly Review that “more than half of all sites reporting wastewater data are experiencing a modest increase in SARS-CoV-2 levels.” Some of these increases are going from very low to still low, but they’re still worth watching.

    The U.S. is also reporting an increase in new COVID-19 patients admitted to hospitals: about 11,000 people this week, up from 10,000 last week. New hospitalizations lag behind cases slightly, but they are a more reliable metric, as anyone with symptoms severe enough to require hospitalization generally will seek care (so, underreporting is less of a concern.)

    At the regional level, the Northeast is still seeing the highest case rates: leading jurisdictions include Vermont, Washington D.C., New York, Rhode Island, and Massachusetts, according to the April 21 Community Profile Report. The Northeast—particularly New York and New Jersey—is also a hotspot for the Omicron sub-subvariant, BA.2.12.1.

    As I wrote last week, the New York State Department of Health recently identified new mutations of BA.2; BA.2.12.1 in particular seems to be even more transmissible than that BA.2 (which is, in itself, more transmissible than the original Omicron variant, BA.1). The CDC has added this sublineage to its variant tracking page, and estimates that BA.2.12.1 caused about one in five new COVID-19 cases nationwide in the week ending April 16.

    To borrow an analogy from my sister (an engineering student): the emergence of these new Omicron sublineages feels like when you’re trying to do a problem set that claims to have five problems, but then each problem has several sub-problems, and those sub-problems themselves have more sub-problems. In the coming weeks, we’ll see just how much more transmissible Omicron can get.

    There’s some good news, though: cases in some parts of the Northeast might be plateauing. It’s hard to tell for sure because of the aforementioned unreliable data, but wastewater data for the region (as well as for individual cities like Boston) seem to be leveling off; we’ll see next week if this trend continues.

  • National numbers, April 17

    National numbers, April 17

    Cases are increasing, especially in the Northeast. Note all of the empty spaces (representing data gaps). Maps via the April 14 Community Profile Report.

    In the past week (April 9 through 15), the U.S. reported about 220,000 new COVID-19 cases, according to the CDC. This amounts to:

    • An average of 31,000 new cases each day
    • 67 total new cases for every 100,000 Americans
    • 19% more new cases than last week (April 2-8)

    In the past week, the U.S. also reported about 10,000 new COVID-19 patients admitted to hospitals. This amounts to:

    • An average of 1,400 new admissions each day
    • 3.1 total admissions for every 100,000 Americans
    • 1% more new admissions than last week

    Additionally, the U.S. reported:

    • 2,900 new COVID-19 deaths (0.9 for every 100,000 people)
    • 100% of new cases are Omicron-caused; 86% BA.2-caused (as of April 9)
    • An average of 100,000 vaccinations per day (per Bloomberg)

    New COVID-19 cases in the U.S. have gone up for the second week in a row, and the increase was sharper this week. While the daily average of new cases (about 31,000) remains low compared to the Omicron surge, this trend is still concerning—especially when factoring in all the at-home rapid tests that are going unreported right now.

    Wastewater trends suggest that cases will continue rising in the coming weeks. Biobot’s dashboard suggests a national increase (most pronounced in the Northeast region), while about 60% of sites in the CDC’s network have reported increasing coronavirus levels in the last two weeks.

    Newly hospitalized COVID-19 patients, an indicator that’s typically behind cases but more reliable, is also showing a small increase as of this week. This will be an important metric to watch in the next few weeks: will BA.2 strain hospitals the same way that Omicron BA.1 did in December and January?

    BA.2, it’s important to note, is now causing the vast majority of new COVID-19 cases in the U.S. The CDC’s latest estimates suggested that this sublineage made up 86% of cases in the week ending April 9. And some parts of the country may be seeing further mutation of BA.2—more on that later in the issue.

    The Northeast continues to be a leader in this surge, as shown by both the wastewater trends and case data. According to the April 14 Community Profile Report, states with the highest case rates in the last week include: Vermont, Washington D.C., Rhode Island, New York, Massachusetts, Alaska, New Jersey, Maine, Connecticut, and New Hampshire.

    All of these states are seeing high transmission, according to the CDC’s old guidance. But the new guidance places most counties in these states in low or medium “community levels;” largely because hospitalizations—which, again, are a lagging indicator—haven’t started rising yet.

    This week, Philadelphia became the first major U.S. city to once again require masks in public indoor spaces, in response to rising cases and hospitalizations. I hope to see other cities and localities follow Philadelphia’s lead, but I know current attitudes make this unlikely.

  • National numbers, April 10

    National numbers, April 10

    Coronavirus levels in wastewater are now rising in all regions of the country, according to Biobot. Screenshot taken on April 9.

    In the past week (April 2 through 8), the U.S. reported about 190,000 new COVID-19 cases, according to the CDC. This amounts to:

    • An average of 27,000 new cases each day
    • 57 total new cases for every 100,000 Americans
    • 5% more new cases than last week (March 26-April 1)

    In the past week, the U.S. also reported about 10,000 new COVID-19 patients admitted to hospitals. This amounts to:

    • An average of 1,400 new admissions each day
    • 3.0 total admissions for every 100,000 Americans
    • 10% fewer new admissions than last week

    Additionally, the U.S. reported:

    • 3,500 new COVID-19 deaths (1.1 for every 100,000 people)
    • 100% of new cases are Omicron-caused; 72% BA.2-caused (as of April 2)
    • An average of 100,000 vaccinations per day (per Bloomberg)

    After several weeks in a plateau, new COVID-19 cases in the U.S. are once again going up at the national level. The CDC reported an average of 27,000 new cases a day last week—less than one-tenth of what we saw during the Omicron surge, but still a notable uptick from the week prior.

    National numbers of newly hospitalized patients and COVID-19 deaths are both still trending down; this is unsurprising, as trends in hospitalizations and deaths typically follow cases by several weeks.

    Wastewater, a leading indicator, is showing pronounced increases both nationally and in all four major regions of the country, according to Biobot’s tracker. Similarly, more than half of the wastewater monitoring sites in the CDC’s network have shown increases in coronavirus levels over the last two weeks.

    That wastewater signal likely means that cases will keep going up in the next couple of weeks. BA.2 is a clear culprit for this: the more-contagious Omicron sublineage is now causing about three in four new COVID-19 cases in the U.S., according to the CDC’s latest estimates. BA.2’s dominance led the FDA to pull its emergency use authorization for Sotrovimab, a monoclonal antibody drug that works against Omicron BA.1—but not against BA.2,

    As we’ve seen for the last couple of weeks, the Northeast continues to be a leader in case increases. Jurisdictions with the highest cases per capita in the week ending April 6 are Alaska, Vermont, Rhode Island, Washington, D.C., New York, Massachusetts, New Jersey, and Maine. All reported more than 100 new cases for every 100,000 residents, per the latest Community Profile report.

    Under the CDC’s old community level guidance, all of these Northeast states (and Alaska) would be classified as seeing high transmission. But under the new, more lenient guidance, 99% of the country—including most counties in these states—are classified as “low” or “medium” community levels.

    These lenient levels don’t account for warnings in our wastewater, not to mention under-testing as PCR sites close and at-home tests go unreported. As Katherine Wu wrote in The Atlantic this week, the U.S. may be facing a new surge, but it’s harder to accurately track COVID-19 now than it has been since spring 2020. Don’t let the low numbers fool you into thinking all is well.

  • National numbers, April 25

    National numbers, April 25

    In the past week (April 17 through 23), the U.S. reported about 438,000 new cases, according to the CDC. This amounts to:

    • An average of 63,000 new cases each day
    • 133 total new cases for every 100,000 Americans
    • 1 in 749 Americans getting diagnosed with COVID-19 in the past week
    • 10% fewer new cases than last week (April 10-16)
    Nationwide COVID-19 metrics as of April 16, sourcing data from the CDC and HHS. Posted on Twitter by Conor Kelly.

    Last week, America also saw:

    • 39,400 new COVID-19 patients admitted to hospitals (12 for every 100,000 people)
    • 4,800 new COVID-19 deaths (1.5 for every 100,000 people)
    • 44.7% of new cases in the country now B.1.1.7-caused (as of March 27)
    • An average of 2.9 million vaccinations per day (per Bloomberg)

    After several weeks of rising cases, the federal numbers dropped this week by about 10%. Michigan’s case rates fell below 500 new cases per 100,000 people and its positivity rate is trending downward, leading public health experts to hope that this state’s worrying outbreak may have peaked.

    As always, though, we can’t get too excited about a single-week trend—and 60,000 new cases each day is still a concerning level at which to plateau. Over 5,000 Americans are being admitted to hospitals with COVID-19 each day, and more of these patients are now younger as this age group is the last to become eligible for vaccination. COVID-19 is becoming more of a “young person’s disease,” as Sarah Zhang wrote in The Atlantic last week.

    Variants are still a concern, too—but I have no updates on variant numbers because the CDC has not updated its Variant Proportions data since our last issue. According to revised figures (still as of March 27), B.1.1.7 is causing about 45% of cases in the U.S., and the California (B.1.427/B.1.429) and New York City (B.1.526) variants are causing about 10% of cases each. Good news on the NYC variant, though: recent studies have suggested that the Pfizer and Moderna vaccines will effectively protect New Yorkers against this variant, per the New York Times.

    While the U.S. met President Biden’s 200 million dose goal last week, the pace of vaccinations is now slowing. We’re seeing about 2.9 million doses administered each day, compared to over 3 million a week ago. While this may be due in part to the Johnson & Johnson pause (more on that later), a bigger culprit is likely that vaccine supply is starting to eclipse demand. In other words, everyone who was desperate to get vaccinated has now gotten their shot, leaving those who are less confident or may have a harder time accessing an appointment. A new Kaiser Family Foundation report suggests that the U.S. is now vaccinating people in the “wait and see” group, and likely will have reached everyone in that group within a couple more weeks.

    It’s heartening to see case numbers drop, but we aren’t out of the woods yet. It will take coordinated communication and lifting of access barriers to reach a “vaccinated summer” here in the U.S… to say nothing of the rest of the world.

  • National numbers, April 18

    National numbers, April 18

    In the past week (April 10 through 16), the U.S. reported about 487,000 new cases, according to the CDC. This amounts to:

    • An average of 70,000 new cases each day
    • 148 total new cases for every 100,000 Americans
    • 1 in 674 Americans getting diagnosed with COVID-19 in the past week
    • 8.5% more new cases than last week (April 3-9)
    Nationwide COVID-19 metrics as of April 16, sourcing data from the CDC and HHS. Posted on Twitter by Conor Kelly.

    Last week, America also saw:

    • 38,500 new COVID-19 patients admitted to hospitals (11.7 for every 100,000 people)
    • 5,000 new COVID-19 deaths (1.5 for every 100,000 people)
    • 44.1% of new cases in the country now B.1.1.7-caused (as of March 27)
    • An average of 3.2 million vaccinations per day (per Bloomberg)

    I am really worried about Michigan. The state comprises a full 11% of new U.S. cases in the past week—and Michigan only makes up 3% of the national population. On any COVID-19 chart right now, Michigan sticks out like a sore thumb. Over 500 new cases per 100,000 people in a week, 4,200 new COVID-19 patients in a week, 15% positivity rate… none of the signs are good.

    B.1.1.7 seems to have truly taken hold in Michigan. Combine that with a resistance to safety restrictions, and the state may serve as a warning of what other parts of the country may experience soon if we don’t keep up the pace on vaccinations. For more reporting on the state, I recommend Jonathan Cohn’s recent story in HuffPost.

    B.1.1.7 has taken hold elsewhere, too. The variant is now causing at least 44% of the new cases in the country, as of the CDC’s most recent data (March 27). As that figure is now over two weeks old, the true prevalence is most likely much higher. Meanwhile, the NYC variant (B.1.526) and California variants (B.1.427/B.1.427) are each accounting for 10% of cases nationally, troubling figures on their own.

    On the optimistic front, though, the daily average for vaccinations is now up at 3.2 million. The last few states that haven’t yet opened up eligibility to their entire adult populations will do so tomorrow, meeting President Biden’s deadline. We’ve also reached 200 million doses administered, ahead of Biden’s (revised) goal for his first 100 days in office.

    Will these vaccinations be enough to break the tide of variant cases? I hope so. The vaccines at least appear to be protecting our most vulnerable neighbors so far, though; the death rate has remained below 1,000 per day despite several weeks of rising cases and hospitalizations.

  • National numbers, April 11

    National numbers, April 11

    In the past week (April 3 through 9), the U.S. reported about 449,000 new cases, according to the CDC. This amounts to:

    • An average of 64,000 new cases each day
    • 137 total new cases for every 100,000 Americans
    • 1 in 731 Americans getting diagnosed with COVID-19 in the past week
    • 2% more new cases than last week (March 27-April 2)
    Nationwide COVID-19 metrics as of April 9, sourcing data from the CDC and HHS. Posted on Twitter by Conor Kelly.

    Last week, America also saw:

    • 37,400 new COVID-19 patients admitted to hospitals (11.4 for every 100,000 people)
    • 5,000 new COVID-19 deaths (1.5 for every 100,000 people)
    • An average of 3.1 million vaccinations per day (per Bloomberg)

    This is the fourth week in a row of case increases in the U.S. While this week’s jump is lower (we went from 57,000 new daily cases two weeks ago, to 63,000 last week, to 64,000 this week), the level where we’ve landed is still reason for concern. Our case numbers now are comparable to last July, when the summer surge was threatening hospital systems in the South and West.

    Five states now account for almost half of our new cases, Dr. Katelyn Jetelina notes in her newsletter Your Local Epidemiologist. Those states are Michigan, New York, New Jersey, Florida, and Pennsylvania. “These states also happen to have some of the highest B.1.1.7 levels reported by the CDC,” Jetelina writes. “Is this a coincidence? Probably not.”

    CDC data on coronavirus variants are reported with a significant time lag, as I discussed in detail last week. Still, the most recent update of the agency’s Variant Proportions page (now reflecting data as of March 13) tells us that B.1.1.7 accounts for at least 39% of cases in Michigan, 35% of cases in Tennessee, and 35% of cases in Florida. B.1.1.7 accounts for at least 20% of cases in five other states; it is now the most common variant in the country, CDC Director Dr. Rochelle Walensky said in a press briefing last week.

    Vaccinations are of course continuing—more than one in three Americans has now had a shot, and one in five is fully vaccinated—but we can’t get complacent. This week’s seven-day average is barely above last week’s (both about 3 million), and as more states open up their eligibility to all adults, we’re seeing access issues and vaccine hesitancy prevent all shots from getting used.

    Also, as Dr. Eric Topol pointed out on Twitter, the federal government is refusing to send surplus vaccine supply to Michigan despite pleas from Michigan leaders and public health experts to support this hotspot state in its time of crisis.

    Readers, if you have the opportunity to get vaccinated—or you can help a friend or family member get vaccinated—please do so.