- AHCJ resource on COVID-19 vaccine results: The Association for Health Care Journalists has added a section to its Medical Studies repository for studies on how well COVID-19 vaccines protect against infection. Tara Haelle, AHCJ’s medical core topic leader, compiled the studies; “The list is not necessarily exhaustive, but it includes the studies I was able to track down so far,” she writes in a blog post about this update.
- Colleges requiring COVID-19 vaccinations (Chronicle): A growing number of colleges and universities are aiming to protect their students, professors, and staff by requiring COVID-19 vaccinations for those coming to campus next fall. The Chronicle of Higher Education has identified 190 such institutions as of April 30, and is continually updating its list. (Note: You need to sign up with a free account to view the page.)
- Post-COVID Care Centers: Post-COVID Care Centers, or PCCCs, are clinics where long COVID patients can receive treatment. They’re staffed by a growing group of multidisciplinary doctors and medical researchers seeking to understand this prolonged condition. The long COVID advocacy network Survivor Corps has compiled this database of PCCCs by state; 17 out of 50 states don’t yet have any such centers. (H/t Chelsea Cirruzzo, who has a great Twitter thread covering the recent House Energy & Commerce health committee hearing on long COVID.)
- Excess deaths in the U.S. (Kieran Healy): Kieran Healy, sociology professor at Duke University, recently updated his chart gallery on excess deaths in the U.S. during 2020, using CDC data. All states saw significantly higher death rates in 2020 compared to 2015-2019 (except for North Carolina, which has incomplete data due to reporting delays). New York City has the highest death rate by far at over 30%.
Blog
-
Featured sources, May 2
-
State K-12 school data still leave much to be desired
The academic year is coming to an end for most schools pretty soon (I’ve been off for about a week, but I’m a college student), so we thought it’d be appropriate to check in on the state of state K-12 COVID-19 data. We’ve been keeping track of the metrics reported by states throughout the fall and spring, and you can find our annotations of those sources here.
We had a few metrics that we looked for in a school tracker (if one exists for a state at all, which we’ll get to.) These include cases, hospitalizations, deaths, tests, test positivity rate, and in-person enrollment. We also wanted to know if trackers were separating student cases from staff cases. While we didn’t expect every state tracker to account for all of these, a robust tracker should include at least a few.
Turns out, no state trackers reported all of our wished-for metrics. Most trackers—37 of them—just reported cases and called it good, and 24 of them separated cases by students and staff. There are too many states in this vein to list them all, but a few include Alabama, Indiana, Idaho, the Dakotas, South Carolina, and Oregon (which is my home state so I’m a bit more disappointed.)
But when we narrow it down to slightly more granular metrics like hospitalizations, the number of trackers that report them drop significantly. Only five states reported deaths: Colorado, Illinois, Kansas, North Carolina, and Virginia. Three reported hospitalizations: Illinois, Kansas, and Georgia. Two reported tests: Georgia and New York. (One caveat for Georgia: they’re not actually reporting cases in schools, they’re reporting cases in school-aged children.)
To assess how robust a particular state’s tracker was, we assigned it an index number based on how many metrics it reported. (The methodology for doing so can be found here.) Essentially, a higher number indicates a more robust tracker. With this methodology, the top five states were New York (19), Kentucky (14), Texas (14), New Hampshire (14) and South Carolina (13). The bottom three were Utah, Arizona, and Kansas (all 7.) The average was between 8 and 9, with a median of 9.
However, so far we’ve been talking about states with school trackers at all. 11 states do not track school cases (at the very least, we couldn’t find their school tracker). I’ll actually list these out: Alaska, Arkansas, California, Iowa, Nebraska, Nevada, New Mexico, Oklahoma, Pennsylvania, Utah, and Wyoming.
In pointing this out, I’m not trying to shame the public health authorities in these states who are working very hard to get this pandemic under control. I’m trying to get the point across that statewide school data is still very fractured and very incomplete. And while we wait for a complete federal tracker, state data is really all we have. COVID-19 is still going to be a threat in schools as long as people under 16 can’t get vaccinated; we should at least know how much of a threat it’s turned out to be.
Related posts
- COVID-19 school data remain sporadicOn November 18, New York City mayor Bill de Blasio announced that the city’s schools would close until further notice. The NYC schools discrepancy is indicative of an American education system that is still not collecting adequate data on how COVID-19 is impacting classrooms—much less using these data in a consistent manner.
- COVID-19 school data remain sporadic
-

HHS makes it easier to compare hospitalizations by age
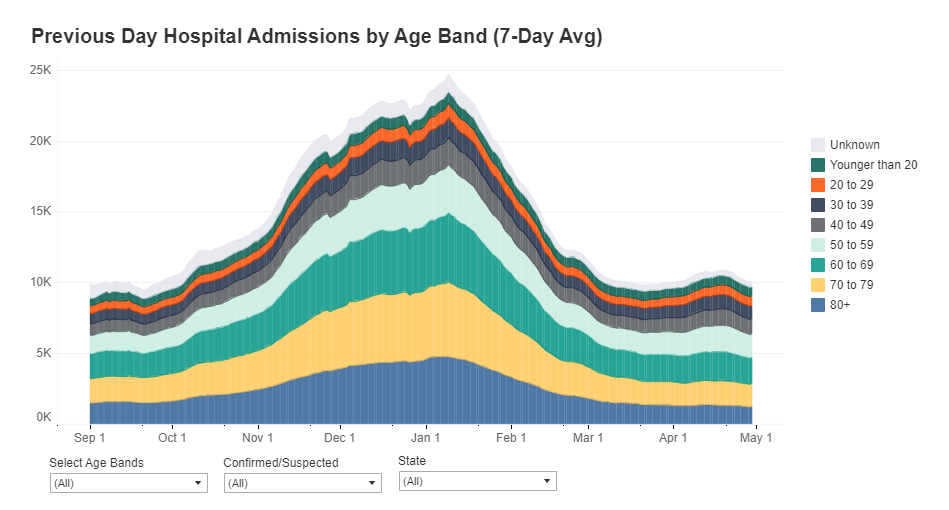
Since mid-December, the Department of Health and Human Services has published a dataset on how the pandemic is impacting individual hospitals across the country. (You can read the CDD’s detailed description of that dataset here.) One of the most useful—and, in my opinion, most under-utilized—aspects of this facility dataset is that it provides COVID-19 hospital admissions broken out by age, allowing data users to discern which age groups are getting hardest hit by severe COVID-19 cases in different parts of the country.
This week, the HHS made it much easier to do that analysis. The agency added hospital admissions by age to its state-level hospitalization dataset. Now, if you want to see a patient breakdown for your state, you can simply look at the state-level info already compiled by HHS data experts, rather than summing up numbers from the facility-level info yourself.
Besides that convenience factor, there are two big advantages of the state-level info:
- The state-level dataset is updated daily, while the facility-level dataset is updated weekly. More frequent data updates allow for more specific time series analysis.
- Low patient numbers aren’t suppressed. In the facility-level dataset, patient numbers between 1 and 4 are suppressed with an error value (-999999) to protect patient privacy. In the age data, this happens at a lot of facilities, so it’s impossible for an outside data user to calculate accurate totals for a given city, county, or state. On the other hand, with HHS experts doing the aggregation in the state-level dataset, no values need to be obscured—basically, these state-level figures are much more accurate.
The age groups in the state-level dataset match those available in the facility-level dataset: pediatric COVID-19 patients, patients age 18-19, patients in ten-year age ranges from 20 to 79, and patients age 80 or older. HHS also splits the patient counts into those who have confirmed COVID-19 cases (meaning their diagnosis is verified by a PCR test) and those who have suspected cases (meaning the patients have COVID-19 symptoms or a positive result on a non-PCR test.)
You can find these new data in two places:
- COVID-19 Reported Patient Impact and Hospital Capacity by State (daily updates), which includes data for the most recent day only.
- COVID-19 Reported Patient Impact and Hospital Capacity by State Timeseries, which includes a full state-by-state time series going back to July 2020.
Also, Conor Kelly, COVID Tracking Project volunteer and COVID-19 visualizer extraordinaire, has added these new data to his COVID-19 Tableau dashboard. (See “Hosp. Admissions Over Time,” then “Admissions by Age.”) Highly recommend checking out that dashboard and exploring the trends for your state.
(Finally, it is possible I’m a little annoyed that the HHS made this lovely update immediately after I turned in an assignment in which I did this analysis the long way, with the facility-level dataset. Look out for that story early next week.)
Related posts
-

In India’s COVID-19 catastrophe, figures are only part of the story
By Payal Dhar
India’s COVID-19 curve resembles a vertical line right now. An already fragile health infrastructure is on its knees, the government has shown itself to be incapable. There are no hospital beds to be had, no medicines, no oxygen, no emergency care; even the dead have to endure 20-hour queues for last rites. A nine-day streak of 300,000-plus new cases daily has ended with fresh infections crossing the 400,000 mark on May 1. More than 3,000 COVID-related deaths have been recorded daily for three consecutive days. Still, the worst, experts say, is yet to come.
If one compares India’s cumulative figures with the U.S.’s, however, the numbers don’t seem to make sense. India’s 18.8 million confirmed cases, with 208,330 deaths, don’t seem anywhere near U.S. figures of 31.9 million and 568,836 respectively. India appears to record 1,360 cases and 15 deaths per 100,000 people, versus 9,684 cases and 172 deaths per 100,000 people in the U.S. Even accounting for the fact that India’s population (1.4 billion) is more than four times that of the U.S. (330 million), the scale of the devastation seen on the ground—patients three to a bed or being treated on the streets, people dying outside hospitals waiting for treatment, entire families being wiped out, and mass cremations taking place on pavements and car parks—appears disproportionate.
The reasons are complicated and intersecting. For one, the official figures are highly likely to be vastly underestimated in India. Moreover, the country’s health infrastructure has always been fragile. There are only 5.3 beds per 10,000 population (versus 28.7 for the U.S.), and given the sheer numbers of COVID-19 infections, it’s simply a case of just-not-enough. Other reasons for the low numbers in India could, quite simply, be a lack of testing—only 1.74 daily tests per 1,000 people—as well as a purposeful obfuscation of actual figures.
Experts say that COVID-19 deaths have been undercounted across the world for various reasons; testing methodologies and the recording of confirmed cases has not been uniform. “Every country reports those figures a little differently and, inevitably, misses undiagnosed infections and deaths,” Reuters’ COVID-19 Global Tracker states.
It’s like looking at an iceberg, says one of India’s top epidemiologists, Dr. Jayaprakash Muliyil, chairperson of the Scientific Advisory Committee of the National Institute of Epidemiology, in a phone conversation. “The number of cases the system picks up is a fraction [of the actual number of infections],” he says. “A large number of cases are subclinical [not severe enough to present definite or readily observable symptoms].” This fraction depends on several factors—it is lower in smaller states with better infrastructure, like Pudducherry, and higher in others with greater population density, like Bihar.
A recent study found a “severe under-ascertainment of COVID-19 cases” across U.S. states and countries worldwide. “In 25 out of the 50 countries, actual cumulative cases were estimated to be 5–20 times greater than the confirmed cases,” report authors Jungsik Noh and Gaudenz Danuser, adding that, “The estimation of the actual fraction of currently infected people is crucial for any definition of public health policies, which up to this point may have been misguided by the reliance on confirmed cases.”
Serological surveys (using antibody tests) indicate that the actual number of infected people could be 30 times higher in India than what official figures show. COVID-related deaths could be anything between 2 to 5 times and 10 to 15 times than what is being reported.
Modeling methods may be a headache, but pandemic curves always come down, and this one will too, says Dr. Muliyil. He is not a fan of lockdowns for a country like India—having said back in September that it had flattened the wrong curve, that of the economy. With newer mutations of the virus appearing to be more easily transmissible, he says that an infection rate of 70 to 75 percent might be required for herd immunity. Meanwhile, “natural protection to the virus is excellent.” He prescribes strategic vaccination—focusing on the 45-plus age group rather than younger people, and those who haven’t been infected— and “bring back the urge to mask up and avoid crowds.”
Payal Dhar is a freelance journalist from India who writes on science, technology and society.
Editor’s note: If you would like to contribute to help the situation in India, here are three recommendations from Payal:
- India Covid Relief is a hub site that links to organizations helping on the ground, such as Hemkunt Foundation, Give India, Goonj, and Milaap.
- @gresshaa on Twitter has compiled a list including Venmo accounts and other international options for direct donations.
- Khalsa Aid is a humanitarian organization founded on Sikh principles, currently providing medical aid to India.
The COVID-19 Data Dispatch was able to compensate Payal for this piece thanks to the support of the COVID-19 Data Dispatch’s members. We hope to be able to feature more guest writers in the future—if you’d like to support this work, please consider a contribution.
-
National numbers, May 2
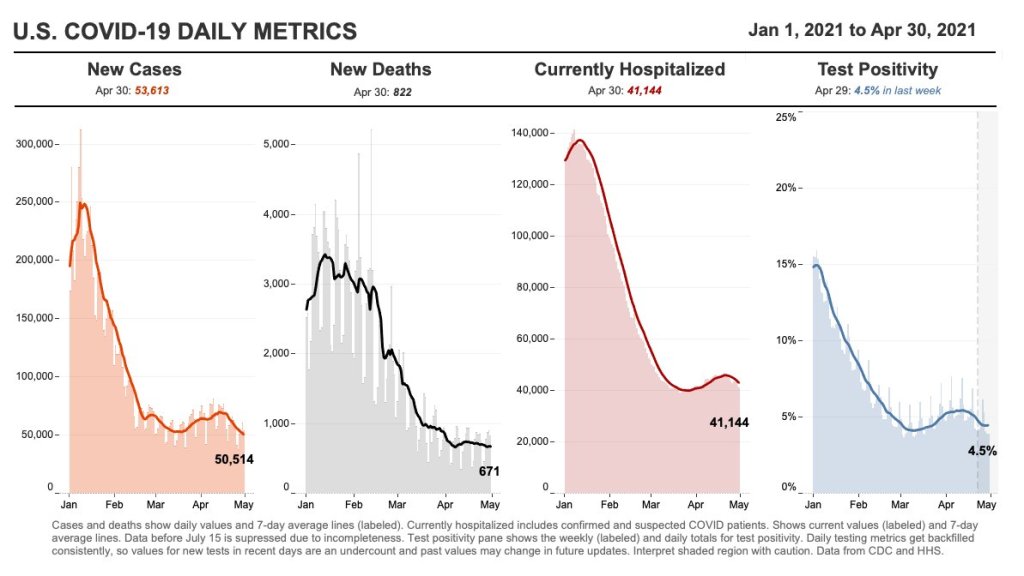
In the past week (April 24 through 30), the U.S. reported about 368,000 new cases, according to the CDC. This amounts to:
- An average of 53,000 new cases each day
- 112 total new cases for every 100,000 Americans
- 1 in 893 Americans getting diagnosed with COVID-19 in the past week
- 16% fewer new cases than last week (April 17-23)

Nationwide COVID-19 metrics as of April 30, sourcing data from the CDC and HHS. Posted on Twitter by Conor Kelly. Last week, America also saw:
- 35,400 new COVID-19 patients admitted to hospitals (11 for every 100,000 people)
- 4,400 new COVID-19 deaths (1.3 for every 100,000 people)
- 59.2% of new cases in the country now B.1.1.7-caused (as of April 10)
- An average of 2.55 million vaccinations per day (per Bloomberg)
New cases are down for the second week in a row—good news after the 70,000-plus peak of mid-April. Still, 50,000-plus cases in a day is no good place to plateau, new hospital admissions remain over 5,000 a day, and vaccinations are slowing: the U.S. is now averaging about 2.6 million shots a day, down from 3.4 million a couple of weeks ago.
As we discussed last week, the U.S. vaccination campaign has entered a phase in which supply is higher than demand. Even with Johnson & Johnson now back on the market, many of the people who were desperate to get their shots have already secured those doses, leaving public health experts and local leaders to figure out how to both lower access barriers and alleviate concerns in less vaccine-confident communities.
The extra supply has enabled U.S. officials to say they can spare some doses that won’t be used here: 60 million AstraZeneca doses will go to India and other countries, after they undergo FDA review. Still, some experts are arguing that the U.S. could do far more by waiving patents for the COVID-19 vaccines—a move that Brazil’s senate just voted to make for its own country’s products on Friday.
There is one good piece of vaccine news this week, though: several states are closing their vaccine equity gaps, according to Bloomberg’s tracker. White vaccination rates are slowing more drastically than rates in minority populations, allowing those communities to catch up. “Since early February, Alabama, Louisiana, Maryland, Mississippi and North Carolina have narrowed their Black vaccination gaps most,” Bloomberg’s team reports.
Meanwhile, the coronavirus variants just keep spreading. The CDC updated its variant proportions data this week, reporting that B.1.1.7 is now causing a clear majority of COVID-19 cases in the country (59%). Michigan, Minnesota, and Tennessee have B.1.1.7 proportions closer to 70%. B.1.1.7 also appears to be outcompeting the California variants (B.1.427/B.1.429) in parts of the West where those variants had previously dominated. Still, as we keep emphasizing, these data are several weeks old; this week’s CDC update includes figures as of April 10, and the true B.1.1.7 numbers are likely higher.
Stay safe out there, readers, and help your communities get vaccinated.
-

COVID source shout-out: CDC’s vaccine blue
As anyone who follows me on Twitter could likely tell you, I love to make fun of the CDC’s vaccination dashboard. The agency uses the color blue like it’s going out of style, with heatmap-style charts that range from teal to a dark, indigo shade for states that have administered the most vaccine doses relative to their populations.
I have no problem with the color blue. But the CDC doesn’t always update its color categories in time with increasing vaccination rates, which can lead to charts like this:
Or this:
This week, the agency’s dedication to blue got even more intense, with this graphic shared in the White House COVID-19 briefing on Friday:
Much as I love to make fun, though, I have to admit that I do love the vaccine blue. Or, more accurately, I love what the blue represents: a darker shade means more people getting vaccinated, more people protecting themselves and their communities from the coronavirus.
Dr. Walensky tapped into this sentiment during Friday’s briefing, when she said: “Now that everyone is eligible to receive a vaccine, please help turn your county toward more protection and a darker shade of blue. The healthier our families are, the healthier we will be as a nation.”
Dark blue! More vaccines! Let’s go! (Now, can we send some of our extra doses to India, please?)
-
Featured sources, April 25
- NYT Prisons and Jails COVID-19 counts: This week, the New York Times published data from the newsroom’s effort tracking COVID-19 cases and deaths in U.S. prisons and jails. The data include both inmates and correctional officers, covering over 2,800 facilities. You can read more about the dataset in this Twitter thread.
- RTI COVID-19 Data Insights Tool: This new data tool from RTI International provides county-level COVID-19 insights. The tool uses publicly available case data from Johns Hopkins and other sources to estimate infection risk, share of the population with some degree of immunity, and other metrics. You need to provide a name and email in order to access the tool.
-
The CDD was profiled by a Greek media lab
The Incubator for Media Education and Development, or iMedD, is a nonprofit based in Athens, Greece that supports new practices, credibility, and transparency in international journalism. I was lucky enough to meet Kelly Kiki, a journalist and project manager at iMedD’s content production arm, at the NICAR conference earlier this year.
Kelly has spent much of the past year compiling and reporting on Greek COVID-19 data; we found a lot of common ground in the challenges we have both faced, from discrepancies in regional numbers to a lack of data on cases in schools.
After an international Zoom call and many emails, Kelly wrote a profile of my work at the COVID-19 Data Dispatch. The profile was published on iMedD Lab’s site earlier this week—you can read it in English or in Greek!
The profile touches on why I started the CDD, how I compile each issue, and some of my thoughts on major COVID-19 data problems in the U.S.:
Asked about the quality of pandemic data in the US at both federal and state level, Ladyzhets tells us that what she perceives as one of the biggest problems is the fact that “in this country, we are not actually dealing with one singular, standardized system. We’re instead dealing with 56 smaller systems (50 states and 6 territories). Each system has its own rules, its own reporting practices, its own data definitions. All the systems have been underfunded for decades and were given very little guidance from the federal government… You really see this lack of leadership and consistency everywhere, from the fact that some states reported their tests in units of specimens while others reported in units of people, to the fact that two states are still not reporting race and ethnicity data for their vaccinated residents, even now, four months into the vaccination effort”.
-
J&J is back on the menu
After 10 days, the pause on the J&J vaccine has been lifted. According to CDC Director Rochelle Walensky, there have been about 1.9 cases of severe blood clotting per million people who had received the J&J vaccine. It has been re-authorized for use in people aged 18 and older, now with an addendum to the label and fact sheet warning of the risk of blood clots:
It’s important to note that at time of writing (April 24) only some states have already resumed its use. (These are Arizona, Colorado, Connecticut, Louisiana, Maine, Massachusetts, Michigan, Missouri, Nevada, New York, Tennessee, Texas, Indiana, and Virginia.) However, this is coinciding with a larger trend of states ordering fewer vaccine doses.
The J&J vaccine’s return is probably good news for the rest of the world as well. Combined with the AstraZeneca vaccine, the J&J vaccine was supposed to be one of the big players in the global fight against COVID-19. But the U.S. pause raised concerns for vaccine diplomacy and the global rollout—J&J had also paused its European distribution, South Africa announced they were putting J&J distribution on a temporary hiatus, and Australia said it wouldn’t purchase any J&J doses. Resuming distribution in the U.S., which can act as a bellwether for which vaccines are seen as desirable abroad, might allay concerns about safety abroad.
More vaccine coverage
- Sources and updates, November 12Sources and updates for the week of November 12 include new vaccination data, a rapid test receiving FDA approval, treatment guidelines, and more.
- How is the CDC tracking the latest round of COVID-19 vaccines?Following the end of the federal public health emergency in May, the CDC has lost its authority to collect vaccination data from all state and local health agencies that keep immunization records. As a result, the CDC is no longer providing comprehensive vaccination numbers on its COVID-19 dashboards. But we still have some information about this year’s vaccination campaign, thanks to continued CDC efforts as well as reporting by other health agencies and research organizations.
- Sources and updates, October 8Sources and updates for the week of October 8 include new papers about booster shot uptake, at-home tests, and Long COVID symptoms.
- COVID source shout-out: Novavax’s booster is now availableThis week, the FDA authorized Novavax’s updated COVID-19 vaccine. Here’s why some people are excited to get Novavax’s vaccine this fall, as opposed to Pfizer’s or Moderna’s.
- Sources and updates, November 12
-
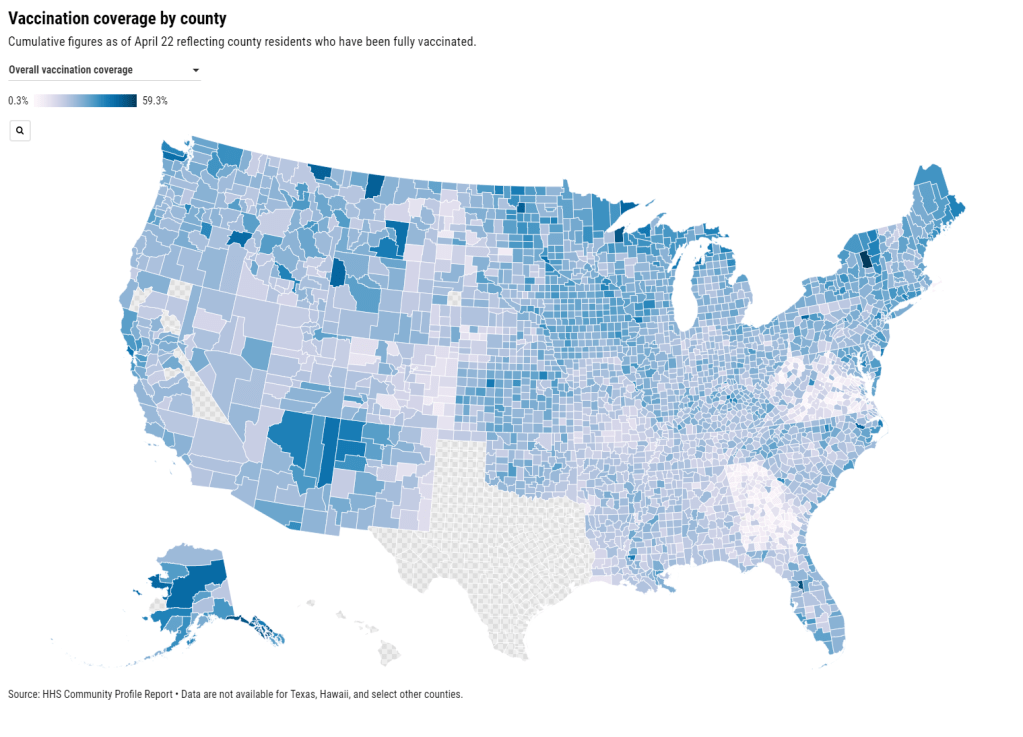
Community Profile Reports now have vaccination data
You can now get vaccination numbers for U.S. states, counties, and metropolitan areas in an easily downloadable format: the Community Profile Reports published daily by the Department of Health and Human Services (HHS). These reports are basically the HHS’s one-stop shop for COVID-19 data, including information on cases, deaths, PCR tests, hospitalizations—and now, vaccines. (Read more about the reports here.)
For counties and metro areas, the reports just include numbers and percentages of people who have been fully vaccinated, reported for the overall population and the regions’ seniors (age 65+). For states, the reports include more comprehensive information that matches the data available at the CDC’s COVID Data Tracker.
I visualized the county-level data, including both the overall and 65+ rates. I think this chart demonstrates how valuable it is for the public to have easy access to these data: you can see much more specific patterns reflecting which communities are ahead on vaccination and which still need to catch up.
A COVID Tracking Project friend alerted me to this data news last Monday, April 19. When I dug back into the past couple weeks of Community Profile Reports, however, I found that the HHS started including vaccination data in these reports one week earlier, on April 12. As seems to be common for federal data updates, the new information wasn’t announced in press briefings or other standard lines of communication.
Next, I would love to see the CDC make more granular demographic data available so that we can analyze these patterns with an equity lens. State-level or county-level vaccination rates by race and ethnicity would be huge.
As a reminder, you can find the CDD’s annotations on all major U.S. national and state vaccine data sources here.
More vaccine coverage
- Sources and updates, November 12Sources and updates for the week of November 12 include new vaccination data, a rapid test receiving FDA approval, treatment guidelines, and more.
- How is the CDC tracking the latest round of COVID-19 vaccines?Following the end of the federal public health emergency in May, the CDC has lost its authority to collect vaccination data from all state and local health agencies that keep immunization records. As a result, the CDC is no longer providing comprehensive vaccination numbers on its COVID-19 dashboards. But we still have some information about this year’s vaccination campaign, thanks to continued CDC efforts as well as reporting by other health agencies and research organizations.
- Sources and updates, October 8Sources and updates for the week of October 8 include new papers about booster shot uptake, at-home tests, and Long COVID symptoms.
- COVID source shout-out: Novavax’s booster is now availableThis week, the FDA authorized Novavax’s updated COVID-19 vaccine. Here’s why some people are excited to get Novavax’s vaccine this fall, as opposed to Pfizer’s or Moderna’s.
- Sources and updates, November 12
