Blog

  • Breakthrough cases: What we know right now

    Breakthrough cases: What we know right now

    Washington is one of the states reporting high levels of detail about breakthrough cases. Screenshot via June 23 report.

    For the past few months, we’ve been watching the vaccines and variants race in real time. With every new case, the coronavirus has the opportunity to mutate—and many scientists agree that it will inevitably mutate into a viral variant capable of outsmarting our current vaccines.

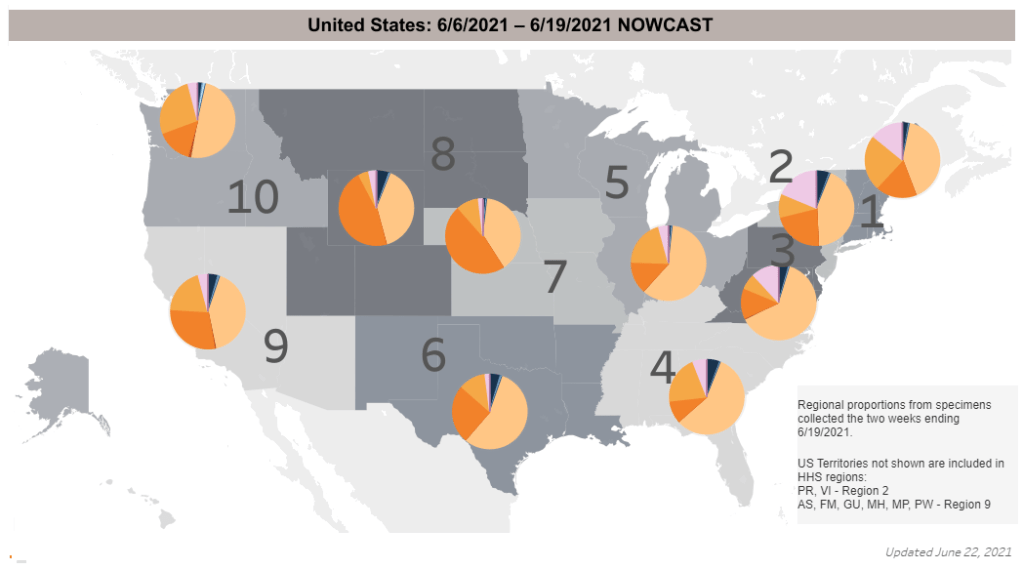
    How will we know when that happens? Through genomic surveillance, examining the structure of coronavirus lineages that arise in the U.S. and globally. While epidemiologists may consider any new outbreak a possible source of new variants, one key way to monitor the virus/variant race is by analyzing breakthrough cases—those infections that occur after someone has been fully vaccinated. 

    In May, the CDC changed how it tracks breakthrough cases: the agency now only investigates and reports those breakthrough cases that result in hospitalizations or deaths. I wrote about this in May, but a new analysis from COVID Tracking Project alums and the Rockefeller Foundation provides more detail on the situation.

    A couple of highlights from this new analysis:

    • 15 states regularly report some degree of information about vaccine breakthroughs, some including hospitalizations and deaths.
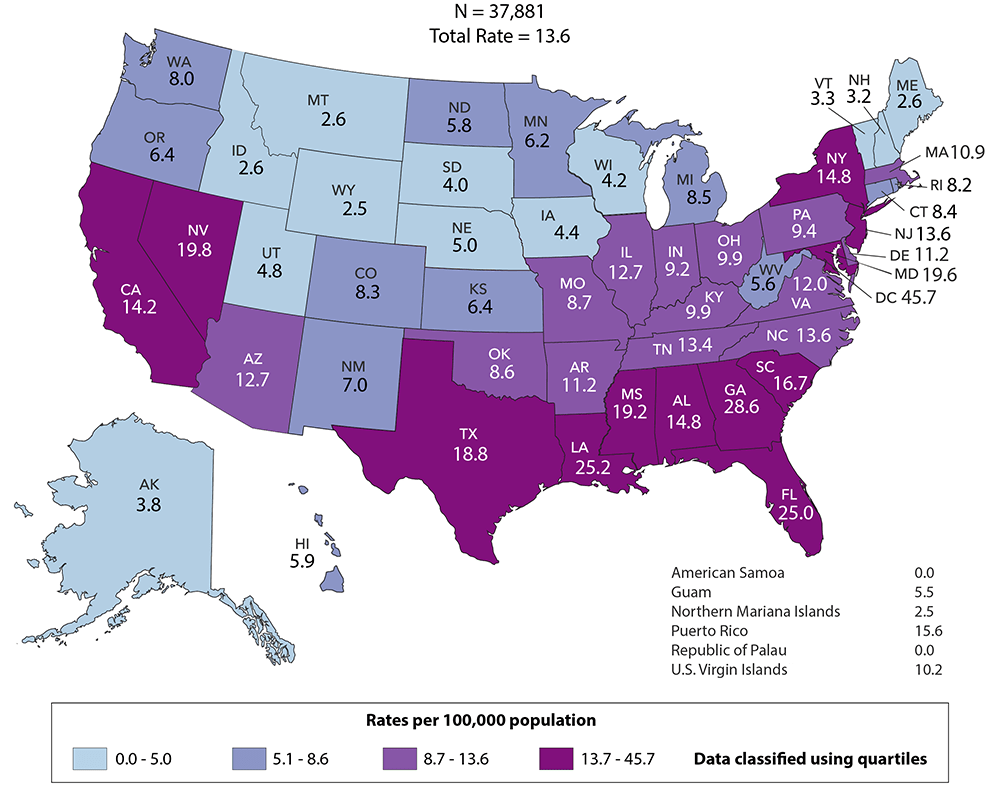
    • Six states report sequencing results identifying viral lineages of their breakthrough cases: Nebraska, Arkansas, Alaska, Montana, Oregon, and Washington.
    • Washington and Oregon are unique in providing limited demographic data about their breakthrough cases.
    • Several more states have reported breakthrough cases in isolated press briefings or media reports, rather than including this vital information in regular reports or on dashboards.
    • When the CDC stopped reporting breakthrough infections that did not result in severe disease, the number of breakthrough cases reported dropped dramatically.
    • We need more data collection and reporting about these cases, on both state and federal levels. Better coordination between healthcare facilities, laboratories, and public health agencies would help.

    Vaccine breakthrough cases are kind-of a data black box right now. We don’t know exactly how many are happening, where they are, or—most importantly—which variants they’re tied to. The Rockefeller Foundation is working to increase global collaboration for genomic sequencing and data sharing via a new Pandemic Prevention Institute.

    Luckily, there is a lot we do know from another side of the vaccine/variant race: vaccine studies have consistently brought good news about how well our current vaccines work against variants. The mRNA vaccines in particular are highly effective, especially after one has completed a two-dose regimen. If you’d like more details, watch Dr. Anthony Fauci in Thursday’s White House COVID-19 briefing, starting about 14 minutes in.

    New research, out this week, confirmed that even the one-shot Johnson & Johnson vaccine works well against the Delta variant. The company reported that, after a patient receives this vaccine, blood antibody levels are high enough to beat off an infection from Delta. In other words, people who got the J&J shot do not need to rush to get a booster shot from an mRNA vaccine (a recent debate topic among some experts).

    Again, we’ll need more genomic surveillance to carefully watch for the variant that inevitably does beat our vaccines. But for now, the vaccinated are safe from variants—and getting vaccinated remains the top protection for those who aren’t yet. 

    More variant reporting

    • The US missed Biden’s July 4 goal: How did your community do?

      The US missed Biden’s July 4 goal: How did your community do?

      The U.S. missed President Biden’s big vaccination goal: 70% of adults vaccinated with at least one dose by July 4. As of July 3, we are at 67% of adults with one dose, and 58% fully vaccinated.

      I did a data-driven look at the vaccination goal this week in a story for the Daily Mail. The story focuses on which parts of the country have met the goal—and which areas fell short. Those under-vaccinated areas are highly vulnerable to the Delta variant (B.1.617.2), which is now spreading rapidly in many of those pockets. Reminder: the Delta variant is much more transmissible than even the Alpha variant (B.1.1.7), and its presence is doubling in the U.S. every two weeks.

      There are over 1,000 counties in the U.S. with one-dose vaccination rates under 30%, CDC Director Dr. Walensky said at a press briefing last week. The U.S. has about 3,100 counties in total.

      Is your county one of them? Check it out on this interactive map, reflecting data as of July 1:

      I also made a map showing vaccination rates by metropolitan area. You can clearly see clusters of high vaccination in the Northeast and on the West coast, while parts of the South and Midwest are under-vaccinated. Note that Texas is missing in both this dataset and the county-level data due to issues in the state’s reporting to the CDC.

      For my Daily Mail story, I also asked two of the COVID-19 science communicators I most admire to explain the significance of that missed 70% goal. I talked to Dr. Uché Blackstock, physician and founder of the organization Advancing Health Equity, and Dr. Katelyn Jetelina, epidemiologist at the University of Texas and writer of the Your Local Epidemiologist newsletter.

      Here are both of their takes on the missed goal:

      So, we didn’t meet the 70% goal. It means that we fell short. It also means that we just don’t have enough people vaccinated, not even close, to reach herd immunity.

      To me, as an epidemiologist, someone in the field and also someone within a community, it means that we have reached—or are about to reach—saturation [of the vaccine market]. We need to start becoming very innovative about how to address vaccine hesitancy, as well as how to address vaccine equity.

      That’s really going to be the next phase of public health approaches. And then, how do we go about doing this… You know, we’re well beyond billboards now. We really need to mobilize a grassroots movement. We need to listen about concerns, we need to educate about these concerns.

      And then, we need to make vaccines more accessible. Especially among pediatrics, where—pediatrician offices can’t store the vaccine. So we have to go to schools and really engage with families in a “nontraditional sense.”

      Dr. Katelyn Jetelina

      This 70%, especially for one dose, is sort of an arbitrary number, because we know that being fully vaccinated is what’s needed to fully protect you against variants. I think it was obviously wise and aspirational to have a goal. But at this point, because we’re basically seeing the number of people vaccinated decreasing weekly, and substantially since last April… I think we need to change our perspective.

      We had the early adopters who came in droves to get vaccinated. We’re not going to see the same numbers anytime soon. And so, I think that this idea of having a goal, while it’s aspirational, I think that we have to put that aside and think more realistically about the challenges we’re dealing with.

      And the challenges we’re dealing with are actually quite complicated… There are still access issues, although I do think the Biden administration is doing—at least trying to do a substantial job in knocking down those barriers. They’re providing transportation, childcare, increasing the access points for getting vaccinations, encouraging small businesses to offer their workers paid sick leave to get vaccinated and to recover from the vaccine.

      But I think this other issue that we’re seeing among people who are not vaccinated, it varies depending on the population, the geographical area. We know rural populations are less likely [to get vaccinated]. And we know that, among the “wait and see” group, about half of those are people of color.

      I hate to blame it on this so-called “vaccine hesitancy” because I don’t think it’s that simple. I do think, though, that there is a significant distrust of government, there is distrust of the healthcare system, and there is a lot of misinformation out there about the vaccines. All of these are essentially creating the perfect storm that is preventing us from getting to this aspirational [70%] number.

      But here, we’re at this point where it’s a race against the variants, and I think that we just have to get as many people vaccinated as possible. I know that sounds incredibly vague, but that really is the goal.

      Dr. Uché Blackstock

      I made a third chart for today’s issue, visualizing vaccination rates by state from March through June. It really shows how vaccine enthusiasm has leveled off, just about everywhere in the country—but the plateaus started earlier in many of those states that have lower rates now. 

      I typically try to avoid anything approaching medical advice in the COVID-19 Data Dispatch, as I am a journalist with just an undergraduate biology degree and a couple of years of science reporting experience. But this week, it feels appropriate to wholeheartedly, unambiguously encourage vaccination.

      I know the audience for a publication like this one skews towards people who probably have their shots already. Rather, I want to encourage you to find those people in your community who aren’t yet vaccinated, and help them take that step.

      Recent research suggests that lotteries and other large-scale incentives do not significantly encourage vaccination; instead, we need small-scale incentives. One-on-one conversations with people, opportunities for concerns to be voiced and addressed, appointments that can be tailored to the individual’s needs. Anything that you can do to play a role in these initiatives, please get out there and do it.

      Of course, if you (or your friends/family/community members/etc.!) have questions about vaccines, or anything else COVID-19 related, you know where to find me. Inquiries welcome at betsy@coviddatadispatch.com

      More vaccine reporting

      • Sources and updates, November 12
        Sources and updates for the week of November 12 include new vaccination data, a rapid test receiving FDA approval, treatment guidelines, and more.
      • How is the CDC tracking the latest round of COVID-19 vaccines?
        Following the end of the federal public health emergency in May, the CDC has lost its authority to collect vaccination data from all state and local health agencies that keep immunization records. As a result, the CDC is no longer providing comprehensive vaccination numbers on its COVID-19 dashboards. But we still have some information about this year’s vaccination campaign, thanks to continued CDC efforts as well as reporting by other health agencies and research organizations.
      • Sources and updates, October 8
        Sources and updates for the week of October 8 include new papers about booster shot uptake, at-home tests, and Long COVID symptoms.
      • COVID source shout-out: Novavax’s booster is now available
        This week, the FDA authorized Novavax’s updated COVID-19 vaccine. Here’s why some people are excited to get Novavax’s vaccine this fall, as opposed to Pfizer’s or Moderna’s.
      • COVID-19 vaccine issues: Stories from COVID-19 Data Dispatch readers across the U.S.
        Last week, I asked you, COVID-19 Data Dispatch readers, to send me your stories of challenges you experienced when trying to get this fall’s COVID-19 vaccines. I received 35 responses from readers across the country, demonstrating issues with insurance coverage, pharmacy logistics, and more.
    • National numbers, July 4

      National numbers, July 4

      Cases are rising in unvaccinated areas, such as Las Vegas and parts of Texas. Chart via the July 1 Community Profile Report.

      In the past week (June 26 through July 2), the U.S. reported about 88,000 new cases, according to the CDC. This amounts to:

      • An average of 12,500 new cases each day
      • 27 total new cases for every 100,000 Americans
      • 9.1% more new cases than last week (June 19-25)

      Last week, America also saw:

      • 13,000 new COVID-19 patients admitted to hospitals (4.0 for every 100,000 people)
      • 1,400 new COVID-19 deaths (0.4 for every 100,000 people)
      • 26% of new cases now Delta-caused (as of June 19)
      • An average of 1.1 million vaccinations per day (per Bloomberg)

      This is the first week since April that we’ve seen new COVID-19 case numbers go up in the U.S. It’s nominally a small bump—about 7,300 more cases than last week—but represents a 9% increase, and may be the beginning of a summer surge. (Even if we see a dip in the numbers this week due to the July 4 holiday.)

      The culprit for this case rise is, of course, the Delta variant (B.1.617.2). According to CDC estimates, the variant makes up about 26% of new cases in the country. But, as I have explained in previous issues, the CDC data are old—that 26% estimate is as of June 19, about two weeks ago.

      The Delta variant is doubling every two weeks, so we can assume that the variant now causes at least half of new cases in the U.S. Estimates from other genomic sequencing sources (which are more up-to-date than the CDC, though less comprehensive) indicate that the variant may now be causing up to 60% of new cases.

      This variant poses the most danger to unvaccinated people; many of the current Delta outbreaks are happening in regions with lower vaccination rates. Nevada and Missouri, the two states with the highest new case counts last week, have about 42% and 39% of their populations fully vaccinated, respectively.

      Some metropolitan areas in Missouri, Texas, and other parts of the Midwest have less than one-third of their populations fully vaccinated—and saw more than 200 new cases for every 100,000 people last week. That’s about seven times the national average for new cases. 

      Nationally, hospitalizations also rose very slightly this week, while deaths remained low, at about 200 new COVID-19 deaths each day. The vaccines continue to protect seniors and other more vulnerable people from severe disease. But it is likely that, in the coming weeks, these numbers will start to rise in the areas seeing Delta outbreaks. Many Midwest hospitals are already filling up.

      More on vulnerable, non-vaccinated pockets later in this issue.

    • Featured sources, June 27

      • Vaccine hesitancy by ZIP code: A new data visualization tool from the Institute for Health Metrics and Evaluation provides details on which parts of the U.S. would most benefit from vaccination campaigns. The underlying data come from a survey run by the Delphi Research Group at Carnegie Mellon, conducted between June 4 and June 10.
      • OIG report on nursing homes: The HHS Office of Inspector General published a new report this week evaluating COVID-19 outbreaks in nursing homes. The report found that two in five Medicare beneficiaries living in nursing homes were diagnosed with COVID-19 (confirmed or probable cases) in 2020, and almost 1,000 more seniors died per day in April 2020 compared to April 2019.
      • The State of the Nation’s Housing, 2021: This comprehensive report from the Joint Center for Housing Studies at Harvard provides data on home prices, rents, and other related metrics for the past year. The report shows that many households—especially those who are Black and Hispanic—are still behind on housing payments, and could benefit from continued assistance (such as the CDC eviction moratorium extended this week).

    • Will the Tokyo Olympics be a superspreading event?

      Will the Tokyo Olympics be a superspreading event?

      Back in May, Sarah Braner wrote that Japan was seeing a COVID-19 spike in the lead-up to the Tokyo Olympics, which are scheduled to start in late July. The situation has remained worrying since then.

      True, cases have dropped significantly since the May outbreak—the nation is now seeing around 1,500 cases a day, compared to a peak of 6,500 on May 14. But many Japanese residents are concerned that the Olympic games could push numbers back up.

      Despite a recent push towards vaccinations, Japan’s numbers remain low: just over 20% of the population has received at least one dose, as of June 24. On social media, Japanese residents have reported issues with getting their shots due to a voucher system implemented earlier this spring. A resident must receive a vaccine voucher from the government in order to get their shot; without that bureaucratic step, they may be turned away from a vaccine clinic, even if doses are available.

      Meanwhile, rules around the Olympics have focused on protecting the athletes themselves. Over 80% of the athletes have been vaccinated and Japan will prioritize getting shots to Olympics staffers, journalists, and volunteers, according to the New York Times. Athletes will also be tested regularly.

      The Olympics are not allowing international spectators, but officials announced this week that Japanese crowds will be permitted—up to 50% of a venue’s capacity. While masks will be required and other guidelines will be in place, the rules for attendees are not nearly so strict as those for athletes.

      It only takes one unvaccinated person to set off a superspreading event. And with variants like Delta and Gamma spreading rapidly around the world, such events are more likely and more dangerous. In order to truly make the Olympics safe, Japan should ensure the coronavirus is locked out of Olympic events—not just for athletes, but for workers and spectators as well.

      More international reporting

      • Delta and Gamma are starting to dominate

        Delta and Gamma are starting to dominate

        This week, the CDC titled its weekly COVID-19 data report, “Keep Variants at Bay. Get Vaccinated Today.” I love a good rhyme, but the report also makes a valuable point: vaccinations not only protect individuals from coronavirus variants, they also reduce community transmission—slowing down future viral mutation.

        Delta, or B.1.617.2, is particularly dangerous. As I’ve written before, this variant spreads much more quickly than other strains of the coronavirus and may cause more severe illness, though scientists are still investigating that second point. Thanks to this variant, it’s now much more dangerous to be unvaccinated than it was a year ago.

        The Delta variant was first linked to a surge in India, but it’s now become dominant in the U.K., Russia, Indonesia, and other countries. As Eric Topol recently pointed out on Twitter, the variant’s dominance has led to sharp rises in cases—and in deaths—for these nations.

        The U.S. is somewhat distinct from the U.K., though, because we had a more diverse group of variants circulating here before Delta hit. In the U.K., Delta arrived in a coronavirus pool that was 90% Alpha (B.1.1.7); here, the Alpha variant peaked at about 70%, with several other variants of concern also circulating.

        In other words: we can’t forget about Gamma. Gamma, or P.1, was first identified in Brazil late in 2020. While it’s not quite as fast-spreading as Delta, it’s also highly transmissible and may be able to more easily re-infect those who have already recovered from a past coronavirus infection.

        The Gamma variant now causes an estimated 16% of cases in the U.S. while the Delta variant causes 21%, per the CDC’s most recent data (as of June 19). Both are rapidly increasing as the Alpha variant declines, now causing an estimated 53% of cases.

        A recent preprint from Helix researchers suggests an even starker change in the U.S.’s variant makeup. Helix’s analysis shows that Alpha dropped from 70% of cases in April 2020 to 42% of cases, within about six weeks.

        Delta will certainly dominate the U.S. in a few weeks, but Gamma will likely be a top case-causer as well. Other variants that once worried me—like those that originated in New York and California—are getting solidly outcompeted.  

        The TL;DR here is, get vaccinated. Don’t wait. Tell everyone you know.

        More variant reporting

        • Lessons for COVID-19 from the HIV/AIDS pandemic

          Lessons for COVID-19 from the HIV/AIDS pandemic

          In the U.S., southern states have the highest numbers of HIV-positive residents. Chart via the CDC.

          This is the last week of Pride Month for 2021, and it’s also officially Pride weekend in NYC, where I live. (As the newsletter goes out, I’ll likely be marching with the Stonewall Protests, a group that advocates for Black trans women.)

          So, it felt appropriate for me to take this issue to highlight a couple of lessons that the U.S. response to COVID-19 has taken from our response to another pandemic—one that is still ongoing.

          HIV, the virus that causes AIDS, infects over one million new people every year. The HHS estimates that there were about 38 million people living with this virus around the world in 2020, including 1.2 million in the U.S. While many of us might associate HIV/AIDS with American outbreaks in the 1980s and 90s, it continues to disproportionately impact people of color and queer people in the U.S. and globally.

          In the U.S., the South has higher HIV infection rates than any other part of the country. Black Americans are diagnosed with the virus at rates almost ten times higher than white Americans, according to CDC data from 2014 to 2018. At a global scale, the virus disproportionately impacts African nations; Swaziland has the highest infection rate, at 27%.

          Treatments do exist for HIV, a virus that attacks the body’s immune system, and AIDS, the immunodeficiency condition that this virus causes. The most common treatment is antiretroviral therapy (or ART), which allows people with HIV infections to live long, healthy lives and avoid transmitting the virus to sexual partners. The HHS estimates that about 16% of the global population with HIV (or about 6 million people) does not know they’re infected, and still needs access to tests and treatment.

          This is a pandemic that demands continued focus even after urgency around COVID-19 wanes. But the responses to HIV/AIDS—both scientific and political—can show us how an understanding of intersectionality and local community focus may contribute to pandemic response.

          Understanding disparities and comorbidities

          People living with HIV are more vulnerable to severe COVID-19. One study of HIV patients in New York state found that, if diagnosed with COVID-19, these patients were more likely to go to the hospital and more likely to die from the disease compared to non-HIV patients.

          An HIV diagnosis, like a case of diabetes or asthma, is a disease that hits people of color harder and may contribute to their worse COVID-19 rates. Public health efforts around COVID-19 can learn from clinicians focused on HIV/AIDS, who are already used to connecting with vulnerable communities and understanding the intersectional socioeconomic factors that contribute to their health.

          It takes a long time to learn disease origins

          This page on the evolution of HIV may give you an idea of the many steps that typically go into finding a disease’s source. When the page was first written, in 2008, scientists had found ties between the virus and chimpanzees in west-central Africa, but they didn’t know all the details of its first jump to humans. News updates in 2010, 2015, and 2020 provide more information, reflecting updates in scientific knowledge: newer research suggests that the virus spread to humans in the early 20th century and went undetected for decades.

          These updates remind us that scientists cannot pinpoint biological disease origins overnight. Scientists are still working to understand the evolution of HIV, decades after we first became aware of the disease. There are other outbreaks, not as old as HIV but older than COVID-19, that we still don’t understand:

          Regulatory pathways need to prioritize patients

          In the 1980s, AIDS activists led by the AIDS Coalition to Unleash Power (or ACTUP) protested the FDA and other public health officials. They saw the agency’s drug approval process as a barrier, keeping them from accessing potentially life-saving treatments; while small numbers of patients received new drugs in clinical trials, the vast majority of HIV-positive Americans had to wait for data to come out. Even Dr. Anthony Fauci was involved: AIDS activist Larry Kramer called him a killer and an idiot in a 1988 letter. Fauci later credited Kramer with pushing for change in the medical establishment.

          As a result, we can thank those AIDS activists who advocated for processes that allow faster drug development and patient treatment in times of crisis. This includes faster vaccine trials and the hundreds of Emergency Use Authorizations provided to COVID-19 tests and treatments over the past year.

          Neighborhood-level healthcare provides critical services

          People living with HIV in the U.S. often were not able to access support from the government or healthcare insurance, especially earlier in the 1980s. As a result, many queer communities organized locally to provide their own support. Neighborhoods like the Castro district in San Francisco and Greenwich Village in New York saw healthcare clinics, free testing, information-sharing about virus prevention, and more. These local institutions built trust in their communities.

          Such trust was also key in the COVID-19 pandemic, when government agencies from the federal to the county level weren’t ready to serve their residents. In an article for The Conversation, Daniel Baldwin Hess and Alex Bitterman describe how some of the same community groups that started to provide HIV testing decades ago added COVID-19 testing to their repertoire this year:

          For example, in New York, the Erie County Department of Health requested that Evergreen Health – an LGBTQ community group originally established in the 1980s as a volunteer effort to fight HIV – assume responsibility for HIV testing during the COVID-19 pandemic so that the county government could focus on COVID-19 testing. Evergreen also opened a drive-though COVID-19 testing center in the spring of 2020 – four decades after it had introduced HIV testing to the Buffalo region.

          These local institutions have also helped build vaccine trust and administer doses.

          Finally, there’s one lesson we may take from COVID-19 back to the continued fight against HIV/AIDS: mRNA vaccines! Moderna is currently partnering with International AIDS Vaccine Initiative to develop a potential mRNA vaccine for HIV.

        • National numbers, June 27

          National numbers, June 27

          In the past week (June 19 through 25), the U.S. reported about 79,000 new cases, according to the CDC. This amounts to:

          • An average of 11,000 new cases each day
          • 24 total new cases for every 100,000 Americans
          • 4% fewer new cases than last week (June 12-18)

          Last week, America also saw:

          • 12,900 new COVID-19 patients admitted to hospitals (3.9 for every 100,000 people)
          • 2,000 new COVID-19 deaths (0.6 for every 100,000 people)
          • 52% of new cases in the country now Alpha-caused (as of June 19)
          • 21% of new cases now Delta-caused (as of June 19)
          • An average of 0.75 million vaccinations per day (per Bloomberg)
          CDC map showing estimated variant prevalence by region. The Delta variant, shown in orange here, is most common in the Midwest, where many are unvaccinated.

          Cases have continued to plateau this week, with less than a 5% drop in the daily average. As I’ve said in previous weeks, this is partially due to slowing vaccinations—the White House admitted last week that the U.S. won’t meet Biden’s July 4 goal—and partially due to the Delta variant, which now causes at least 20% of new cases in the country. (More on Delta later.)

          While those parts of the country that are widely vaccinated are still seeing low case numbers, others may need to prepare for another surge. A few Midwest states, in particular, have seen case jumps in recent weeks; the Delta variant is more prevalent in this region than others, per CDC data. (See the orange pie chart slices on the map above.)

          Missouri now has the highest rate of new COVID-19 cases per capita: 87 cases for every 100,000 people during the week ending June 23, more than three times higher than the national average. The state has seen a sharp increase in COVID-19 patients requiring hospital care, including younger adults who may be less likely to get vaccinated. Experts in the state worry that this may be “a preview of what is to come in other parts of the country that don’t have higher vaccination rates.”

          Just under 300 Americans are now dying from COVID-19 every day. A new analysis from the Associated Press confirms what many public health experts have expected: the vast majority of those deaths have occured in unvaccinated people. In May, only 150 out of over 18,000 COVID-19 deaths were in fully vaccinated Americans, the AP analysis found.

          This is why CDC Director Dr. Rochelle Walensky recently said that “nearly every death, especially among adults, due to COVID-19, is, at this point, entirely preventable.”

        • COVID source call-out: CDC’s county vaccination map

          COVID source call-out: CDC’s county vaccination map

          The CDC updated the County View page of its COVID Data Tracker this week, now allowing users to see vaccination coverage maps reflecting the population that has received at least one dose. (Previously, only fully vaccinated coverage maps were available.)

          The map does paint a stark picture of vaccination disparities in the U.S., with the Northeast and West coast notably darker blue than parts of the South and Midwest. However, the CDC’s UI leaves much to be desired.

          Try hitting the plus icon to zoom in, for example. You’ll land somewhere in the Pacific Ocean, with no way of dragging the map to an actual populated area. Then, when you zoom out, you stay in the Pacific, and the U.S. map gets even smaller.

          The best way to actually zoom in, I’ve found, is by clicking on an individual county or selecting a region with the drop-down menus above the map. Not exactly intuitive, CDC!

          (Thank you to my friend/CDD reader Charlotte for suggesting this callout.)

        • Featured sources, June 20

          • CDC adds more data on Delta: The CDC formally classified the Delta variant (B.1.617.2) as a Variant of Concern this week, and updated its Variant Proportions tracker page accordingly. This means data are now available on the variant’s state-by-state and regional prevalence—though the state-by-state figures are as of May 22 due to data lag.
          • AMA survey on doctor vaccinations: The American Medical Association (AMA) recently released survey data showing that 96% of U.S. physicians have been fully vaccinated against COVID-19, as of June 8. The 14-page report includes demographic data and other details.
          • Rural hospital closures: The North Carolina Rural Health Research Program at the University of North Carolina tracks hospitals in rural areas that close or otherwise stop providing in-patient care. The database includes 181 hospitals that have closed between 2005 and 2021, available in both an interactive map and a downloadable Excel file.
          • Health Security Net: This is a public repository including over 1,200 pandemic-related documents—research, hearings, government papers, and more—from the decades leading up to 2020, compiled by Georgetown’s Center for Global Health Science and Security. It’s built for scholars, journalists, and other researchers to analyze past and present responses to public health crises.