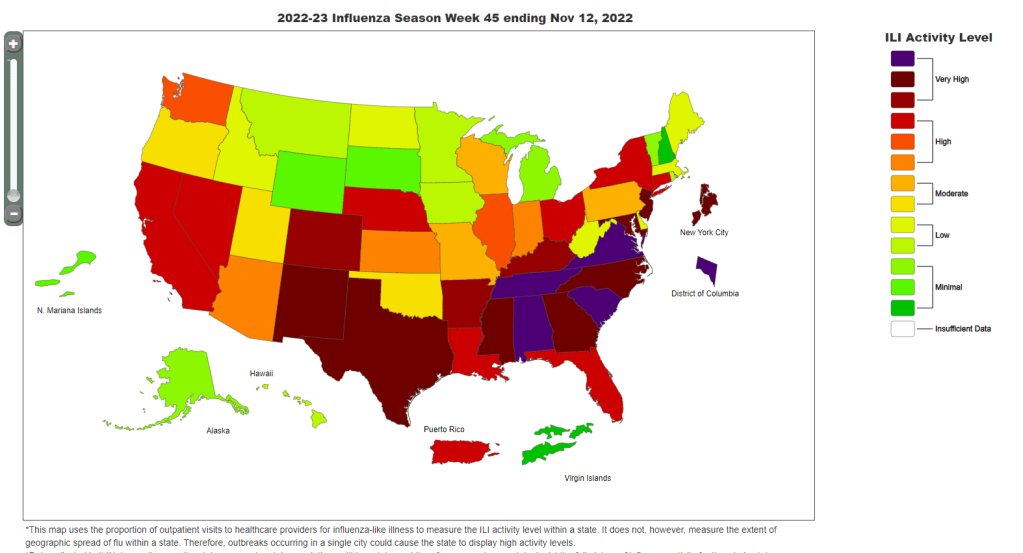
Data from the CDC indicate that much of the country is seeing high flu levels. Chart as of November 12.
In the past week (November 10 through 16), the U.S. reported about 280,000 new COVID-19 cases, according to the CDC. This amounts to:
An average of 40,000 new cases each day
86 total new cases for every 100,000 Americans
3% fewer new cases than last week (November 3-9)
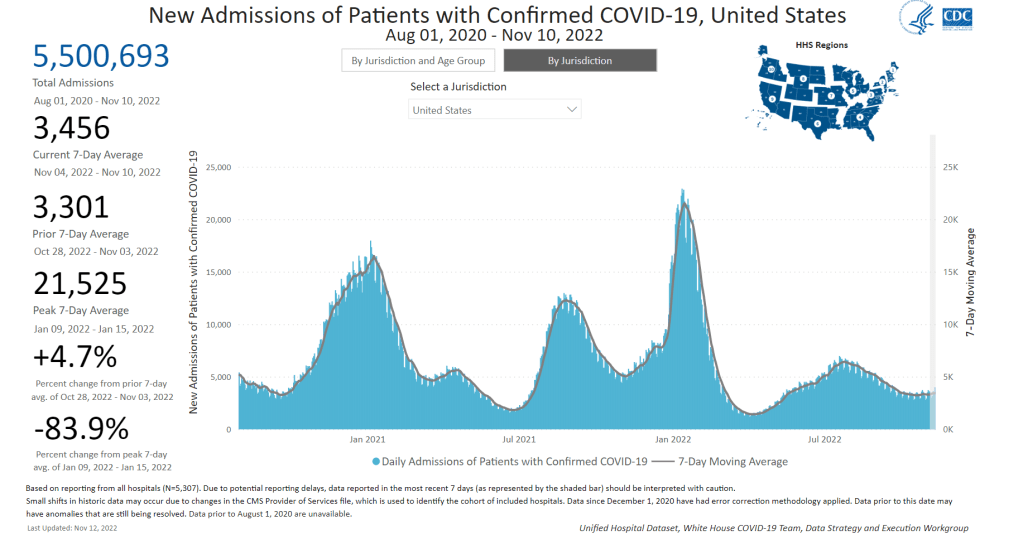
In the past week, the U.S. also reported about 24,000 new COVID-19 patients admitted to hospitals. This amounts to:
An average of 3,400 new admissions each day
7.3 total admissions for every 100,000 Americans
1% fewer new admissions than last week
Additionally, the U.S. reported:
2,200 new COVID-19 deaths (320 per day)
50% of new cases are caused by Omicron BQ.1 and BQ.1.1; 8% by BF.7; 5% by BN.1; 2% by BA.2.75 and BA.2.75.2 (as of November 19)
An average of 400,000 vaccinations per day
Nationwide, reported COVID-19 cases and new hospital admissions are still in a plateau; both metrics declined very slightly this week after rising slightly last week (declining by 3% and 1%, respectively).
While we have yet to see as clear of a fall/winter surge as we did in the last two years, infection levels are still quite high. Evidence for this comes from wastewater data, which doesn’t rely on people getting PCR tests; trends from Biobot suggest that viral transmission is at a similar level to late October/early November of last year, when Delta was still the dominant variant.
Biobot’s data also indicate that the West coast region is now seeing a notable uptick in COVID-19 spread, taking over from the Northeast (which has been a regional hotspot since September). Wastewater testing sites in cities like Los Angeles is reporting significant transmission spikes in the last couple of weeks.
The West coast, like the Northeast, has been a hotspot for newer Omicron subvariants BQ.1 and BQ.1.1, according to CDC estimates. Nationwide, the BQ lineage caused about half of new cases in the last week—solidly outcompeting its parent lineage, BA.5. And there are several other Omicron subvariants spreading, including two lineages from BA.2, BF.7 and BN.1.
With all these new variants circulating and colder weather throughout the country, why haven’t we seen a significant jump in COVID-19 spread? It’s possible that the U.S. has enough prior immunity from vaccinations and past infections to prevent a big surge, White House COVID-19 coordinator Ashish Jha said at the STAT Summit last week.
I hope Jha is right, but I personally remain skeptical. Way too few people have received the new booster shots that protect against Omicron variants, while we’re heading into several weeks of holiday travel and gatherings—with fewer COVID-19 protections than in the last two years.
At the same time, the U.S. is dealing with flu and RSV surges. About a dozen states, plus New York City and Washington, D.C., reported “very high” levels of influenza-like activity in the week ending November 12, according to the CDC. And the country’s RSV wave continues at high intensity, though it might be reaching its peak.
These two respiratory diseases may be less severe than COVID-19 at an individual level (especially accounting for the burden of Long COVID), but they can still put intense pressure on healthcare systems—especially those focused on treating children. Wearing a mask, avoiding indoor crowds, improving ventilation, and other measures can protect against all three diseases.
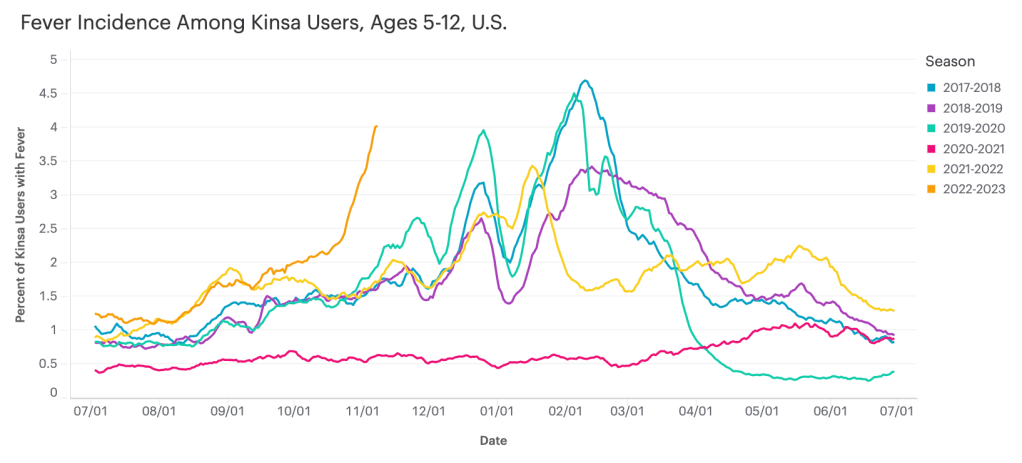
Data from Kinsa suggest that diseases causing fever are rising sharply among children ages five to 12, compared to past fall/winter seasons.
I recently learned about the Kinsa HealthWeather dashboard, a resource providing COVID-19 risk estimates by state and county based on data from smart thermometers.
Kinsa is a health tech company based in San Francisco that offers a health app paired with a smart thermometer. Users can submit their temperature data and symptoms to receive guidance on how to manage their illness. And at the population level, epidemiologists and data scientists can predict disease prevalence based on information from 2.5 million households using the app.
Danielle Bloch, epidemiology lead at Kinsa (and a former COVID Tracking Project volunteer, like myself), explained the process this way:
The data come from a network of 2.5 million households (of which about 600,000 users have taken a temperature in the past year) that have opted in to share information about their body temperature and symptoms, which are recorded through an app and smart thermometer. We’re currently in the process of updating our site to better incorporate other circulating infectious illnesses beyond COVID (Flu, GI symptoms, other respiratory infections) given the current landscape of diseases.
Right now, Bloch said, Kinsa’s data are showing an increase in fevers across the U.S.—with the biggest uptick in children ages five to 12. This trend likely reflects increasing COVID-19, flu, and RSV spread all at once.
As official case data from public health agencies become less reliable, new sources like Kinsa’s dashboard are a helpful way to continue tracking disease spread at the local level. I hope to see more sources like these in the future, along with more environmental monitoring (wastewater, air quality, etc.)
Updated booster doses by state: This week, the CDC started reporting how many people have received the bivalent, Omicron-specific boosters by state, including state-level data for several demographic groups (over age 5, over 12, over 18, and over 65). The numbers are low: Vermont and Washington, D.C. have the highest booster rates as of November 9, with 21% and 20% of their populations receiving the bivalent shots, respectively. In about half of states, less than 10% of the population has received an updated booster. (H/t Jason Salemi.)
Additional data suggests new boosters work against BQs: Speaking of the updated booster shots, a recent preprint from researchers at Emory University, Stanford University, and the NIH found that the new boosters produced several times more neutralizing antibodies against subvariants BQ.1.1 and BA.2.75.2 compared to the older vaccines. This was a small lab study and hasn’t yet been peer-reviewed, but it follows similar evidence from other research suggesting that the new boosters do provide additional protection against the most concerning variants currently circulating in the U.S. (See last week’s post.) If you haven’t gotten a bivalent booster yet, now is a good time!
More evidence that masks in schools prevent COVID-19 spread: Another notable new study this week, published in the New England Journal of Medicine: a group of researchers from Boston institutions examined the differences in COVID-19 case numbers between public school districts that kept mask requirements in place during spring 2022, and those that lifted their requirements upon a statewide policy change in February. Overall, ending required masking led to “an additional 44.9 COVID-19 cases per 1,000 students and staff” during the remainder of the semester, the researchers found. The study demonstrates that masks are still a useful public health strategy to reduce illness—and risk of Long COVID—in schools.
Paxlovid may reduce Long COVID risk: When Paxlovid first became available earlier in the year, some Long COVID patients reported that the drug helped alleviate their symptoms. A new study from Ziyad Al-Aly and his team at the Veterans Affairs St. Louis healthcare system provides evidence behind the anecdotal reports, finding that veterans treated with Paxlovid had a 25% lower risk of long-term symptoms, based on their electronic health records. The study has received some criticism (and has not yet been peer-reviewed); to me, it provides motivation for actual clinical trials examining Paxlovid’s use for treating Long COVID. RECOVER is running one such trial, but it won’t start until early 2023.
Estimating COVID-19 infections from wastewater: And one more study that caught my attention this week: researchers at the University of Florida used a modeling technique called a “mass balance equation” to estimate how many people in Gainseville, Florida were sick with COVID-19 based on the virus’ concentration in wastewater. Using about one year of wastewater data (May 2020 to May 2021), the researchers were able to accurately predict actual infections with an error of just 1%. Translating wastewater data into useful information for public health action has been a major challenge for the growing field, so I was glad to see this study providing a potentially-useful method.
This week, I had a story published at Kaiser Health News (KHN) about barriers that people with Long COVID are facing as they apply for disability benefits, focusing on programs offered by the federal Social Security Administration. For me, working on this story highlighted the consequences of the U.S.’s poor data collection on Long COVID.
The article shares stories from a couple of individual patients who are unable to work due to their Long COVID symptoms, but can’t access the support they need. Here’s how the story starts, focusing on Brooklyn mom Josephine Cabrera Taveras:
When Josephine Cabrera Taveras was infected with covid-19 in spring 2020, she didn’t anticipate that the virus would knock her out of work for two years and put her family at risk for eviction.
Taveras, a mother of two in Brooklyn, New York, said her bout with long covid has meant dealing with debilitating symptoms, ranging from breathing difficulties to arthritis, that have prevented her from returning to her job as a nanny. Unable to work — and without access to Social Security Disability Insurance or other government help — Taveras and her family face a looming pile of bills.
“We are in the midst of possibly losing our apartment because we’re behind on rent,” said Taveras, 32. Her application for Social Security disability assistance, submitted last fall, was rejected, but she is appealing.
Like many others with long covid, Taveras has fallen through the cracks of a system that was time-consuming and difficult to navigate even before the covid pandemic. People are facing years-long wait times, insufficient legal support, and a lack of clear guidance on how to prove they are disabled — compounded by the challenges of a medical system that does not have a uniform process for diagnosing long covid, according to health experts and disability attorneys.
Estimates of how many people might be in situations similar to Taveras vary widely. I cite a couple of differing estimates in the story: one report from the Brookings Institution suggests between two and four million people may be out of work due to Long COVID, while another from the National Bureau of Economic Research suggests the number is closer to 500,000.
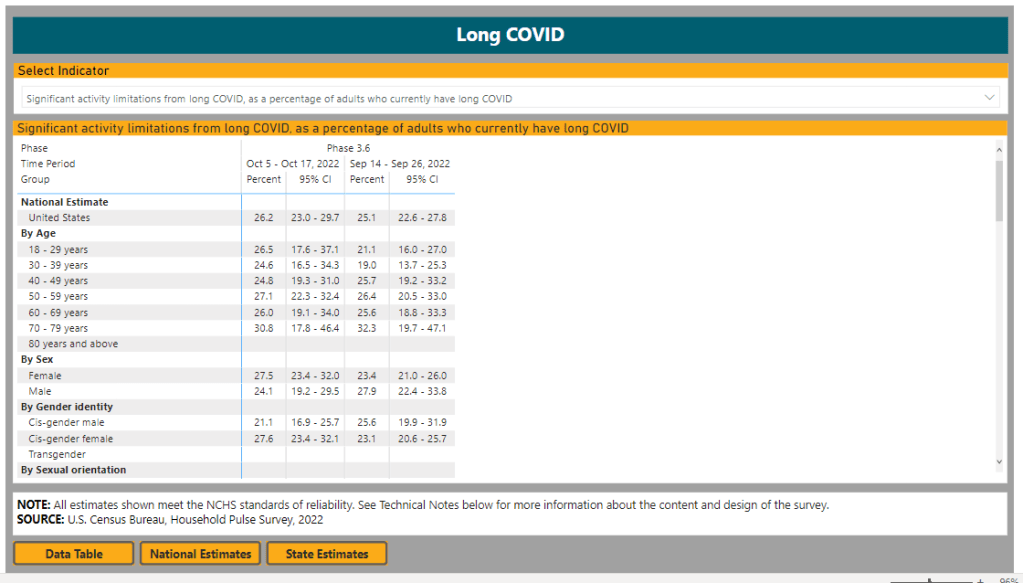
The CDC and Census’ Household Pulse Survey reports about 14% of all U.S. adults have experienced Long COVID symptoms, and about one in four adults who currently have Long COVID are experiencing “significant activity limitations” due to their symptoms. But the Social Security Administration itself said that it’s only identified 40,000 disability claims that “include indication of a COVID infection at some point,” in a comment for my story.
Why do these estimates vary so much? It goes back to the beginning of the pandemic, when PCR tests were not available to many people who likely had COVID-19 and early long-haulers were dismissed by their doctors. As we approach three years with COVID-19, there’s still no clear process for diagnosing Long COVID—much less a comprehensive system for identifying and tracking patients. (Many patients also might not yet identify as disabled, but will start looking for government support in the coming years, advocates pointed out to me.)
Right now, individual long-haulers lack standards or guidance for the medical paperwork they need to access programs like social security disability. And at a broader level, we lack clear estimates of how many people with Long COVID need these programs. The Household Pulse Survey has been a useful step towards such estimates in recent months, but more detailed data are needed to actually tackle the employment crisis that Long COVID presents.
Even so, we know enough to say that this is a crisis. For the story, I talked to Katie Bach, a senior fellow at the Brookings Institution and author of the report cited above. She told me that, while researchers disagree on the scale of Long COVID’s impact on employment, even the lowest estimates are reason for concern.
“Even if the bottom end of my range is overstated by 100%, we’re still losing $50 billion a year in wages,” she said. “I don’t think anyone who looks seriously at Long COVID would say this is not a significant problem for the U.S.”
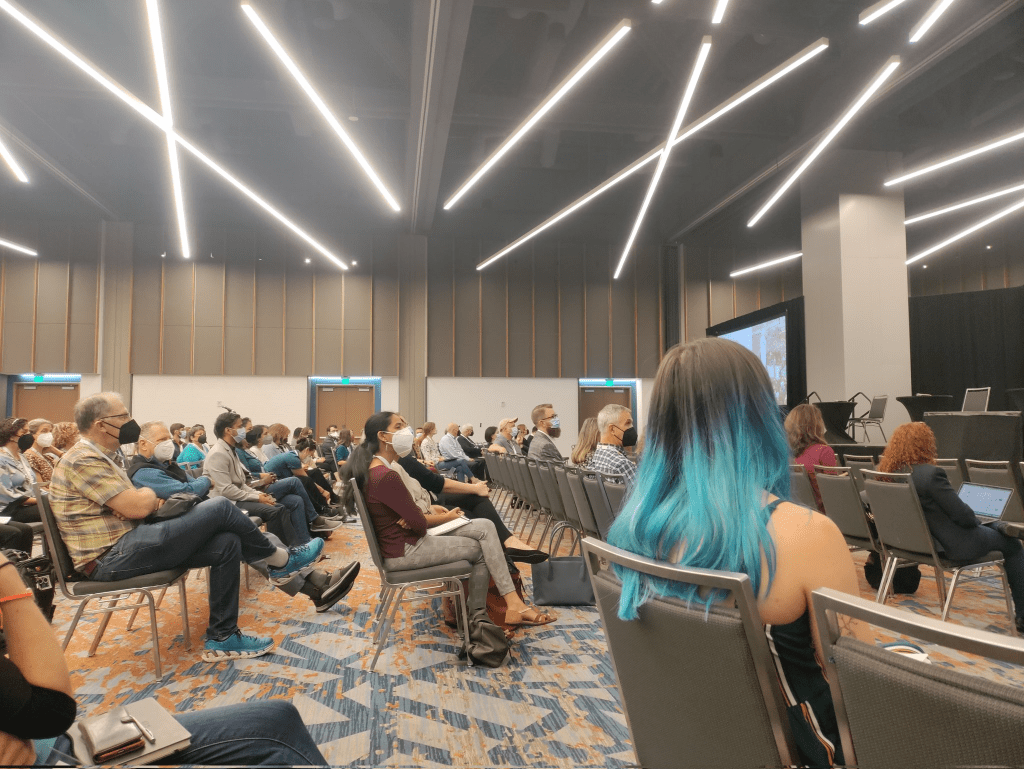
Masked Science Writers attendees watch a conference session. Photo by Betsy Ladyzhets.
A couple of weeks ago, I wrote that the Science Writers conference—which I attended in-person—had great COVID-19 safety policies, better than other events I’ve gone to this year.
The meeting of about 450 science journalists and communicators included required masks indoors, outdoor space for meals, and a vaccine requirement, among other safety measures. As I write this, about three weeks after the conference, there have been no reports of COVID-19 outbreaks (though the organizers were not requiring attendees to share all test results).
I’ve previously reported on COVID-19 safety at large events, so I wanted to learn more about how the Science Writers organizers planned the conference and communicated policies to attendees. To find out, I talked to Tinsley Davis, executive director of the National Association of Science Writers.
Davis shared behind-the-scenes insight into planning the 2022 Science Writers conference and tips for other event organizers. Her insight might be helpful whether you’re organizing a large journalism meeting or a small family gathering at Thanksgiving.
Rather than transcribing the entire interview, I wrote a paraphrased summary (with quotes from Davis throughout). Let me know what you think about this format in comparison to past Q&As!
Paying attention to COVID-19 news, planning in advance
Representatives from both organizations meet regularly on a steering committee to plan the annual meeting, Davis explained. In early 2021, that group paid attention to the vaccine rollout and started thinking about safety for a potential in-person meeting in the fall.
“We are very fortunate to have, amongst our volunteer leadership, science journalists and science communicators, and people who are generally paying very close attention to not only what’s happening in the news, but what’s happening in the research community,” Davis said. “And they’re paying to attention to it both out of professional interests, but also out of personal interest… So we can leverage that in our discussions, and we don’t need to separately bring people up to speed.”
These discussions led to initial plans for a hybrid meeting in October 2021, which would have both in-person and virtual components. The in-person conference planned to include a vaccine requirement and other safety measures. But in August, when the Delta variant surged across the country, NASW and CASW decided to shift the meeting to only virtual.
Still, the 2021 plans and discussions proved to be helpful when the steering committee began to plan the next year’s meeting. “When we started the conversation in earnest in early 2022, we looked back to those policies that we had developed for 2021 and used those as a base to start thinking,” Davis said.
Collaborating with the venue
Science Writers 2022 took place in Memphis, Tennessee, with most events at the Renesant Convention Center. But unlike other conferences I’ve attended this year, most sessions with food were not held inside the convention center: the center had space available outside for people to eat and drink in a much lower-risk environment.
I asked Davis about how she and the other organizers planned for outdoor dining. Staff at the convention center were very receptive to safety requests, she said: “We were met with such support and creativity.” This included closing down a street outside the conference center for one outdoor lunch event, and taking advantage of another outdoor area that was closed to traffic.
It’s worth noting here, the weather really worked in favor of outdoor dining and socializing. For most of the weekend, temperatures were pleasant (in the 60s and 70s) and there was no rain. “It was a beautiful fall weekend,” Davis said.
In addition to the outdoor plans, venue staff shared what they’d learned about COVID-19 safety from hosting other large conferences in spring and summer 2022, Davis told me. That included plans for how to arrange chairs in conference rooms for social distancing, and using security guards (required for crowd control) to help “gently remind” conference attendees to keep their masks on. Staff were also “readily able to talk about MERV ratings,” a measure of ventilation in the building, Davis added.
Conferences like Science Writers typically aren’t able to extend their COVID-19 safety measures beyond attendees—in other words, the organizers can’t require convention center staff to mask up. But staff at the Resenant Convention Center “were very thoughtful about masking up” in conference spaces, Davis noted. (I observed and appreciated this as well.)
Balancing safety and cost
One of the best measures to reduce COVID-19 spread at a large event is rapid testing at the door, a safety policy backed up by scientific studies. But this type of mass testing can get pretty expensive for a conference of about 450 people, the size of Science Writers this year.
“Cost is part of any decision,” Davis said. “And anytime you put the word ‘conference’ in front of something, it gets way more expensive. Like even a cup of yogurt gets more expensive when you have the words ‘conference catering’ in front of it.”
Operating with a limited budget, the Science Writers organizing committee chose to prioritize an independent vaccine verification system, so that staff didn’t need to check all attendees’ vaccine cards upon arrival. They used the CrowdPass system and required everyone attending in-person to submit their vaccination information before traveling to Memphis.
CrowdPass does offer on-site testing, Davis said. It would have been a great layer of safety, “but that was just an order of magnitude more expensive, and not something we could afford.” The conference also didn’t require attendees to report positive COVID-19 tests, though people were encouraged to stay home if they felt sick before the conference.
Communication and control
In the U.S.’s current COVID-19 environment, with rapidly-spreading variants and limited safety measures in most places, having an entirely COVID-free event is not really possible, Davis said. “What we did want to do is try and mitigate as much as possible in the spaces that we could control,” she explained.
“Spaces of control” included vaccine verification before the event, required masks in the conference center, and prohibiting eating or drinking during sessions so that attendees stayed masked in those settings. Outside of the official event—in spaces like hotel elevators or nearby bars—the conference organizers had less control.
But the safety policies for official events made it easier for attendees of varying COVID-19 risk comfort levels to participate. Making the conference broadly accessible was a priority for organizers, Davis said, as was providing safety information well in advance.
“We tried to be very thorough, very clear, communicate early, and to really manage expectations,” she said. “We wanted someone to know, when they registered, exactly the kinds of precautions that we would be taking as a conference, and what would be expected of them as an attendee, and to really underlie it with the ‘why.’”
Organizers aimed to clearly convey why this conference was taking COVID-19 safety so seriously: to help keep the community safe so that a wide group of people could participate. “We are so lucky as a community to be able to even ponder getting back together in person after two and a half horrible years, that we really owe it to each other, to be as thoughtful as possible,” Davis said.
Overall, the communication strategy seemed effective: throughout the conference, Davis had to remind “exactly one person” to put a mask on, she said. It probably helped that many people attending the meeting had reported on COVID-19, or at least had closely followed pandemic news in their communities.
“It was very heartening to see the level of, not just compliance with the COVID policies, but really the embracing of and the appreciation for them,” Davis said. Regardless of personal risk, everyone followed the conference policies.
COVID-19 safety as a statement of values
When I posted about the Science Writers conference’s COVID-19 safety policies on Twitter, one commenter pointed out that this meeting had “more precautions than some medical conferences.”
Incredible to see how Science Writers conference is taking more #COVID precautions than some medical conferences! https://t.co/skvFBRThi1
I asked Davis for her thoughts on this comment, as well as how the safety measures on display at the conference showed NASW and CASW’s organizational values. “Not being a medical professional myself, but being someone who organizes conferences, I’m really proud of the values that we were able to bring forward and really proud of our community for complying with them, if not embracing them,” she said. She acknowledged, however, that as a relatively small conference, Science Writers might have been able to prioritize safety in a way that would’ve been more challenging for a bigger event.
Our conversation ended with a few other tips for organizers of large events:
Make COVID-19 safety “a continuing part of the conversation,” not just a “box that you need to tick off.” Organizers should keep an eye on the evolving COVID-19 landscape and be prepared to adjust their policies if needed.
Think about accessibility tradeoffs, such as when and for whom masks should be required. For example, Science Writers allowed speakers to take off their masks while at a distance from audience members so that people could read their lips and see facial signals if needed.
Take note of any tricky situations that come up and plan for the next year, so that safety measures and communications can continuously improve over time.
Put your COVID-19 policies online! Davis and other organizers found it helpful to look at public safety policies from other organizations. “Someone will find the experiences you’ve had helpful in craft crafting their own event, even if it’s much, much smaller than yours,” she said.
COVID-19 hospitalizations have risen slightly in recent weeks, indicating the start of a fall/winter surge, according to CDC data.
In the past week (November 3 through 9), the U.S. reported about 290,000 new COVID-19 cases, according to the CDC. This amounts to:
An average of 41,000 new cases each day
88 total new cases for every 100,000 Americans
6% more new cases than last week (October 27-November 2)
In the past week, the U.S. also reported about 24,000 new COVID-19 patients admitted to hospitals. This amounts to:
An average of 3,500 new admissions each day
7.4 total admissions for every 100,000 Americans
5% more new admissions than last week
Additionally, the U.S. reported:
2,300 new COVID-19 deaths (340 per day)
44% of new cases are caused by Omicron BQ.1 and BQ.1.1; 8% by BF.7; 2% by BA.2.75 and BA.2.75.2 (as of November 12)
An average of 400,000 vaccinations per day
We are beginning to see the impacts of colder weather and new variants this week, as both official COVID-19 cases and new hospital admissions went up slightly: increasing by 6% and 5% from the prior week, respectively.
Wastewater monitoring similarly shows an uptick in coronavirus transmission at the national level, according to Biobot’s dashboard. The Northeast still has the highest virus concentration, but other regions of the country are catching up—particularly the West coast, which reported a significant increase in the last two weeks.
About half of the wastewater surveillance sites included on the CDC’s national dashboard reported increases in coronavirus transmission over the two-week period ending November 7, with 30% of sites reporting increases of at least 100%.
Omicron BQ.1 and BQ.1.1 are likely a major source of increased virus spread. These two strains—subvariants of BA.5 that are even more contagious—now account for 44% of new cases in the week ending November 12, according to CDC estimates. New variants tend to have an impact on transmission when they reach about 50% prevalence, so we will likely see more BQ-driven spread in the weeks to come.
The New York/New Jersey region continues to report the highest amounts of BQ.1 and BQ.1.1: these variants represented about 60% of new cases in the last week. These two states also reported some of the highest (official) case rates in the country last week, along with Puerto Rico, New Mexico, and North Dakota, per the latest Community Profile Report. Cases and hospitalizations in New York City, often a bellwether for the rest of the country, are rising again.
At the same time, the U.S. is seeing an early and intense flu season. Most of the country’s Southeast region (from Virginia to Mississippi) reported the highest possible levels of influenza-like activity in the week ending November 5, according to the CDC. Flu, COVID-19, and RSV are all straining hospitals as we head into the holiday season.
The new, Omicron-specific booster shots provide enhanced protection against the latest variants, but uptake remains very low—as shown by new CDC data providing vaccinations by state. Only 10% of the eligible population has received one of the new shots, as of November 9.
2/ Here is where we stand on the % of the population who has received the bivalent booster, for 4 age groups: – 5-11 years (national 0.5%) – 12-17 years (national 2.6%) – 18-64 years (national 6.4%) – 65+ years (national 23%)
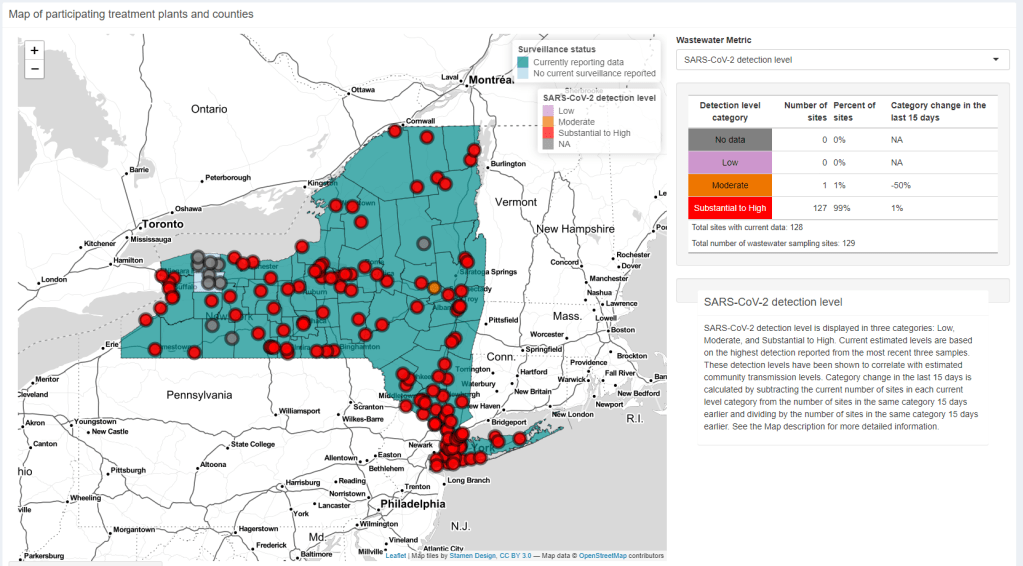
I look at a lot of wastewater surveillance dashboards these days—sometimes reporting on this type of COVID-19 data, sometimes trying to gauge my own risk level. The New York State Wastewater Surveillance Network’s dashboard is one of my favorites, both because I like how it’s set up and because of location bias (i.e. I live in New York).
The New York State network is a collaboration between state agencies and researchers at Syracuse University, the State University of New York, and others. It covers every single county in the state; most wastewater treatment plants included work directly with the researchers, with the exception of New York City (which does its own sampling and sends data to the state team).
On the dashboard, you can see the coronavirus detection levels and recent trends for every county. Then, upon clicking on a specific wastewater treatment plant, you can see time series of both coronavirus concentration in wastewater and reported COVID-19 cases. Seeing the time series is pretty important because it provides broader context on how current coronavirus levels compare to past trends.
NYC used to not be included on this dashboard, but the NYC sites were added in recent weeks. To me, this is a pretty big deal because the city doesn’t have its own wastewater dashboard (yet). For now, I’m adding the state dashboard to my regular rotation of local data sources.
New data on Omicron boosters: This week, we got two major updates on the safety and effectiveness of the bivalent, Omicron-specific booster shots from Pfizer and Moderna. First, a study in the CDC’s Morbidity and Mortality Weekly Report examined safety, finding that side effects of the new boosters similar to the side effects of previous vaccines, according to the agency’s vaccine surveillance systems. For example, about 60% of vaccine recipients experienced pain, swelling, or itching in the arms where they received the shot. And second, Pfizer and BioNTech shared new data about the companies’ bivalent booster, suggesting that the new booster produces four times more neutralizing antibodies against BA.4 and BA.5 compared to the original booster shot. The study focused on older adults (over age 55) but is still helpful evidence that the new boosters are more effective against currently-circulating variants.
NIH RECOVER is preparing its first clinical trial: RECOVER, the National Institutes of Health’s flagship study to understand and eventually treat Long COVID, announced this week that it’s preparing clinical trials to test potential treatments. The first of these trials was recently posted to ClinicalTrials.gov (a site for tracking studies that have received federal funding). This trial will focus on testing Paxlovid for Long COVID patients, and RECOVER anticipates it will begin enrolling patients in early 2023. Patients have previously expressed concerns that RECOVER is moving pretty slowly with trials, considering how many Americans are impacted by Long COVID.
Patients Rising Now Congressional Scorecard: Speaking of government action on medical issues: Patients Rising Now, an advocacy organization focused on patients with chronic illnesses, recently published its first scorecard for Congressional representatives. The resource grades every Senator and House member in the 117th Congress based on how their voting record aligns with the organization’s priorities. While COVID-19 is not specifically mentioned in the grades, this scorecard could have implications for future pandemic-related votes.
COVID-19 vaccination and race/ethnicity inequities: A new paper from researchers at the University of Minnesota and Boston University examined how vaccination impacted COVID-19 mortality patterns in Minnesota. During the Delta and Omicron surges, the researchers found, mortality among middle-aged people of color was higher than mortality among white peoplein an age group ten years older. The paper shows that COVID-19 remains “a pandemic of the disadvantaged,” author Elizabeth Wrigley-Field wrote on Twitter. (Disclaimer: through my work at MuckRock, I am collaborating with BU researcher Andrew Stokes, one of the paper’s coauthors.)
RSV vaccine(s) could be coming soon: Finally, a bit of good news about another respiratory virus: two potential vaccines for RSV are likely to be under FDA review in the coming months. Pfizer recently reported promising results from a clinical trial of a vaccine for pregnant people, who pass antibodies to their children (thus reducing infant RSV risk). And U.S. pharmaceutical company GSK reported results from a trial testing its RSV vaccine for older adults.
This week, MuckRock (the public records and investigative nonprofit where I work part-time) launched a new project looking at the U.S. government’s response to the Long COVID crisis. I’m hoping that the project will build on previous work that I’ve done in this area, connecting the dots between different aspects of the crisis—with a focus on government accountability.
As a first step for the project, we’ve put together an AirTable form where Long COVID patients, advocates, caregivers, researchers, and others connected to this condition can share their experiences and story tips. If you’re part of the Long COVID community, please consider filling it out! The form is pretty short (just two required questions) and information you share won’t be used for publication without permission.
Long COVID patients and community members: I am working on a big project @MuckRock about the U.S. government's response to this crisis, and I'd like to hear from you! please consider sharing your experience in the form embedded here: https://t.co/LkQFpCRUna#LongCovid (1/4) pic.twitter.com/fa1iCF2UAe
MuckRock is also looking for other newsrooms that might want to collaborate on this project. If you’re a journalist who’s interested, please reach out to me at betsy@muckrock.com.
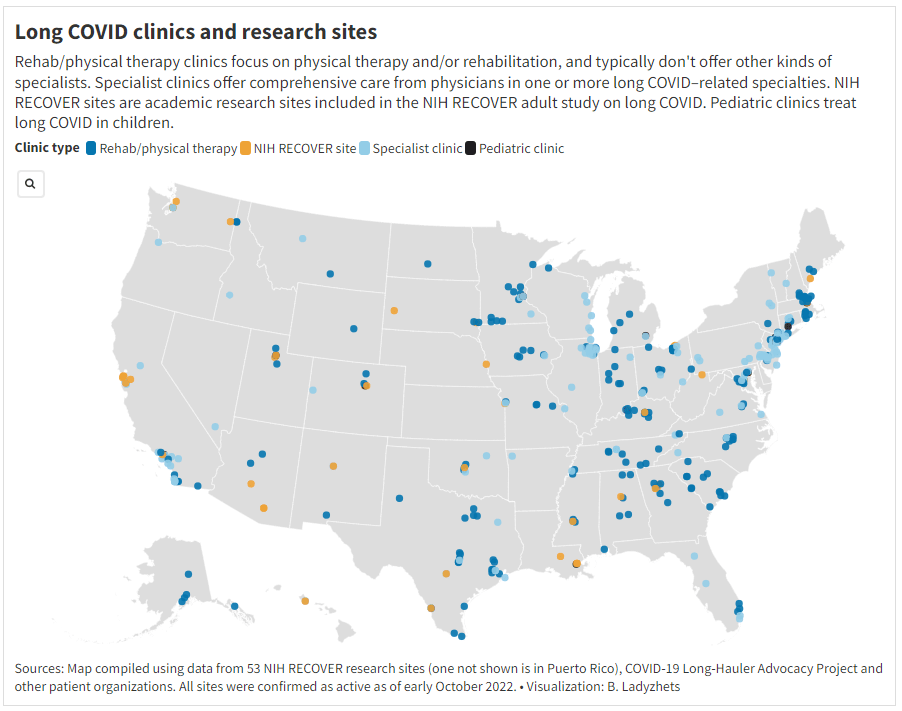
One topic that I’m hoping to dig into more is gaps in access to healthcare for Long COVID. A data project I did for Science News, published this week, shows that clinics dedicated to this condition are generally concentrated in big cities, particularly on the East coast. Yet many of the places with the highest Long COVID prevalence are rural areas in the South and Midwest, according to the Household Pulse survey.
This story shows just one small aspect of the barriers facing Long COVID patients trying to access the care they need. If you have more information to share about this issue, or anything else related to services needed for Long COVID, please consider filling out MuckRock’s callout form.
In the program—which is a collaboration between the agency’s Travelers Health Branch, biotech company Ginkgo Bioworks, and airport wellness company XpresSpa Group—travelers at four major airports can volunteer to be swabbed right after they get off the plane. The travelers’ test results are pooled by country of origin, meaning that analysts at Ginkgo combine their samples and PCR-test them together.
In addition to test positivity, Ginkgo also sequences the samples to identify variants spreading around the world. The program has included about 60,000 people between November 2021 and September 2022, according to the CDC. It’s now expanding to add more airports, with the CDC and Ginkgo working together to select international flights that should be targeted for testing.
Earlier this week, I talked to bioinformatics experts Andy Rothstein and Casandra Philipson, who work on the CDC travel surveillance program at Concentric (Ginkgo’s COVID-19 testing initiative), to learn more about how the program works. Swati Sureka from Ginkgo’s communications team also took part in the interview.
Here are a few key insights I learned from the conversation:
Travelers who volunteer to be tested don’t actually receive individual results back from Ginkgo, due to the company’s pool testing method. But they receive free at-home tests that can provide individual results.
Despite a relatively small sample size, the surveillance program tends to match global coronavirus variant trends from GISAID (a global repository of variant sequences).
The CDC uses data from this program as a complementary surveillance system, in coordination with the agency’s domestic variant surveillance, wastewater testing, and other systems.
Along with expansions to more airports, the Concentric scientists are working on testing wastewater from airplanes as another way to pull COVID-19 data from international travelers.
The experts named BQ.1 and BQ.1.1 as the most concerning variants they’re following right now, though the program has also picked up XBB.
This interview has been lightly edited and condensed for clarity.
Betsy Ladyzhets: I wanted to start by asking about the backstory behind the traveler-based genomic surveillance program. I’ve read a bit about it, but I’m curious to hear from you guys about how it got started and choices that have been made as you’ve expanded the program.
Andy Rothstein: Gingko has long recognized that biosecurity is an integral component to the growing bio-economy, even before COVID. But when spring 2020 came around, Ginko as an organization rapidly responded with a large commitment to the sequencing effort across the country… That really showed that there was an opportunity to grow a biosecurity business unit within Gingko, which became Concentric.
We built a K through 12 testing program, where we implemented this novel approach of pooled testing. We could have kindergarteners basically swabbing their noses in the classroom, everyone could put it one tube, it simplified the process, and we were able to get those results out quickly. But we really recognized that this is just one interface that can be a part of the biosecurity infrastructure.
We saw that travelers were this really important sentinel for bringing in new things like variants or tracking lineages. And we could combine the pooled testing approach with our sequencing capability at Ginkgo. Then, we got in contact with XpresSpa [now XpresCheck], which was pivoting their business model as well, because no one was going in the airports for manicures and massages. We approached them, as well as the CDC branch that deals with travel histories, quarantining, and things like that. We came to them to launch a pilot program in September 2021 as a proof of concept to say like, “Is this an interface that could provide valuable insights for public health and the CDC?”
We didn’t really know whether or not the pilot would work out. But we were one of the first to detect Omicron coming into the country in November [2021]. The program has now expanded, as of August 2022, into a two year program. And we’ve consistently been able to show that there’s real value in early warning, early detection through this novel interface.
Casandra Philipson: Gingko is an organism engineering company, we know that we’re going to be living with engineered organisms in the future. I think, because of that our founders have always had this prerogative to be able to have an early warning system or anomaly detection system for threats, whether or not they’re natural or manmade. And we have a lot of really smart people who had previous experience, in, like, Department of Defense surveillance exercises in the past. So I think there was an interest in early warning signals.
It’s also hard to be able to do surveillance in other countries, at least at that early, pandemic phase. And so this was a really easy way to have access to things that were coming in from other countries, that we otherwise wouldn’t have had access to.
BL: Yeah, that makes a lot of sense. I’m curious, building off of that, how is the CDC using the data that comes out of this program? Is it mostly about new variants? Or are there other things they’re kind of doing with it?
AR: CDC has a lot of complimentary surveillance systems ongoing, especially for SARS-CoV-2, that they’ve built up, whether it be clinical or whether it be wastewater. This is a novel interface for them to be detecting new things coming into the country. And so we really help source and, I guess, consolidate what is coming into the country and whether or not it’s a bad thing, or part of the existing evolution of SARS-CoV-2.
We work in tandem with them weekly, to not only optimize this program, but also give insights into the data that’s coming out. The [travel surveillance page of the] COVID Data Tracker has been a good culmination of all of this work that we’ve been doing. We can broadcast that publicly and show, almost side-by-side, here’s what’s happening in United States; here’s what’s happening, potentially coming into the United States.
BL: I did want to ask more about that new page on the COVID tracker, because I’m curious what you would want the average viewer to take from those charts. What should folks be getting out of both the test positivity rate and the variants?
AR: The first part is this test positivity rate. What we’ve seen is that, as testing declines in countries around the world, whether that’d be the appetite for testing or the funding for testing, we have a new sentinel to see what, potentially, the positivity looks like around the world. There’s been a number of times that we, in our program, have matched positivity rates in a country of origin [for a group of travelers]. Then as testing stopped [in that country], we still are picking up a positivity rate. For the public that is looking at this chart, it’s an opportunity to see into the window: What’s the global picture of what’s coming into this country?
Positivity is the first lens of data. The next is that we actually sequence, and we are understanding what is the breakdown or the frequencies of different variants coming into the country. You can see how what’s happening on [the CDC’s U.S. variant surveillance page] is lining up with the frequencies in our program. And because we’re finding new things, we end up sort-of being ahead of the curve in terms of what those frequencies might end up being in the United States.
BL: So you’re talking about comparing the CDC’s variant proportions estimates versus the travel estimates.
AR: Yeah, exactly. And the wastewater estimates… Not everybody is necessarily going and seeking testing when they’re sick with COVID, they might be doing an at-home test. So we’re using all of those [data systems] in a complementary sense to find, like, what’s a holistic picture of the SARS-CoV-2 coming in and outside of the United States?
BL: I also wanted to ask about, so like, if I’m a traveler coming into the U.S. at one of these airports where you have this program, how is it advertised? And what do people learn about it when they decide to volunteer to get tested?
AR: We have these pop-up testing booths, in collaboration with XpresCheck. They’re our on-the-ground infrastructure to basically be recruiting folks coming off of international flights. All the international flights go into one bottleneck where you’re going to leave the terminal, and you have an opportunity to see this booth that has some information about like, testing for public health, with the CDC logo—basically recruiting folks to come in. Folks that volunteer, they swab their noses and then we are pooling [tests] by those countries. We also have been giving them free, individual tests to take home.
We’re not collecting or giving back individual testing data to [the volunteers]. But we are showing that this is a part of the public health program. What we’ve found, through survey results, is that participation has really been increased by the fact that people feel like they’re being a part of this public health program and they want to help. We have great recruiters on the ground.
BL: So people don’t get their individual results, but you said they get an at-home test that they can use?
AR: Yeah. And then they can get their individual results [from that test]… They don’t get the pooled result.
BL: Are the data that you’re getting from this program linked to any other data? Because I know one big concern with variants is like, is a new variant going to be more severe? Is it going to be more likely for people to be hospitalized? So is there any capacity to link the tests that you’re doing with, say, hospitalization records?
AR: I think it’s a great idea, a great direction. Right now, we haven’t been linking those clinical data… We can try to look at the data within our program, and then contextualize it [using other sources] on what might be happening, in the United States or in origin countries.
But we’ve also been really excited about expanding our passive detection through wastewater. We’ve done an R&D project where we were looking at wastewater testing off of aircraft. So, that’s another complimentary data set off of the aircraft itself to help get a more holistic picture—not everyone is going to be using the bathroom [on the plane], but not everyone is going to be volunteering in this program.
BL: Testing the wastewater off the airplane seems like a great idea, I would not have thought of that.
AR: Yeah, we’re really excited about the opportunity to do something along those lines, since folks aren’t always going to volunteer to swab their nose.
We’re pooled testing by country, so we know that folks are coming from specific places. We can also—they can volunteer to give us any past travel history, so that we can try to link those data on our own. But there’s no systematic way to link [our results] to clinical data.
CP: Our sweet spot is microbes and viruses. So we actually don’t collect individual data that would allow us to associate an individual with their health record at all. I just wanted to emphasize that.
BL: That makes sense. I know that [linking datasets] is something that is very challenging to do, even with established health systems. I was just curious.
Swati Sureka: I can add one thing, just in terms of the knock-on benefits of the program. Say we do get early warning of an emerging variant that could potentially be of concern, that we don’t know on the global stage yet. We work directly with the CDC on getting them access to those [test] samples so that they can do direct viral characterization. Because, with emerging variants, it’s hard to get your hands on samples of it to be able to conduct research on how the virus behaves. I think that’s one of the side benefits, being able to actually pull those samples and share them directly with the CDC.
BL: Are there any variants that you’re all particularly watching right now? Like, I know, there’s been a lot of news about XBB, that’s spreading in East Asia. From your perspective, what are you seeing as concerning hotspots at the moment?
AR: Yeah. This is a big part of what our team does: as this data comes in, understanding what might be the trends happening globally. We have repeatedly shown that we can do early warning, [our data are] some of the first to identify a variant of concern. We can look and say, like, there’s certain mutations that we know, either from past variants or in predictive space, that [indicate this new variant is] going to be a problem for immune escape.
Variants that I think we’ve been really keeping an eye on and telling our CDC partners about are BQ.1 and BQ.1.1, which have been split out by CDC in the last couple of weeks. Our program was one of the first to identify and actually designate this BQ.1 variant. So we saw, early on, that it had characteristics because of its mutational profile [allowing it to] take hold. We continue to watch that.
The United States has been, pretty much, a few weeks to a month behind trends that we see in Western Europe. So I think it’s been pretty clear that BQ.1 is going to be something to watch for, as it sort of expands in its frequency… We also see XBB in our program, we’ve seen it as well. I think it’s going to be an interesting new chapter of SARS-CoV-2 evolution where we have potentially co-circulating variants of concern that have different dynamics in different parts of the world.
BL: Yeah, it’s very interesting… One other thing I wanted to ask you about is sample size. It seems like, from the data on the CDC dashboard, that you’re working with a small number of airports and a limited sample, compared to the number of international travelers coming into the U.S. So how do you think about analyzing that, and potentially expanding the sample?
AR: Definitely part of our plan is to ramp up the number of samples that we can get, as well as the number of airports that we might be operating out of.
But I think it’s just remarkable to talk about this program, when you see such a small sample size, and we’re still able to find new things and match GISAID, or global variant frequencies. It highlights, even with a small sample size, that the way that we’ve designed the program and the way our CDC counterparts think about where we’re going to be, what flights are we going to be choosing—that has been really, really successful so far. You always want more samples in science, but I think we’re working with what we have, and we’re excited to be expanding.
BL: That makes sense. So you’re able to say, “We want to send people to these flights, because this country has concerting variants right now,” that kind of thing?
AR: Yeah. Our CDC counterparts are tapped into both the CDC-wide conversations about variants and the global, WHO conversations about variants. So they’ll give us indications when there might be something to think about. And, again, this program is super nimble in its ability to pivot. When we think we want to focus on certain regions of the world, [we can recruit from specific flights].
It’s nice to be working in airports that have these direct flights and these long-haul flights. But thinking about how we prioritize is definitely—the CDC folks are thinking about this, and we sort-of help support them.
BL: The last main thing I wanted to ask about is, obviously in the U.S. and globally, we’re seeing so much less PCR testing now than we had at earlier points in the pandemic. How are you and—to any extent that you can talk about it—how are partners at the CDC thinking about making sure that we’re collecting a lot of samples from diverse settings, and looking in different places, looking at wastewater, and just continuing to keep track of what variants are circulating?
AR: I think back to, finding novel places to sample things. Like, the fact that we’ve invested and tried to build capability to do aircraft wastewater testing is just adding a complementary [data layer]. We’re going to have this layered interface or layered system where we might have some PCR tests, we might have wastewater, we might have sequencing, we might not have sequencing.
We’re figuring out, how do we just keep adding and keep building on this biosecurity infrastructure. I mean, the worst thing that could happen from this is we build all this and then no one uses it again, until something pops up. We’re really invested in finding new and novel ways to sample and to detect, and eventually sequence if we can get more robust data, like on variants.
BL: That makes sense. I wonder to what extent it can one day be useful for other viruses, too. I know we’re in a bad flu moment right now, or at least the beginnings of maybe a more intense flu season this year. And I know experts always talk about, like, “Can we read the tea leaves from the Southern hemisphere?” So that makes me think, “Okay, could we actually sample people who are coming in? And see if they have the flu, and not just COVID?” Or other things of that nature?
CP: This is something that keeps me up at night. Without being too forward-looking, absolutely, I would say, there are some commercial products out there right now—like from Illumina, which is a massive sequencing behemoth, they’ve just released some new sequencers on their end. They have this panel of, like, 66 viruses that you can detect in one panel. I think we’re gonna see more of that from many different types of partners who are looking at surveillance.
Moving beyond SARS-CoV-2, could samples be used for that? We’ve seen lots of publications that definitely prove that’s true. I think it’s right on cue, hopefully, with where we’re all headed.
BL: Yeah, I hope so. Well, those were all my main questions. Is there anything else you all think would be important for me to know about the program?
Swati Sureka: Stepping back, seeing how this [program] has played out over the past year, I’ve just been floored by, like, tens of thousands of people who have mobilized and participated and given samples in service of public health. For me, as a person who works in the communications space, I think we often hear a lot of these narratives of like, “People aren’t gonna do anything” or take any measures that they’re not forced to do.
People are inherently self-interested in all of these narratives that we hear. And it’s been really impressive to watch the participation that we’ve seen from travelers who want to help public health and want to help stop the spread, want to help pick up new variants. I don’t want to lose that thread of things.
BL: Totally. I can just envision, if you’re coming off a long flight, you just want to get through customs and get home. Taking a few extra minutes to get swabbed is not nothing.
AR: Yeah. And you could be doing that and say, “Oh, it doesn’t matter.” But we’re consistently seeing how helpful this data is, to inform all these complementary systems for building a biosecurity infrastructure. It’s really important data as we move forward.
BL: Yeah. When folks sign up, do you give them a link to the dashboard?
AR: Now we do. Now we can, right, it’s now live. It’s been really nice to have that public-facing thing, so that folks know where their efforts are going towards.